Journal List > Diabetes Metab J > v.43(5) > 1142396

Hwang, Jun, Jeong, Ahn, and Chung: Comparison of the Efficacy of Rosuvastatin Monotherapy 20 mg with Rosuvastatin 5 mg and Ezetimibe 10 mg Combination Therapy on Lipid Parameters in Patients with Type 2 Diabetes Mellitus

Abstract

Background

The apolipoprotein B/A1 (apoB/A1) ratio is a stronger predictor of future cardiovascular disease than is the level of conventional lipids. Statin and ezetimibe combination therapy have shown additional cardioprotective effects over statin monotherapy.

Methods

This was a single-center, randomized, open-label, active-controlled study in Korea. A total of 36 patients with type 2 diabetes mellitus were randomized to either rosuvastatin monotherapy (20 mg/day, n=20) or rosuvastatin/ezetimibe (5 mg/10 mg/day, n=16) combination therapy for 6 weeks.

Results

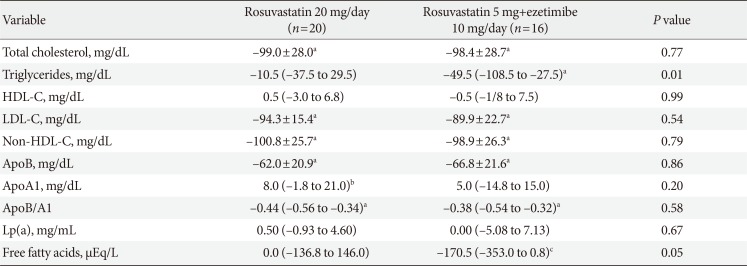
After the 6-week treatment, low density lipoprotein cholesterol (LDL-C) and apoB reduction were comparable between the two groups (−94.3±15.4 and −62.0±20.9 mg/dL in the rosuvastatin group, −89.9±22.7 and −66.8±21.6 mg/dL in the rosuvastatin/ezetimibe group, P=0.54 and P=0.86, respectively). In addition, change in apoB/A1 ratio (−0.44±0.16 in the rosuvastatin group and −0.47±0.25 in the rosuvastatin/ezetimibe group, P=0.58) did not differ between the two groups. On the other hand, triglyceride and free fatty acid (FFA) reductions were greater in the rosuvastatin/ezetimibe group than in the rosuvastatin group (−10.5 mg/dL [interquartile range (IQR), −37.5 to 29.5] and 0.0 µEq/L [IQR, −136.8 to 146.0] in the rosuvastatin group, −49.5 mg/dL [IQR, −108.5 to −27.5] and −170.5 µEq/L [IQR, −353.0 to 0.8] in the rosuvastatin/ezetimibe group, P=0.010 and P=0.049, respectively). Both treatments were generally well tolerated, and there were no differences in muscle or liver enzyme elevation.

Conclusion

A 6-week combination therapy of low-dose rosuvastatin and ezetimibe showed LDL-C, apoB, and apoB/A1 ratio reduction comparable to that of high-dose rosuvastatin monotherapy in patients with type 2 diabetes mellitus. Triglyceride and FFA reductions were greater with the combination therapy than with rosuvastatin monotherapy.

INTRODUCTION

A recent guideline on the treatment of blood cholesterol recommends the use of a high-intensity statin for individuals in four major statin-benefit groups to reduce the risk of cardiovascular disease [1]. However, the use of high-intensity statins can cause myopathy, elevated liver function, and new-onset diabetes [2]. Therefore, there has been an ongoing need for a new lipid-lowering drug with few side effects, strong cholesterol lowering efficacy, and protection against cardiovascular events. Ezetimibe is a new class of lipid-lowering drug that inhibits cholesterol absorption in the small intestine through direct binding with Niemann-Pick C1-Like 1 [3]. A recent study demonstrated that the addition of ezetimibe to a statin further lowered low density lipoprotein cholesterol (LDL-C) level compared with statin monotherapy. In addition, the combination of ezetimibe and a statin showed additional cardiovascular benefits [4].
Apolipoprotein B (apoB) and apolipoprotein A1 (apoA1) are major apolipoproteins in atherogenic lipoprotein particles and high density lipoprotein (HDL), respectively [5]. Many clinical studies have suggested that apoB and apoA1 predict cardiovascular risk better than conventional lipid parameters, including LDL-C and HDL cholesterol (HDL-C) [6]. Moreover, the ratio of these two apolipoproteins, the apoB/A1 ratio, illustrates the balance between atherogenic and anti-atherogenic lipoproteins. Several large prospective studies have shown that the apoB/A1 ratio is a more powerful predictor of future cardiovascular disease than conventional lipid parameters [7].
Therefore, our aim in this study was to compare the efficacy of daily 20 mg rosuvastatin monotherapy with that of daily 5 mg rosuvastatin/10 mg ezetimibe combination therapy daily on lipid parameters, including apoB/A1 ratio, in patients with type 2 diabetes mellitus (T2DM).

METHODS

Study subjects

Patients with T2DM (age ≥20 years) and LDL-C ≥130 mg/dL at baseline were enrolled. Exclusion criteria were treatment with a lipid lowering drug within 3 months of randomization, use of thiazolidinediones or insulin within 3 months before randomization, major cardiovascular events within 3 months of randomization, serum creatinine level ≥1.5 mg/dL, liver transaminases ≥2×upper normal limit, uncontrolled hyperthyroidism or hypothyroidism, and women who were pregnant or lactating. Of the 43 screened patients with T2DM, one patient was excluded, and 42 were enrolled in this study (intention-to-treat population). Among those 42 patients, six were lost to follow-up and did not complete the study, leaving the 36 patients eligible for the per-protocol analysis.
This study was carried out in compliance with the Declaration of Helsinki. Informed written consent was obtained from all participants, and the study was approved by the Internal Review Board (IRB) of Kyung Hee University Hospital at Gangdong (KHNMC IRB 2011-018).

Study design

This was a single center, open-label, randomized, active-controlled, parallel group study. The duration of the study was 7 consecutive weeks, including a 1-week screening period and a 6-week active-treatment phase. Based on previous studies performed in Korea [8], patients were allocated to either the rosuvastatin monotherapy group (20 mg/day) or the ezetimibe (10 mg/day) and rosuvastatin (5 mg/day) free combination group to achieve comparable LDL-C reduction. Together with lipid-lowering medications, all participants were educated about life-style intervention, including diet and exercise.

Clinical and laboratory examination

Comprehensive physical examinations were performed at baseline, and personal medical histories, including smoking status and alcohol drinking, were assessed using a questionnaire. Body mass index was calculated as the weight divided by the square of height (kg/m2). Waist circumference was measured at the midline between the iliac crest and the rib edge in a standing position. After participants rested for at least 5 minutes, their blood pressure was measured in a seated position with an automatic sphygmomanometer.
All blood tests were determined after an overnight fast of more than 8 hours. Using an autoanalyzer, plasma glucose was measured by the hexokinase method (Hitachi, Tokyo, Japan), which had a coefficient of variation of 1.7%. Plasma insulin was measured by radioimmunoassay (Biosource, Nivelles, Belgium), which had intra- and inter-assay CVs of 1.6% to 2.2% and 2.3% to 3.0%, respectively. To estimate insulin sensitivity and insulin secretory capacity, the homeostasis model assessment of insulin resistance (HOMA-IR) and homeostasis model assessment of beta cell function % (HOMA-B%) were calculated based on fasting plasma insulin and glucose levels, respectively [9]. The glycosylated hemoglobin (HbA1c) level was measured by high-performance liquid chromatography. The standard enzymatic (colorimetric) method was used with an autoanalyzer (Hitachi) to measure total cholesterol, triglycerides, HDL-C, and LDL-C. Plasma apoB and apoA1 concentrations were measured by the rate nephelometry method (Roche Diagnostics, Mannheim, Germany), and high-sensitivity C-reactive protein (hsCRP) was measured by the immunoturbidimetry method (Roche Diagnostics) using an autoanalyzer (Hitachi 7600). Plasma free fatty acid (FFA) concentration was measured by the colorimetric method (Wako Chemicals, Richmond, VA, USA).

Statistical analysis

The primary end-point was change in apoB/A1 ratio from baseline to the end of the 6-week treatment. Secondary end-points were changes in lipid parameter (total cholesterol, triglycerides, HDL-C, LDL-C, apoB, apoA1, FFAs, HOMA-IR, and hsCRP levels). Based on the results from a randomized study that investigated the effects of different lipid-lowering regimens on apoB/A1 ratio [10], the minimum number of evaluable cases per group was 19 subjects to ensure a power of 80% and a significance level of 5%. Considering a dropout rate of 10%, a total of 42 randomized subjects were planned.
Data are expressed as mean±SD for continuous measures or as proportions for categorical variables, except for skewed continuous variables, which are presented as the median (interquartile range, 25% to 75%). To compare differences between groups, the Mann-Whitney test and chi-square test or Fisher's exact test were used for continuous variables and categorical variables, respectively. All statistical analyses were performed with PASW version 18.0 (SPSS Inc., Chicago, IL, USA). A P<0.05 was considered significant.

RESULTS

Patient characteristics (intention-to-treat population)

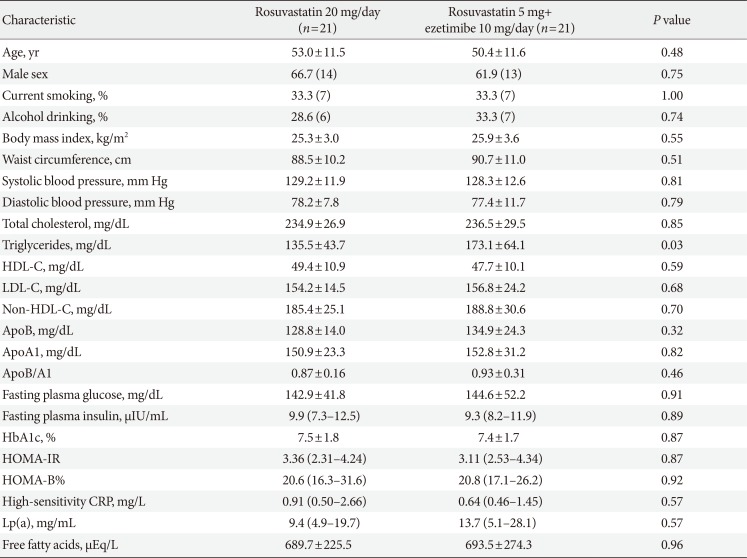
Table 1 shows the baseline characteristics of the study participants who were enrolled in this study. The mean age was 51.7 years and 64.2% were male. All variables were well matched, and there were no initial differences between the two groups, including baseline lipid parameters except triglycerides.

Changes in lipid parameters (per-protocol population)

After 6 weeks of treatment, LDL-C had decreased significantly in both the rosuvastatin group and the rosuvastatin and ezetimibe group (all P<0.001); however, no difference was observed in LDL-C reduction between the two groups (P=0.54). In addition, changes in apoB level and apoB/A1 ratio were similar between the two groups after 6 weeks of treatment (P=0.86 and P=0.58, respectively). However, both triglyceride and FFA levels decreased only in the rosuvastatin and ezetimibe group (all P<0.01), indicating significant differences between the two groups (P=0.01 and P=0.049, respectively) (Table 2). In addition, there were significant differences in the percent changes in triglyceride (−6.6% in the rosuvastatin group and −32.6% in the rosuvastatin and ezetimibe group, P=0.036) and FFA levels (0.0% in the rosuvastatin group and −25.9% in the rosuvastatin and ezetimibe group, P=0.046) between the two groups after treatment.

Changes in other parameters and safety profiles (per-protocol population)

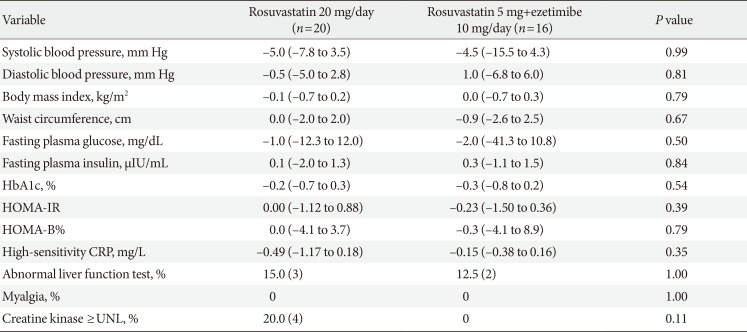
After 6 weeks of treatment, no changes were observed in blood pressure, fasting plasma glucose, HbA1c, or insulin sensitivity as measured by HOMA-IR in either group. In addition, the level of the inflammatory marker hsCRP did not decrease in either group, with no significant difference between the two groups after treatment.
Both treatments were generally well tolerated. A mild increase in liver enzyme levels was observed in both groups (≤2.5×upper normal limit). In addition, muscle enzyme levels increased in four subjects in the rosuvastatin group (≤2.5×upper normal limit) (Table 3).

DISCUSSION

In this 6-week prospective randomized controlled trial, low-dose rosuvastatin 5 and 10 mg ezetimibe combination therapy provided results comparable to high-dose rosuvastatin 20 mg monotherapy for the reduction of LDL-C, non-HDL-C, apoB, and apoB/A1 ratio in patients with T2DM. Both lipid lowering regimens were generally well tolerated, and no significant liver or muscle enzyme elevations were noted. In addition, reductions in triglycerides and FFAs were greater in the rosuvastatin/ezetimibe combination therapy group than in the rosuvastatin monotherapy group.
Previous studies that examined the efficacy of ezetimibe have mainly (1) compared it with placebo; (2) compared it with a statin; or (3) added it to a statin regimen. The first two of those designs are unlikely to produce clinically useful data because the cholesterol-lowering effect of ezetimibe is relatively weak compared to that of the statins [11], and the cardioprotective effects of statins have been established in diverse clinical settings [1]. Therefore, ezetimibe monotherapy is not usually prescribed. The addition of ezetimibe to a statin could be a good option to further lower LDL-C level, and a recent study has demonstrated the additional cardioprotective effects of statin/ezetimibe combination therapy compared with statin monotherapy [4]. However, side effects seen with statin treatment are directly related to statin dosage [12]. Moreover, a recent meta-analysis showed that the risk of hemorrhagic stroke is inversely related to total and LDL-C levels [13]. Given those safety issues, we tried reducing the statin dosage and adding ezetimibe in the hope of achieving LDL-C reduction comparable to that from high-dose statin monotherapy.
Based on previous studies [8101415] and our results, adding 10 mg of ezetimibe can allow the statin dosage to be reduced to one-fourth to one-eighth of the standard dose while still achieving equivalent total and LDL-C reduction. In our study, apolipoprotein level and apoB/A1 ratio did not differ between the low-dose rosuvastatin/ezetimibe combination therapy and the high-dose rosuvastatin monotherapy. Those results do not agree with the results from a previous study that showed a greater apoB/A1 lowering effect from 5 mg/5 mg atorvastatin/ezetimibe combination therapy than from 20 mg atorvastatin monotherapy in patients without familial hypercholesterolemia or diabetes mellitus [10]. We do not know the exact reason for that difference, but the use of different statins (atorvastatin vs. rosuvastatin), different ezetimibe doses (5 mg vs. 10 mg daily), and different patient populations (non-diabetics vs. diabetics) are all possible explanations.
Although we did not observe any differences in apolipoprotein level or apoB/A1 ratio, triglyceride and FFA reductions were greater in the combination group than in the monotherapy group. In contrast, previous studies have shown that the reduction in triglycerides was similar between low-dose statin/ezetimibe combination therapy and high-dose statin monotherapy [814]. In a study performed in individuals with primary hypercholesterolemia, the median change in triglycerides was identical between 5 mg/5 mg atorvastatin/ezetimibe combination therapy group and the 80 mg atorvastatin monotherapy group along with similar LDL-C reduction [14]. Another study performed in Korean subjects with high cardiovascular risk and the same lipid-lowering regimens that we used in this study found that the reduction in triglycerides was similar between the two groups [8]. The difference between that study and this one was the patient population (non-diabetics vs. diabetics), so further studies are warranted to determine the efficacy of ezetimibe for triglyceride reduction in subjects with and without diabetes.
FFAs are a major energy source in the body that originate from adipose tissue during lipolysis of triglycerides. Elevated plasma FFA concentration is closely related to cardiometabolic risk factors, including oxidative stress, insulin resistance, inflammation, atherosclerosis, and cardiovascular disease [16]. In a prospective cohort of 3,315 white individuals, FFA level was an independent predictor of all-cause and cardiovascular mortality in subjects with angiographically-proven coronary artery disease during a median 5.4 years of follow-up [17]. In addition, plasma FFA concentration was independently associated with incident heart failure in 4,248 adults >65 years old in the Cardiovascular Health Study [18]. Regarding the effect of lipid-lowering medications on plasma FFA concentration, a meta-analysis of data from 14 treatment arms showed that statin treatment significantly reduced plasma FFA concentration; however, change in plasma FFA concentration was independent of treatment duration and degree of LDL-C reduction [19]. In contrast, reports on the effect of ezetimibe on plasma FFA concentration have been inconsistent [202122]. In a small study of individuals with isolated hypercholesterolemia, a 3-month treatment with ezetimibe failed to show a further reduction in plasma FFA concentration compared with a lifestyle-modification-only group [20]. However, 40 mg/10 mg simvastatin/ezetimibe combination therapy for 12 weeks was more efficacious than 40 mg simvastatin monotherapy in plasma FFA reduction [21]. Furthermore, a study of patients with T2DM showed that a 6-month treatment of 10 mg ezetimibe was superior to 5 mg atorvastatin in plasma FFA reduction despite the superior total and LDL-C reduction in the atorvastatin group [22].
A recent study suggested that statin treatment, especially the use of high dosage, increased the risk of new-onset diabetes [23]. On the other hand, adding ezetimibe to a statin had a neutral effect on glucose tolerance and did not increase diabetes risk in individuals with prediabetes [24]. If those results are accurate, a low-intensity statin plus ezetimibe combination therapy could reduce the risk of incident diabetes while providing LDL-C lowering ability similar to that with a high-intensity statin regimen. In this study, fasting plasma glucose and HbA1c levels and HOMA indices were similar between the two groups after a 6-week treatment. Therefore, although we could not confirm the effect of ezetimibe on glucose tolerance because of our small sample and short-term follow-up, it would be interesting to determine the effect of a low-intensity statin plus ezetimibe combination therapy on glucose metabolism in individuals with a high risk of incident diabetes or prevalent diabetes.
This study has several limitations. First, it is small, with a short-term treatment period. Thus, subsequent long-term follow-up studies with a larger sample are necessary to confirm our findings. Second, we did not determine the effects of other statin and ezetimibe combination therapies on lipid parameters (apoB/A1 ratio, triglycerides, and FFA). Third, although triglyceride and FFA concentrations decreased more in the combination group than in the monotherapy group, it is still unknown whether the low-intensity statin with ezetimibe combination therapy provides additional cardiovascular benefits over high-intensity statin monotherapy. Therefore, a cardiovascular outcome study is needed to confirm the clinical significance of our findings.
In conclusion, 6 weeks of daily combination therapy with 5 mg/10 mg rosuvastatin/ezetimibe showed LDL-C and apoB/A1 ratio reduction comparable to that from 6 weeks of daily 20 mg rosuvastatin monotherapy in patients with T2DM. Reductions in triglycerides and FFAs were greater in the combination group than in the rosuvastatin monotherapy group. In addition, both treatments were generally well tolerated and did not cause significant side effects.

ACKNOWLEDGMENTS

None

Notes

CONFLICTS OF INTEREST: This study was financially supported by Daewoong Pharmaceutical Co, Ltd, Seoul, Korea.

AUTHOR CONTRIBUTIONS:

  • Conception or design: Y.C.H.

  • Acquisition, analysis, or interpretation of data: Y.C.H., J.E.J., I.K.J., K.J.A., H.Y.C.

  • Drafting the work or revising: Y.C.H.

  • Final approval of the manuscript: Y.C.H.

References

1. Stone NJ, Robinson JG, Lichtenstein AH, Bairey Merz CN, Blum CB, Eckel RH, Goldberg AC, Gordon D, Levy D, Lloyd-Jones DM, McBride P, Schwartz JS, Shero ST, Smith SC Jr, Watson K, Wilson PW. American College of Cardiology/American Heart Association Task Force on Practice Guidelines. 2013 ACC/AHA guideline on the treatment of blood cholesterol to reduce atherosclerotic cardiovascular risk in adults: a report of the American College of Cardiology/American Heart Association Task Force on Practice Guidelines. J Am Coll Cardiol. 2014; 63(25 Pt B):2889–2934. PMID: 24239923.
2. Thompson PD, Panza G, Zaleski A, Taylor B. Statin-associated side effects. J Am Coll Cardiol. 2016; 67:2395–2410. PMID: 27199064.
crossref
3. Sudhop T, Lutjohann D, Kodal A, Igel M, Tribble DL, Shah S, Perevozskaya I, von Bergmann K. Inhibition of intestinal cholesterol absorption by ezetimibe in humans. Circulation. 2002; 106:1943–1948. PMID: 12370217.
crossref
4. Cannon CP, Blazing MA, Giugliano RP, McCagg A, White JA, Theroux P, Darius H, Lewis BS, Ophuis TO, Jukema JW, De Ferrari GM, Ruzyllo W, De Lucca P, Im K, Bohula EA, Reist C, Wiviott SD, Tershakovec AM, Musliner TA, Braunwald E, Califf RM. IMPROVE-IT Investigators. Ezetimibe added to statin therapy after acute coronary syndromes. N Engl J Med. 2015; 372:2387–2397. PMID: 26039521.
crossref
5. Marcovina S, Packard CJ. Measurement and meaning of apolipoprotein AI and apolipoprotein B plasma levels. J Intern Med. 2006; 259:437–446. PMID: 16629849.
crossref
6. Sniderman AD, Furberg CD, Keech A, Roeters van Lennep JE, Frohlich J, Jungner I, Walldius G. Apolipoproteins versus lipids as indices of coronary risk and as targets for statin treatment. Lancet. 2003; 361:777–780. PMID: 12620753.
crossref
7. Walldius G, Jungner I. The apoB/apoA-I ratio: a strong, new risk factor for cardiovascular disease and a target for lipid-lowering therapy: a review of the evidence. J Intern Med. 2006; 259:493–519. PMID: 16629855.
8. Yang YJ, Lee SH, Kim BS, Cho YK, Cho HJ, Cho KI, Kim SY, Ryu JK, Cho JM, Park JI, Park JS, Park CG, Chun WJ, Kim MA, Jin DK, Lee N, Kim BJ, Koh KK, Suh J, Lee SH, Lee BK, Oh SJ, Jin HY, Ahn Y, Lee SG, Bae JH, Park WJ, Lee SC, Lee HC, Lee J, Park C, Lee B, Jang Y. Combination therapy of rosuvastatin and ezetimibe in patients with high cardiovascular risk. Clin Ther. 2017; 39:107–117. PMID: 28007331.
crossref
9. Matthews DR, Hosker JP, Rudenski AS, Naylor BA, Treacher DF, Turner RC. Homeostasis model assessment: insulin resistance and beta-cell function from fasting plasma glucose and insulin concentrations in man. Diabetologia. 1985; 28:412–419. PMID: 3899825.
10. Her AY, Kim JY, Kang SM, Choi D, Jang Y, Chung N, Manabe I, Lee SH. Effects of atorvastatin 20 mg, rosuvastatin 10 mg, and atorvastatin/ezetimibe 5 mg/5 mg on lipoproteins and glucose metabolism. J Cardiovasc Pharmacol Ther. 2010; 15:167–174. PMID: 20147603.
crossref
11. Pandor A, Ara RM, Tumur I, Wilkinson AJ, Paisley S, Duenas A, Durrington PN, Chilcott J. Ezetimibe monotherapy for cholesterol lowering in 2,722 people: systematic review and meta-analysis of randomized controlled trials. J Intern Med. 2009; 265:568–580. PMID: 19141093.
crossref
12. Golomb BA, Evans MA. Statin adverse effects: a review of the literature and evidence for a mitochondrial mechanism. Am J Cardiovasc Drugs. 2008; 8:373–418. PMID: 19159124.
13. Wang X, Dong Y, Qi X, Huang C, Hou L. Cholesterol levels and risk of hemorrhagic stroke: a systematic review and meta-analysis. Stroke. 2013; 44:1833–1839. PMID: 23704101.
14. Ballantyne CM, Houri J, Notarbartolo A, Melani L, Lipka LJ, Suresh R, Sun S, LeBeaut AP, Sager PT, Veltri EP. Ezetimibe Study Group.Effect of ezetimibe coadministered with atorvastatin in 628 patients with primary hypercholesterolemia: a prospective, randomized, double-blind trial. Circulation. 2003; 107:2409–2415. PMID: 12719279.
15. Kim KJ, Kim SH, Yoon YW, Rha SW, Hong SJ, Kwak CH, Kim W, Nam CW, Rhee MY, Park TH, Hong TJ, Park S, Ahn Y, Lee N, Jeon HK, Jeon DW, Han KR, Moon KW, Chae IH, Kim HS. Effect of fixed-dose combinations of ezetimibe plus rosuvastatin in patients with primary hypercholesterolemia: MRS-ROZE (Multicenter Randomized Study of ROsuvastatin and eZEtimibe). Cardiovasc Ther. 2016; 34:371–382. PMID: 27506635.
crossref
16. Pilz S, Marz W. Free fatty acids as a cardiovascular risk factor. Clin Chem Lab Med. 2008; 46:429–434. PMID: 18605928.
crossref
17. Pilz S, Scharnagl H, Tiran B, Seelhorst U, Wellnitz B, Boehm BO, Schaefer JR, Marz W. Free fatty acids are independently associated with all-cause and cardiovascular mortality in subjects with coronary artery disease. J Clin Endocrinol Metab. 2006; 91:2542–2547. PMID: 16595593.
crossref
18. Djousse L, Benkeser D, Arnold A, Kizer JR, Zieman SJ, Lemaitre RN, Tracy RP, Gottdiener JS, Mozaffarian D, Siscovick DS, Mukamal KJ, Ix JH. Plasma free fatty acids and risk of heart failure: the Cardiovascular Health Study. Circ Heart Fail. 2013; 6:964–969. PMID: 23926204.
19. Sahebkar A, Simental-Mendia LE, Pedone C, Ferretti G, Nachtigal P, Bo S, Derosa G, Maffioli P, Watts GF. Statin therapy and plasma free fatty acids: a systematic review and meta-analysis of controlled clinical trials. Br J Clin Pharmacol. 2016; 81:807–818. PMID: 26624855.
crossref
20. Krysiak R, Zmuda W, Okopien B. The effect of ezetimibe on adipose tissue hormones in patients with isolated hypercholesterolemia. Pharmacol Rep. 2014; 66:442–447. PMID: 24905521.
crossref
21. Krysiak R, Zmuda W, Okopien B. The effect of simvastatin-ezetimibe combination therapy on adipose tissue hormones and systemic inflammation in patients with isolated hypercholesterolemia. Cardiovasc Ther. 2014; 32:40–46. PMID: 24354929.
crossref
22. Sugiyama S, Jinnouchi H, Hieshima K, Kurinami N, Suzuki T, Miyamoto F, Kajiwara K, Matsui K, Jinnouchi T. A pilot study of ezetimibe vs. atorvastatin for improving peripheral microvascular endothelial function in stable patients with type 2 diabetes mellitus. Lipids Health Dis. 2015; 14:37. PMID: 25903215.
crossref
23. Dormuth CR, Filion KB, Paterson JM, James MT, Teare GF, Raymond CB, Rahme E, Tamim H, Lipscombe L. Canadian Network for Observational Drug Effect Studies Investigators. Higher potency statins and the risk of new diabetes: multicentre, observational study of administrative databases. BMJ. 2014; 348:g3244. PMID: 24874977.
crossref
24. Barkas F, Elisaf M, Liberopoulos E, Klouras E, Liamis G, Rizos EC. Statin therapy with or without ezetimibe and the progression to diabetes. J Clin Lipidol. 2016; 10:306–313. PMID: 27055961.
crossref
Table 1

Baseline characteristics of study participants (intention-to-treat population)

dmj-43-582-i001
Characteristic Rosuvastatin 20 mg/day (n=21) Rosuvastatin 5 mg+ ezetimibe 10 mg/day (n=21) P value
Age, yr 53.0±11.5 50.4±11.6 0.48
Male sex 66.7 (14) 61.9 (13) 0.75
Current smoking, % 33.3 (7) 33.3 (7) 1.00
Alcohol drinking, % 28.6 (6) 33.3 (7) 0.74
Body mass index, kg/m2 25.3±3.0 25.9±3.6 0.55
Waist circumference, cm 88.5±10.2 90.7±11.0 0.51
Systolic blood pressure, mm Hg 129.2±11.9 128.3±12.6 0.81
Diastolic blood pressure, mm Hg 78.2±7.8 77.4±11.7 0.79
Total cholesterol, mg/dL 234.9±26.9 236.5±29.5 0.85
Triglycerides, mg/dL 135.5±43.7 173.1±64.1 0.03
HDL-C, mg/dL 49.4±10.9 47.7±10.1 0.59
LDL-C, mg/dL 154.2±14.5 156.8±24.2 0.68
Non-HDL-C, mg/dL 185.4±25.1 188.8±30.6 0.70
ApoB, mg/dL 128.8±14.0 134.9±24.3 0.32
ApoA1, mg/dL 150.9±23.3 152.8±31.2 0.82
ApoB/A1 0.87±0.16 0.93±0.31 0.46
Fasting plasma glucose, mg/dL 142.9±41.8 144.6±52.2 0.91
Fasting plasma insulin, μIU/mL 9.9 (7.3–12.5) 9.3 (8.2–11.9) 0.89
HbA1c, % 7.5±1.8 7.4±1.7 0.87
HOMA-IR 3.36 (2.31–4.24) 3.11 (2.53–4.34) 0.87
HOMA-B% 20.6 (16.3–31.6) 20.8 (17.1–26.2) 0.92
High-sensitivity CRP, mg/L 0.91 (0.50–2.66) 0.64 (0.46–1.45) 0.57
Lp(a), mg/mL 9.4 (4.9–19.7) 13.7 (5.1–28.1) 0.57
Free fatty acids, μEq/L 689.7±225.5 693.5±274.3 0.96

Values are presented as mean±standard deviation, percentage (number), or median (interquartile range).

HDL-C, high density lipoprotein cholesterol; LDL-C, low density lipoprotein cholesterol; ApoB, apolipoprotein B; ApoA1, apolipoprotein A1; HbA1c, glycosylated hemoglobin; HOMA-IR, homeostasis model assessment of insulin resistance; HOMA-B%, homeostasis model assessment of beta cell function %; CRP, C-reactive protein; Lp(a), lipoprotein(a).

Table 2

Changes in lipid parameters after 6 weeks treatment (per-protocol population)

dmj-43-582-i002
Variable Rosuvastatin 20 mg/day (n=20) Rosuvastatin 5 mg+ezetimibe 10 mg/day (n=16) P value
Total cholesterol, mg/dL −99.0±28.0a −98.4±28.7a 0.77
Triglycerides, mg/dL −10.5 (−37.5 to 29.5) −49.5 (−108.5 to −27.5)a 0.01
HDL-C, mg/dL 0.5 (−3.0 to 6.8) −0.5 (−1/8 to 7.5) 0.99
LDL-C, mg/dL −94.3±15.4a −89.9±22.7a 0.54
Non-HDL-C, mg/dL −100.8±25.7a −98.9±26.3a 0.79
ApoB, mg/dL −62.0±20.9a −66.8±21.6a 0.86
ApoA1, mg/dL 8.0 (−1.8 to 21.0)b 5.0 (−14.8 to 15.0) 0.20
ApoB/A1 −0.44 (−0.56 to −0.34)a −0.38 (−0.54 to −0.32)a 0.58
Lp(a), mg/mL 0.50 (−0.93 to 4.60) 0.00 (−5.08 to 7.13) 0.67
Free fatty acids, μEq/L 0.0 (−136.8 to 146.0) −170.5 (−353.0 to 0.8)c 0.05

Values are presented as mean±standard deviation or median (interquartile range).

HDL-C, high density lipoprotein cholesterol; LDL-C, low density lipoprotein cholesterol; ApoB, apolipoprotein B; ApoA1, apolipoprotein A1; Lp(a), lipoprotein(a).

aP<0.001, bP<0.05, cP<0.01 for before and after treatment comparisons.

Table 3

Changes in other parameters after 6 weeks of treatment (per-protocol population)

dmj-43-582-i003
Variable Rosuvastatin 20 mg/day (n=20) Rosuvastatin 5 mg+ezetimibe 10 mg/day (n=16) P value
Systolic blood pressure, mm Hg −5.0 (−7.8 to 3.5) −4.5 (−15.5 to 4.3) 0.99
Diastolic blood pressure, mm Hg −0.5 (−5.0 to 2.8) 1.0 (−6.8 to 6.0) 0.81
Body mass index, kg/m2 −0.1 (−0.7 to 0.2) 0.0 (−0.7 to 0.3) 0.79
Waist circumference, cm 0.0 (−2.0 to 2.0) −0.9 (−2.6 to 2.5) 0.67
Fasting plasma glucose, mg/dL −1.0 (−12.3 to 12.0) −2.0 (−41.3 to 10.8) 0.50
Fasting plasma insulin, μIU/mL 0.1 (−2.0 to 1.3) 0.3 (−1.1 to 1.5) 0.84
HbA1c, % −0.2 (−0.7 to 0.3) −0.3 (−0.8 to 0.2) 0.54
HOMA-IR 0.00 (−1.12 to 0.88) −0.23 (−1.50 to 0.36) 0.39
HOMA-B% 0.0 (−4.1 to 3.7) −0.3 (−4.1 to 8.9) 0.79
High-sensitivity CRP, mg/L −0.49 (−1.17 to 0.18) −0.15 (−0.38 to 0.16) 0.35
Abnormal liver function test, % 15.0 (3) 12.5 (2) 1.00
Myalgia, % 0 0 1.00
Creatine kinase ≥UNL, % 20.0 (4) 0 0.11

Values are presented as median (interquartile range) or percentage (number).

HbA1c, glycosylated hemoglobin; HOMA-IR, homeostasis model assessment of insulin resistance; HOMA-B%, homeostasis model assessment of beta cell function %; CRP, C-reactive protein; UNL, upper normal limit.

TOOLS
Similar articles