

 PDF
PDF ePub
ePub Citation
 Print
Print


INTRODUCTION
Glycosylated hemoglobin (HbA1c) is used as a clinical indicator of the blood sugar level of an individual during the previous three months, and the World Health Organization proposes it as the sole diagnostic tool to determine a diagnosis of diabetes [12]. Blood glucose is the main factor affecting HbA1c. However, HbA1c measurements are influenced by other various conditions, such as hemolytic anemia [3], hemoglobinopathies [4], pregnancy [5], and altered by deficiency of nutritional factors, such as vitamin B12, folate, and iron [6789], leading to false-negative or false-positive results. Moreover, red blood cell life may also alter HbA1c results [10]. Recently, a review described the controversies about the relationship between HbA1c and iron-deficiency anemia (IDA) [8]. In fact, previous studies showed that in subjects with or without diabetes, IDA is associated with higher HbA1c levels, which decrease upon iron supplementation [111213]. Other works reported that, in individuals without diabetes and with iron deficiency, HbA1c measurements had no significant changes [14]. Conversely, Sinha et al. [7] observed that HbA1c levels in anemic subjects was significantly lower than in the control group. Considering the world wide prevalence of anemia [15] and the key role of HbA1c in diagnosing diabetes, the aim of this study was to verify the effects of iron-deficiency anemia on HbA1c values in nondiabetic individuals.
Go to : 
METHODS
Setting and participants
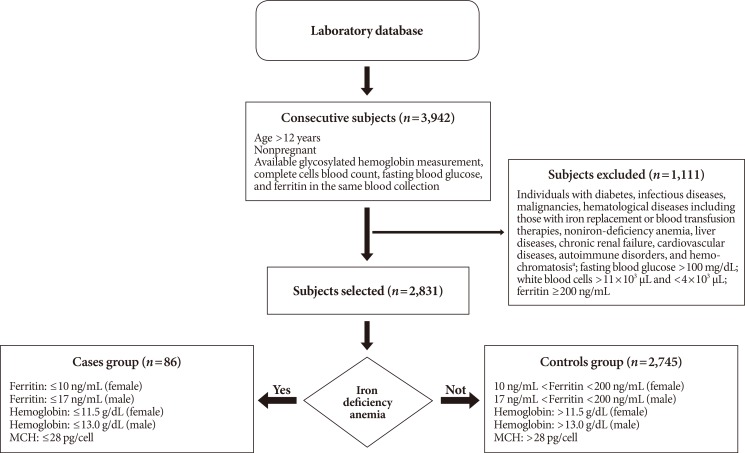
Laboratory data were collected from a sample of consecutive outpatients assessed from January 2000 to November 2016,in the Italian Hospital of Desio, Lombardy. Initially, this work included the following criteria for each subject: age ≥12 years [16], nonpregnant, at least one HbA1c measurement, complete cell blood count, and tests for fasting blood glucose and ferritin during the same date of blood collection. In the second step, all subjects affected by diabetes, infectious diseases, malignancies, hematologic diseases, including those with iron replacement or blood transfusion therapies, noniron-deficiency, liver diseases, chronic renal failure, cardiovascular diseases, autoimmune disorders, and hemochromatosis were excluded on the basis of diagnoses coded according to the International Classification of Disease (9th revision, clinical modification). Moreover, subjects with a white blood cell count less than 4×10³/µL and greater than 11×103/µL, and with fasting blood glucose levels greater than 100 mg/dL were not included. Finally, subjects with ferritin ≤10 ng/mL (if female) or ≤17 ng/mL (if male), hemoglobin ≤11.5 g/dL (if female) or ≤13.0 g/dL (if male), and mean corpuscular hemoglobin (MCH) ≤28 pg/cell were defined as anemic individuals (named Cases); subjects with ferritin levels between 10 and 200 ng/mL (if female) or 17 and 200 ng/mL (if male), hemoglobin >11.5 g/dL (if female) or >13.0 g/L (if male), and MCH >28 pg/cell were defined as normal individuals (named controls) (Fig. 1).
Measures
From 2000 to 2016, different analytical instruments were used to perform analysis. HbA1c levels were obtained using ion-exchange high performance liquid chromatography on different Menarini/ARKRAYADAMS A1c series HA (Menarini Diagnostics, Firenze, Italy) hemoglobin analyzers. All HbA1c results were reported in Diabetes Control and Complications Trial/National Glycohemoglobin Standardization Program (%) units and derived International Federation of Clinical Chemistry (IFCC) units (mmol/mol). The levels of hemoglobin, MCH, mean corpuscular volume (MCV), mean corpuscular hemoglobin concentration (MCHC), hematocrit, red blood cell count, white blood cell count, and differential leucocytes count were measured by the automated counter Sysmex XE 2100 (Sysmex, Norderstedt, Germany). All measurements were carried out on whole blood samples collected by vacuum into tubes containing ethylenediaminetetraacetic acid (EDTA).
Ferritin levels were measured by the electrochemiluminescence immunoassay method (ECLIA), and the fasting blood glucose level was measured by enzymatic reaction. Analysis was performed using automated chemistry analyzers, such as Modular and Cobas (Roche Diagnostics, Mannheim, Germany), on plasma samples collected by vacuum in tubes with lithium heparin as an anticoagulant.
Statistical analysis
The database was maintained using SAS software version 9.4 (SAS Institute Inc., Cary, NC, USA). HbA1c data were fitted as controls as terms, and age at the time of tests, gender, fasting blood glucose level, and year and month (to correct imbalances of the different methodologies and instruments used) of blood collection as covariates. HbA1c values were log-transformed to approximate normal distribution and homoscedasticity. Results were expressed as back transformation of least square means (i.e., the means adjusted for HbA1c [mmol/mol and %]). Hematological and biochemical values between iron-deficient anemia subjects and controls were compared using the Student t-test. According to the Bonferroni principle, a 0.05 comparison wise risk of type I error was used. P<0.05 was considered statistically significant.
Ethics statement
This study was granted the exemption from ethical approval (4525). Informed consent is not applicable due to a retrospective study.
Go to :
RESULTS
In this study, 3,942 consecutive nonpregnant individuals aged between 12 and 98 years with at least one HbA1c measurement, complete blood cells count, fasting blood glucose and ferritin values during the same date of blood collection were enrolled. Of these, 1,111 subjects were excluded, as described above. The final group consisted of 2,831 nondiabetic individuals, 1,508 males (53%) and 1,323 females (47%). Table 1 shows the hematological and biochemical variables of the participants. Eighty-six subjects were diagnosed with iron-deficiency, while 2,745 had a normal iron state (Table 1). Among the anemic group, iron deficiency was prevalent in females, with a ratio of 3.09:1. There were differences in the mean levels of hematological and biochemical parameters between subjects affected by IDA and controls (P<0.0001). In fact, hemoglobin, hematocrit, red blood cell count, MCV, MCH, MCHC, and ferritin values were lower in iron-deficient subjects (P<0.0001). Differences in the mean glucose levels between the two groups were absent (P=0.1526).
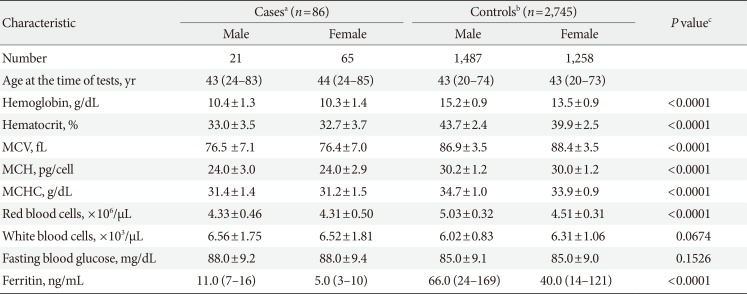
Table 1
Participants hematological and biochemical characteristics
Values are presented as median (5th–95th percentile) or mean±standard deviation.
MCV, mean corpuscular volume; MCH, mean corpuscular hemoglobin; MCHC, mean corpuscular hemoglobin concentration.
aCases, anemic patients (hemoglobin ≤13.0 g/dL for men and ≤11.5 g/dL for women, ferritin level ≤17 ng/mL for men and ≤10 ng/mL for women, MCH ≤28 pg/cell, fasting blood glucose <100 mg/dL), bControls, non-anemic patients (hemoglobin >13.0 g/dL for men and >11.5 g/dL for women, MCH >28 pg/cell, ferritin level between 17 and 200 ng/mL, fasting blood glucose <100 mg/dL), cComparison between cases and controls data was made by Student t-test. A P value of ≤0.05 was considered statistically significant.
![]()
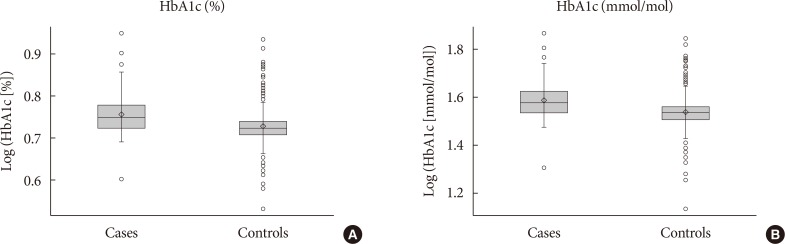
Both the mean HbA1c values and those adjusted for the covariates age at the time of tests, gender, year and month of blood collection, and fasting blood glucose showed significant differences between cases and controls. In fact, among subjects affected by IDA, nonadjusted and adjusted HbA1c values were statistically higher (5.71%, [38.64 mmol/mol], 5.59% [37.37 mmol/mol]) compared to those measured in the individuals without anemia (5.33% [34.78 mmol/mol], 5.34% [34.81 mmol/mol]; P<0.0001) (Fig. 2).
Go to :
DISCUSSION
HbA1c is a convenient clinical test with high reproducibility, and it reflects the average blood glucose level of subjects over the previous 3 months. Several factors, such as age, ethnicity, genetics, and many other diseases, can influence HbA1c measurements [13456]. Anemia is one of the diseases that most often affects HbA1c levels, and many studies have investigated their relationship [78917]. In this work, we wanted to consider the effects of IDA on HbA1c values among subjects without diabetes. Our results showed that nondiabetic individuals with IDA presented significantly higher HbA1c measurements when compared to those obtained in nonanemic subjects. These data are in agreement with results obtained in different studies, showing that IDA causes falsely elevated HbA1c measurements [6891417]. Conversely, Sinha et al. [7] observed that the mean HbA1c was significantly less in the nonanemic group than in the anemic individuals belonging to lower socioeconomic groups.
After iron therapy, anemic subjects presented HbA1c levels significantly higher compared to the initial values, suggesting that nutritional deficiencies play a key role in the cause of iron deficiency [7]. The exact mechanism underlying the IDA effects on HbA1c values is still unclear. A state of iron deficiency affects the lifespan of red blood cells, and the erythrocytes count is decreased, leading to an older population of red blood cells that are in contact with plasma glucose longer, causing falsely higher HbA1c measurements [17]. In a state of iron deficiency, the enzyme activity involved in the antioxidant defense system was defective, and, concomitantly, lipid peroxidation was increased [1819]. In patients affected by IDA, levels of malondialdehyde (MDA), which results from lipid peroxidation of polyunsaturated fatty acids, was recognized as a biomarker of oxidative stress [20], were significantly higher compared to those measured in the controls [19]. In vitro, HbA1c levels increased when erythrocytes were incubated with MDA, since aldehyde groups of MDA act as bridge between glucose and hemoglobin [18]. However, in vivo studies have not yet been performed to verify this biological process. Moreover, different works described a significant decrease of HbA1c values after iron treatment in anemic patients, suggesting that iron deficiency might be corrected before a diagnosis of prediabetes and diabetes is reached [111213]. The effects of iron supplementation were also observed on levels of oxidative stress markers in children, resulting in a decrease of MDA levels [19]. If MDA levels decrease, the glycation of hemoglobin tends to reduce, limiting the effects on HbA1c measurements [18].
The limitation of this study is that it is a retrospective study carried out at a single hospital. Increasing the number of individuals with IDA could improve the accuracy of the relationship between HbA1c and IDA. Second, confounding variables, such as body weight, smoking history, and alcohol intake, which could influence the results, are not available.
We conclude that the effects of IDA must be considered while monitoring people with prediabetes and diabetes. Therefore, a concurrent measurement of iron, hemoglobin, and HbA1c in anemic subjects might be required by clinicians to correctly interpret glycemic status and to increase the reliability of the HbA1c measurements.
Go to :
 XML Download