

 PDF
PDF ePub
ePub Citation
 Print
Print


INTRODUCTION
Metabolic syndrome (MetS) is a comorbid condition of metabolic origin that includes abdominal obesity, atherogenic dyslipidemia, elevated blood pressure (BP), and elevated plasma glucose level [1]. MetS is increasing in prevalence globally and has become one of the most important health problems worldwide [2] due to its relationships with cardiovascular disease (CVD) and type 2 diabetes mellitus [3].
Uric acid is the end-product of purine catabolism in humans [4]. The prevalence of MetS has been reported to increase with increasing baseline serum uric acid (SUA) level [5]. We also observed this relationship after adjusting for body composition in our previous study, which included the same subjects as the current study [6]. Elevated SUA level has also been suggested to increase the risk for CVD mortality [7].
However, there is substantial evidence that uric acid might also have an antioxidant capacity as a free radical scavenger [8910111213]. In addition, several studies have demonstrated that uric acid administration improves outcomes in patients with acute stroke [141516]. Similarly, in our previous study, although elevated serum albumin level, which also has an antioxidant capacity, was linked to increased risk of incident MetS, change in serum albumin concentration was inversely associated with development of MetS, demonstrating that increase in serum albumin concentration might protect against the risk of MetS [17].
Considering these data, it has been hypothesized that the antioxidant effects of increasing SUA level might protect against the development of MetS. Nevertheless, the longitudinal association between changes in SUA level and the development of MetS has not yet been evaluated. Thus, we designed this study to investigate the longitudinal effects of changing SUA concentration on the development of MetS during a 7-year follow-up period in a healthy study group.
METHODS
Study population and design
A retrospective longitudinal study was designed to evaluate the association between changes in SUA level and development of MetS. The study subjects were adults aged ≥18 years who participated in a medical health check-up program at the Health Promotion Center of Samsung Medical Center, Sungkyunkwan University, Seoul, Korea [18]. The check-up included annual or biennial evaluations of medical history, smoking status, anthropometric data, and laboratory data. Initially, 24,185 participants who attended at least four follow-up visits between January 2006 and December 2012 were assessed for eligibility.
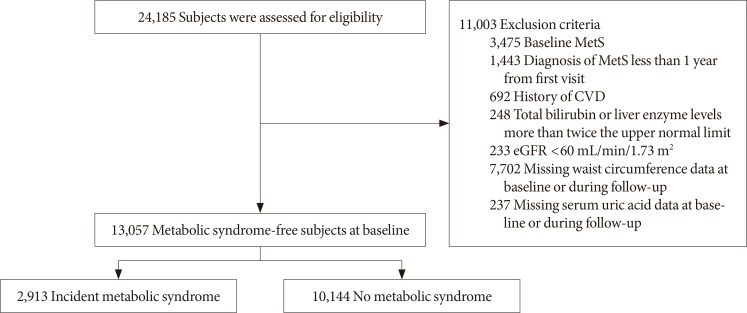
Among these participants, 11,003 were excluded because they were diagnosed with MetS at the baseline examination (n=3,475); developed MetS within 1 year of the first visit (n=1,443); had a history of CVD (myocardial infarction, bypass surgery, stroke, n=692); had total bilirubin or liver enzyme level more than twice the upper normal limit (n=248); had an estimated glomerular filtration rate (eGFR) under 60 mL/min/1.73 m2 (n=233); lacked waist circumference (WC) data at baseline or during follow-up (n=7,702); or lacked SUA data at baseline or during follow-up (n=237). Thus, 13,057 participants (7,694 male and 5,363 female) were included in the study (Fig. 1). The observation period for each patient continued until the patient was first diagnosed with MetS, or until the last follow-up visit if the patient was not diagnosed with MetS. The study was approved by the Institutional Review Board (IRB) of Samsung Medical Center (IRB No. SMC 2015-01-003-001). Informed consent was waived by the IRB.
Clinical and biochemical measurements
Weight, height, systolic BP, and diastolic BP were measured at each visit. BP was measured by trained nurses with a mercury sphygmomanometer on the right arm after the participant had been seated comfortably for at least 5 minutes. WC was measured at the plane across the iliac crest, which usually represents the narrowest part of the torso. Body mass index (BMI) was calculated as the body weight in kilograms divided by the square of the height in meters (kg/m2). The eGFR was calculated with the Modification of Diet in Renal Disease equation [19].
Venous blood samples were obtained after overnight fasting. Fasting plasma glucose (FPG), plasma insulin, triglyceride (TG), high density lipoprotein cholesterol (HDL-C), low density lipoprotein cholesterol (LDL-C), SUA, and creatinine levels were measured. However, we were unable to obtain plasma insulin level for 5,115 participants (2,529 male and 2,586 female).
The FPG concentration was measured with hexokinase and Bayer Reagent Packs on an automated chemistry analyzer (Advia 1650 Autoanalyzer; Bayer Diagnostics, Leverkusen, Germany), and fasting plasma insulin concentration was measured with an immunoradiometric assay (TFB Co. Ltd., Tokyo, Japan). TG, LDL-C, HDL-C, and SUA levels were measured by an enzymatic colorimetric method with a Modular D2400 (Roche Diagnostics, Basel, Switzerland).
Changes in SUA level were determined by subtracting the baseline level from the final level, which was measured at the end of follow-up in participants without incident MetS or one year before the date of diagnosis of MetS. The percent change in SUA was calculated as follows:
Percent change in SUA=(Change in SUA)/(Baseline SUA)×100
Definition of metabolic syndrome
The Joint Interim Statement of the International Diabetes Federation Task Force on Epidemiology and Prevention was used to define MetS [20]. Participants were recognized as having MetS if they met three or more of the following criteria: (1) abdominal obesity (WC ≥90 cm in male, WC ≥80 cm in female); (2) high BP (systolic BP ≥130 mm Hg or diastolic BP ≥85 mm Hg) or medical treatment for hypertension; (3) high TG (≥150 mg/dL) or medical treatment for elevated TG; (4) low HDL-C (<40 mg/dL in male, <50 mg/dL in female) or medical treatment for low HDL-C; and (5) elevated fasting glucose (≥100 mg/dL) or treatment for diabetes.
Statistical analyses
Data were analyzed with SPSS version 21 (IBM Co., Armonk, NY, USA) and R version 3.3.2 (R Foundation, Vienna, Austria; http://www.r-project.org/). Continuous variables with normal distributions were expressed as mean±standard deviation, whereas continuous variables with non-normal distributions were expressed as median and interquartile range. Categorical data were expressed as frequencies and percentages. Student's t-test or the Mann-Whitney U test was used to compare participant characteristics according to the development of MetS. Pearson's chi-square test was used to compare frequency distributions. Natural logarithm-transformed high-sensitivity C-reactive protein (hs-CRP) values were used in a Pearson's correlation model. The percent changes in SUA level were analyzed in quartile groups and with 1SD (standard deviation) percent changes in SUA as a continuous variable.
Multivariate Cox proportional hazards analysis was used to estimate the hazard ratios (HRs) and 95% confidence intervals (CIs) for incident MetS according to changes in SUA level. Collinearity tests for variables used in the multivariate Cox proportional hazards analyses were performed through linear modeling of the outcome variables, and the variance inflation factor (VIF) was calculated for the independent predictors. A VIF <5 was considered optimal to warrant stability. The sets of variables adjusted in the model were previously selected according to clinical relevance (i.e., smoking status [21]).
The initial model was adjusted for age, systolic BP, BMI, fat-free mass (FFM, %), eGFR, and smoking status (Model 1). Then, we additionally adjusted for fasting glucose, TG, LDL-C, and HDL-C levels (Model 2). To determine the independent effect of the percent change in SUA level on the development of MetS, we also added baseline SUA level as a covariate (Model 3). Because fasting insulin data were only available for 7,980 participants (5,188 male and 2,792 female), we also formulated a model that included fasting insulin level as an additional confounder (Model 4). Two-tailed probability values <0.05 were considered to indicate statistical significance.
RESULTS
Clinical characteristics of the study participants
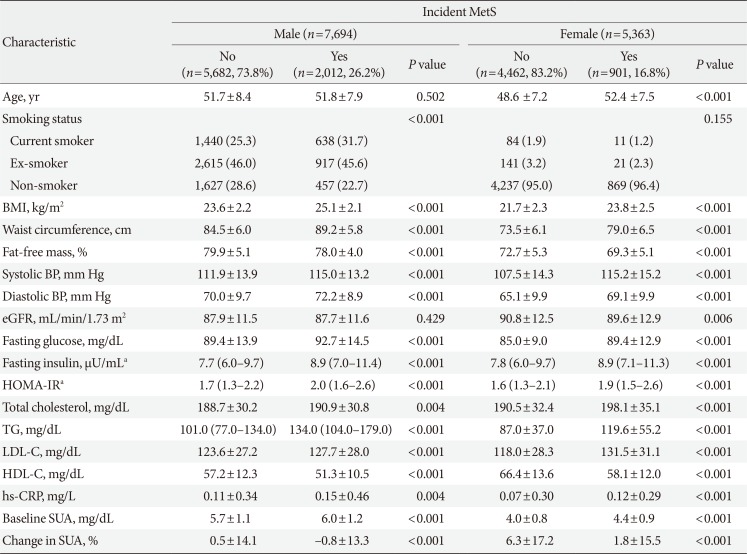
Table 1 displays the clinical characteristics and laboratory variables of the study participants with regard to the development of MetS. At baseline, the male who did not develop MetS were 51.7±8.4 years old, and those who did were 51.8±7.9 years old (P=0.502). The female who did not develop MetS were 48.6±7.2 years old at baseline, whereas those who did were 52.4±7.5 years old (P<0.001).
In both sexes, baseline SUA level was lower in those who did not develop MetS than in those who did (5.7±1.1, 6.0±1.2 mg/dL for male; 4.0±0.8, 4.4±0.9 mg/dL for female, respectively; P<0.001). On the other hand, the changes in SUA level in both sexes were higher in those who did not develop MetS than in those who did (0.5%±14.1%, −0.8%±13.3% for male; 6.3%±17.2%, 1.8%±15.5% for female, respectively; P<0.001).
Participants who subsequently developed MetS had higher BMI, WC, systolic BP, diastolic BP, fasting glucose, fasting insulin, homeostasis model assessment index for insulin resistance (HOMA-IR), total cholesterol, TG, and LDL-C levels, but lower FFM (%) and HDL-C levels than those who did not develop MetS in both sexes.
Clinical characteristics of the study participants based on percent change in SUA quartile category
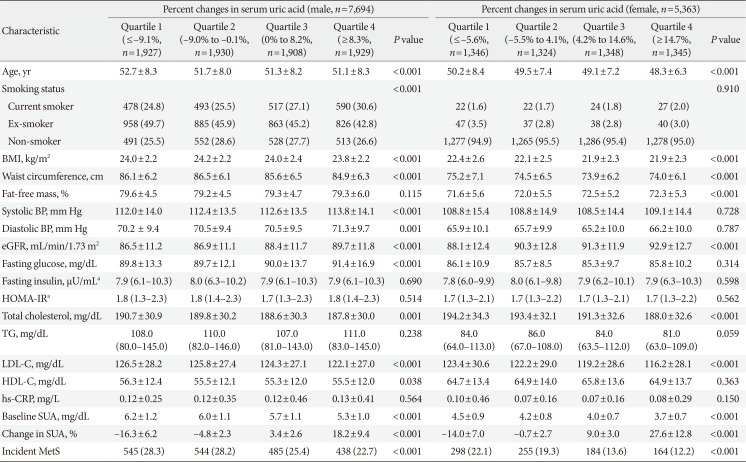
Table 2 presents the clinical characteristics and laboratory variables of the study participants based on the percent change in SUA quartile category. The percent change in SUA quartiles was positively related to the eGFR but negatively related to BMI, WC, total cholesterol, LDL-C, and baseline SUA levels in both male and female. The incidence of MetS exhibited a decreasing trend across the percent change in SUA quartile category in both sexes (both P<0.001). Supplementary Table 1 displays the clinical characteristics and laboratory variables of the study participants based on baseline SUA quartile category. And Supplementary Tables 2 and 3 present the clinical characteristics and laboratory variables of the study participants based on baseline SUA quartile category according to incident MetS.
Correlations of SUA level and percent changes in SUA level with studied parameters
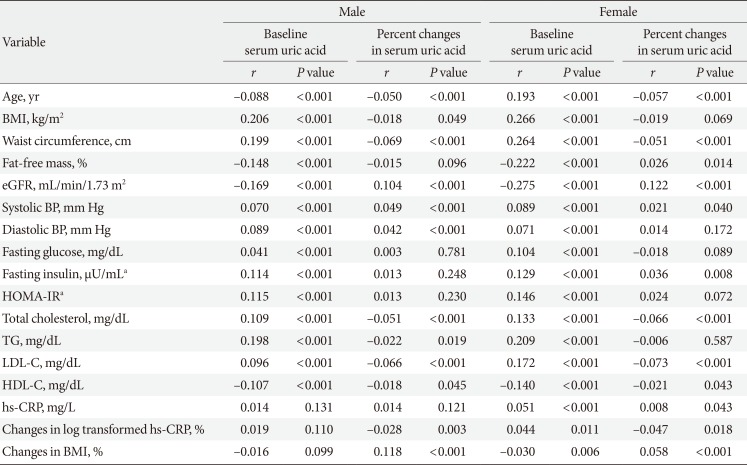
Table 3 displays the correlations of baseline SUA level and percent changes in SUA level with anthropometric and biochemical parameters according to sex. Baseline SUA level correlated positively with BMI, WC, systolic BP, diastolic BP, fasting glucose, fasting insulin, HOMA-IR, total cholesterol, TG, and LDL-C levels. In contrast, baseline SUA level correlated negatively with eGFR, HDL-C, and FFM (%) values in both male and female. The strongest correlation was observed between baseline SUA level and BMI (r=0.206, P<0.001 in male; r=0.266, P<0.001 in female).
Changes in SUA level correlated positively with eGFR, systolic BP, diastolic BP, and change in BMI. In contrast, changes in SUA level correlated negatively with WC, total cholesterol, TG, LDL-C, HDL-C, and percent change in log-transformed hs-CRP values in both male and female. The strongest correlation was observed between changes in SUA level and changes in BMI in male (r=0.118, P<0.001) and between changes in SUA level and eGFR in female (r=0.122, P<0.001). These factors were used as adjustments in the Cox proportional hazards models.
Changes in SUA level during follow-up and the risk of MetS
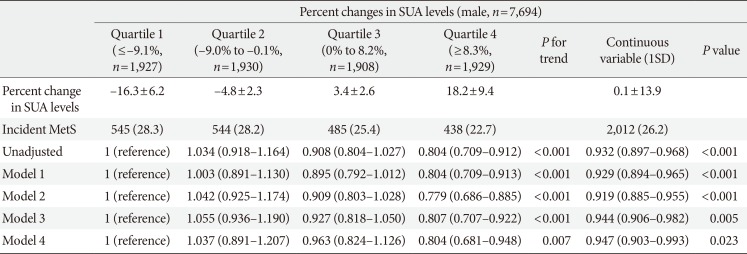
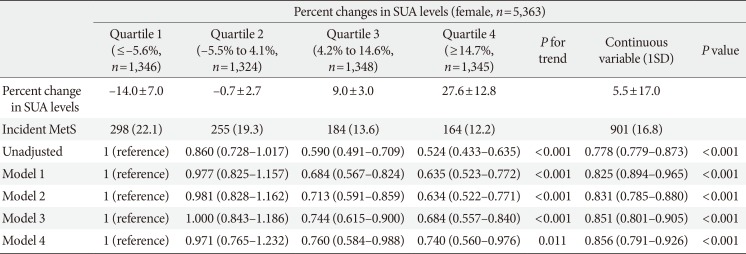
During 62,458 person-years of follow-up between 2006 and 2012, there were 2,955 (2,012 male, 901 female) incident cases of MetS. Tables 4 and 5 display the HRs and 95% CIs for incident MetS according to percent change in SUA level, both in quartile groups and as a continuous variable.
Across quartile categories, although there was not exact linear relationship since the HR was highest in the second quartile in male, the HR for developing MetS decreased with a linear trend. In the unadjusted model, the HRs (95% CIs) for incident MetS in the second, third, and fourth quartiles compared to the first quartile of percent changes in SUA level were 1.034 (95% CI, 0.918 to 1.164), 0.908 (95% CI, 0.804 to 1.027), and 0.804 (95% CI, 0.709 to 0.912) in male (P for trend <0.001) and 0.860 (95% CI, 0.728 to 1.017), 0.590 (95% CI, 0.491 to 0.709), and 0.524 (95% CI, 0.433 to 0.635) in female (P for trend <0.001), respectively. These associations remained significant after further adjustments (Model 1: adjusted for age, systolic BP, BMI, FFM [%], eGFR, and smoking status; Model 2: Model 1 plus fasting glucose, TG, LDL-C, and HDL-C levels; Model 3: Model 2 plus baseline SUA level; Model 4: Model 3 plus fasting insulin level).
As a continuous variable, the percent change in SUA level was also negatively associated with the risk of incident MetS. In the unadjusted model, the HR (95% CI) for incident MetS associated with each 1SD increase in the percent change in SUA level was 0.932 (95% CI, 0.897 to 0.968; P<0.001) in male and 0.778 (95% CI, 0.779 to 0.873; P<0.001) in female. These associations were apparent even after adjustments for multiple confounders in Models 1 and 2. After further adjustment for baseline SUA level (Model 3), the HR (95% CI) for incident MetS associated with each 1SD increase in the percent change in SUA level was 0.944 (95% CI, 0.906 to 0.982; P=0.005) in male and 0.851 (95% CI, 0.801 to 0.905; P<0.001) in female. These associations were still significant after additional adjustment for fasting insulin level (Model 4 [HR, 0.947; 95% CI, 0.903 to 0.993, P=0.023 in male]; [HR, 0.856; 95% CI, 0.791 to 0.926; P<0.001 in female]).
Supplementary Fig. 1 shows cumulative incidence of MetS using the Kaplan-Meier method and the log-rank test according to SUA quartile categories and percent change in SUA quartile categories according to both sexes. Fourth quartiles (Q4) of the percent change in SUA show a higher cumulative incidence of MetS than the other quartiles in both sexes (P<0.001).
In subgroup analysis, Supplementary Tables 4 and 5 displays the HRs and 95% CIs for incident MetS according to percent change in SUA level as a continuous variable, regarding to the quartile categories of the basal SUA level separately. In the fully-adjusted model (Model 3) and additionally adjusted model for fasting insulin level (Model 4), each 1 SD increase in percent change in SUA level was negatively correlated with incident MetS regarding to the quartiles of the basal SUA levels in female. However, they lost statistical significance in male.
DISCUSSION
The novel finding of the present study was that there was a negative association between the percent change in SUA level and the incidence of MetS in mostly healthy participants, even after adjustment for baseline SUA level. Most epidemiological and cohort studies have identified positive relationships between baseline SUA level and prevalence of MetS. However, until this study, no attempt had been made to investigate the relationship between changes in SUA level and development of MetS.
In our study, both across quartile groups and as a continuous variable, the percent change in SUA level was negatively associated with incident MetS (Tables 4 and 5). Therefore, the percent change in SUA level could be an important measure, and increasing SUA level might protect against the development of MetS. The results of the current study support the idea that changes in SUA level could be one of the major anti-oxidative biomarkers predicting the development of MetS.
Uric acid is a water-soluble antioxidant mostly produced by the liver [4] and contributes up to 50% of the antioxidant capacity in the blood [22]. Additionally, it has been proposed that uric acid directly inhibits free radical-induced damage, thus protecting the cell membrane and DNA [2324]. Furthermore, the increment of SUA level has been tested as a treatment in the clinical field of neurology. Some studies have demonstrated that systemic administration of uric acid increases the serum antioxidant capacity in healthy subjects [1213]. In patients with acute stroke, the use of uric acid reduced several biomarkers of oxidative stress and was neuroprotective in combination with thrombolytic therapy [1415]. More recently, uric acid therapy was reported to improve the clinical outcomes of acute stroke in female [16].
SUA has long been debated as either a prooxidant risk factor or an antioxidant protective factor. It has also been unclear whether increased SUA level in diseases associated with oxidative stress (such as CVDs) is a protective response or a primary cause [2526]. SUA might be a prooxidant marker of oxidative stress [27], but it also could have a therapeutic role as an antioxidant [2829]. Considering all of the above, the prolonged conflict could be resolved if it is hypothesized that the gradual elevation of SUA level is a protective factor, whereas chronic elevation is a risk factor for disease [30].
Although the mechanism was not completely delineated in the current study, the chronic inflammation and oxidative stress involved in the initiation of MetS could explain the association between changes in SUA level and risk of developing MetS. To understand the mechanism whereby increasing SUA level protects against MetS, we investigated the correlation between changes in SUA level and changes in log-transformed hs-CRP (%). Changes in log-transformed hs-CRP (%) correlated inversely with changes in SUA level in both sexes, indicating that the protective/anti-inflammatory effects of SUA mainly contribute to its effects on incident MetS (Table 3). However, it remains unclear whether the increment in SUA level is an adaptive response to increasing oxidative stress, or whether failure to increase SUA level is a risk factor of MetS. Further studies are needed to resolve this question.
The relationship between changes in SUA level and development of MetS has been remained area of uncertainty; therefore, the findings of the current study are relevant for better defining the potentially protective role of SUA. Nevertheless, several limitations of this study should be mentioned. First, since participants were self-selected and this study was conducted with a single-center-based sample, we were unable to ascertain whether participants were representative of the general Korean population; thus, selection bias could limit the generalizability of the results. Second, we could not investigate the pattern of changes in SUA level in each participant since we used Multivariate Cox proportional hazards analysis. Third, participants who were taking medications known to influence SUA level (i.e., diuretics or allopurinol) could not be excluded. Forth, the reason and mechanism were still unclear what made the different results by sexes in subgroup analysis (Supplementary Tables 4 and 5). Finally, we did not include dietary habits or alcohol intake. Despite these limitations, we studied a large sample population with a relatively long follow-up period. Further, the measurements of factors associated with SUA level were standardized.
In conclusion, although higher baseline SUA level has been linked to an increased risk of incident MetS, increasing SUA level might protect against the risk of MetS, regardless of baseline SUA level, suggesting a possible role of SUA as an antioxidant in the pathogenesis of incident MetS.
 XML Download