

 PDF
PDF ePub
ePub Citation
 Print
Print


INTRODUCTION
METHODS
Study population
Ascertainment of T2DM
Establishment of the nested case-control study
Laboratory measurements
Statistical analysis
RESULTS
Table 1
Baseline characteristics and fetuin-A levels of diabetes cases and matched controls, the Singapore Chinese Health Studya
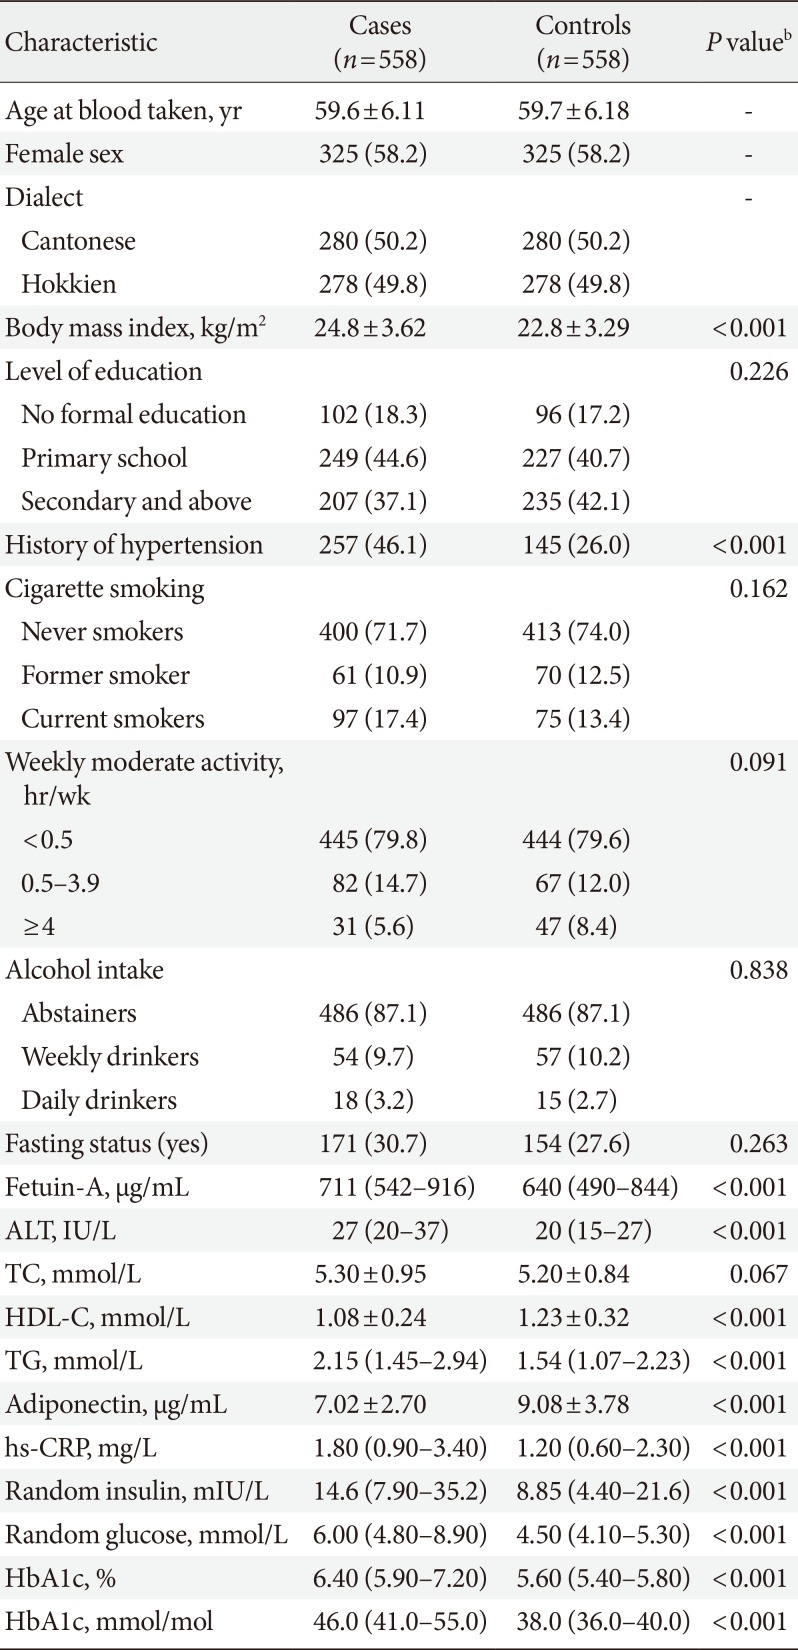
Values are presented as mean±standard deviation, number (%), or median (interquartile range).
ALT, alanine aminotransferase; TC, total cholesterol; HDL-C, high density lipoprotein cholesterol; TG, triglyceride; hs-CRP, high sensitivity C-reactive protein; HbA1c, glycosylated hemoglobin.
aCases and controls are matched on age at blood taken (±3 years), gender, dialect, and date of blood collection (±6 months), bP values based on the chi-square test for categorical variables, Student's t-test and Mann-Whitney test for continuous variable.
![]()
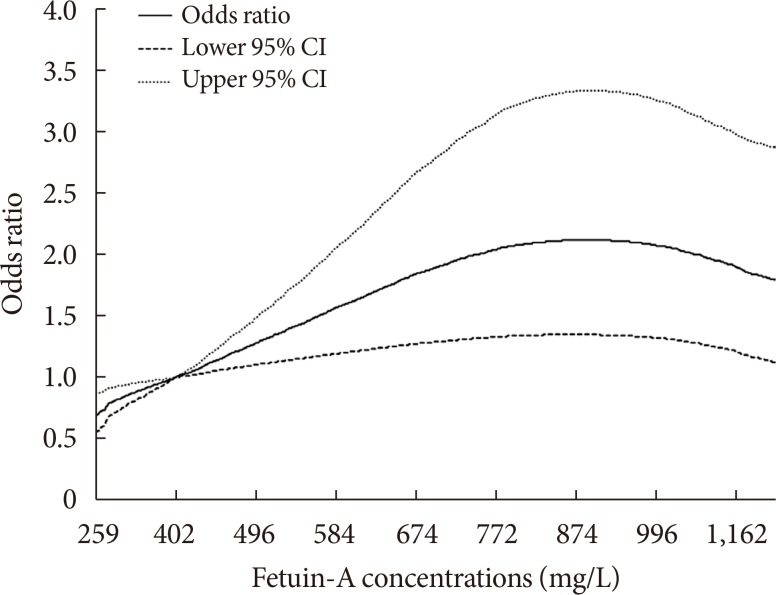
Fig. 1
Spline analysis of the association between fetuin-A concentrations and incident type 2 diabetes mellitus risk. The solid line represents point estimates of relative risk for the association between fetuin-A levels and risk of incident type 2 diabetes mellitus, and the dotted lines represent the upper and lower bound of 95% confidence interval (CI). Study participants with the highest 5% of fetuin-A were excluded to minimize the potential impact of outliers. Cubic spline analysis was used to examine the association between fetuin-A concentrations and risk of developing type 2 diabetes mellitus using the model 1 from Table 2 (P nonlinearity=0.005).
![]()
Table 2
ORs (95% CIs) of type 2 diabetes mellitus associated with sex-specific quintiles of fetuin-A, the Singapore Chinese Health Study
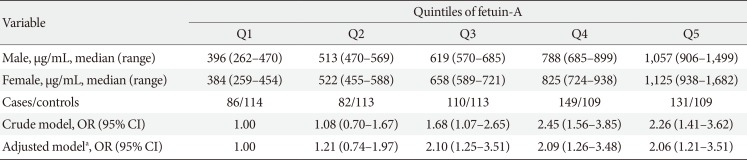
OR, odds ratio; CI, confidence interval.
aAdjusted model: adjusted for age at blood taken (continuous), smoking status (never, ever smoker), alcohol intake (never, weekly or daily), weekly moderate-to-vigorous physical activity levels (<0.5, 0.5 to 3.9, and ≥4 hours/week), education levels (no, primary school, secondary or above), history of hypertension (yes, no), fasting status (yes, no), and body mass index (continuous).
![]()
Table 3
ORs (95% CIs) of type 2 diabetes mellitus associated with different levels of fetuin-A, the Singapore Chinese Health Study
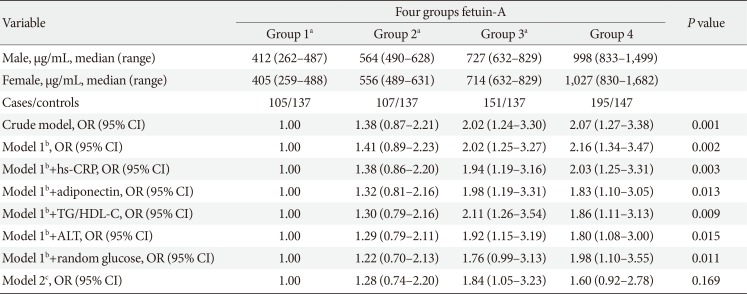
OR, odds ratio; CI, confidence interval; hs-CRP, high sensitivity C-reactive protein; TG, triglyceride; HDL-C, high density lipoprotein cholesterol; ALT, alanine aminotransferase.
aGroup 1–3 were categorized into tertiles among controls with fetuin-A levels less than 830 mg/L, bModel 1: adjusted for age at blood taken (continuous), smoking status (never, ever smoker), alcohol intake (never, weekly or daily), moderate-to-vigorous weekly activity levels (<0.5, 0.5 to 3.9, and ≥ 4 hours/week), education levels (no, primary school, secondary or above), history of hypertension (yes, no), fasting status (yes, no), and body mass index (continuous), cModel 2: Model 1 plus hs-CRP (mg/L), adiponectin (µg/mL), TG-to-HDL-C ratio, ALT (IU/L) and random glucose (mmol/L; all in quartiles).
![]()
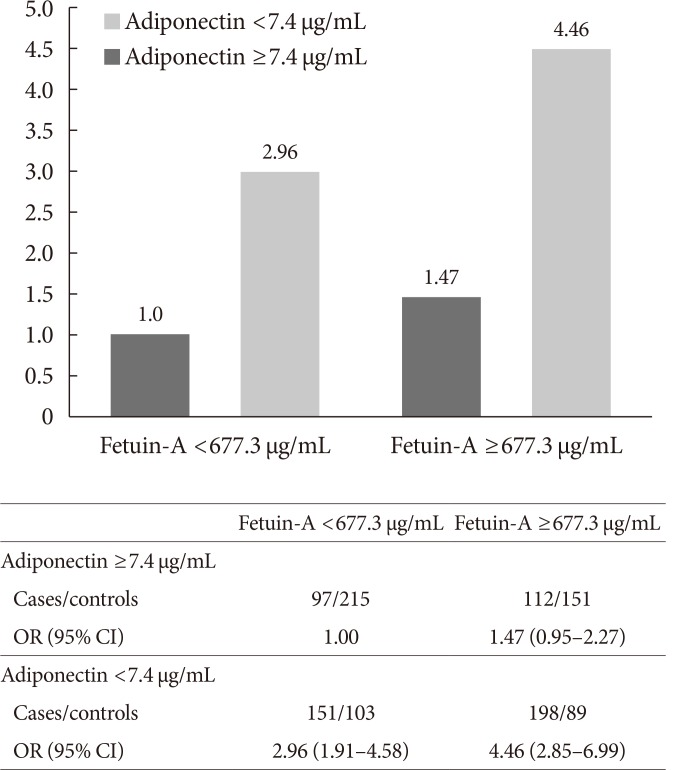
Fig. 2
Total type 2 diabetes mellitus risk according to joint distribution of fetuin-A and adiponectin. Multivariable model adjusted for age at blood taken (continuous), smoking status (never, ever smoker), alcohol intake (never, weekly or daily), weekly moderate-to-vigorous physical activity levels (<0.5, 0.5 to 3.9, and ≥4 hours/week), education levels (no, primary school, secondary or above), history of hypertension (yes, no), fasting status (yes, no), and body mass index (continuous). OR, odds ratio; CI, confidence interval.
![]()
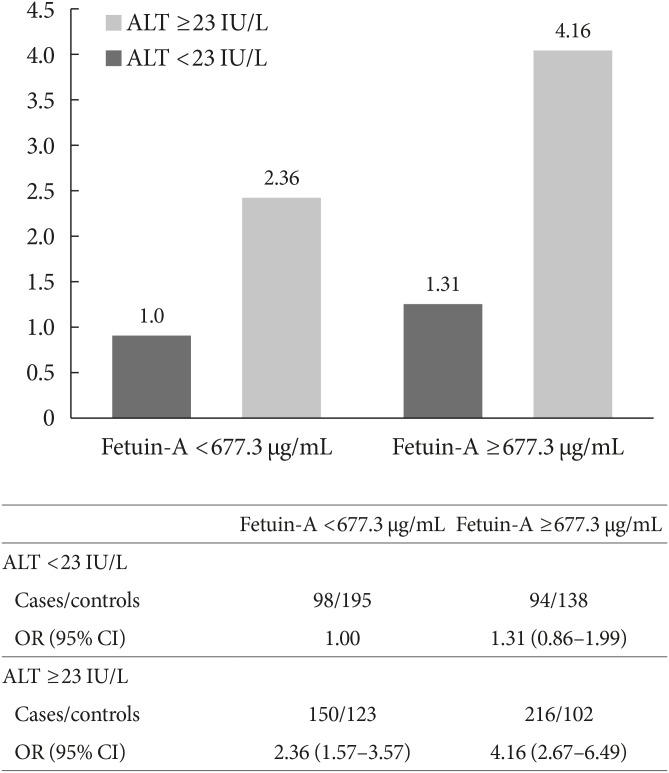
Fig. 3
Total type 2 diabetes mellitus risk according to joint distribution of fetuin-A and alanine transaminase (ALT). Multivariable model adjusted for age at blood taken (continuous), smoking status (never, ever smoker), alcohol intake (never, weekly or daily), weekly moderate-to-vigorous physical activity levels (<0.5, 0.5 to 3.9, and ≥4 hours/week), education levels (no, primary school, secondary or above), history of hypertension (yes, no), fasting status (yes, no), and body mass index (continuous). OR, odds ratio; CI, confidence interval.
![]()
 XML Download