Journal List > Diabetes Metab J > v.43(4) > 1142379

Lee, Choi, Jun, Lee, Jin, Hur, Ko, and Lee: Additional Effect of Dietary Fiber in Patients with Type 2 Diabetes Mellitus Using Metformin and Sulfonylurea: An Open-Label, Pilot Trial

Abstract

Background

Metformin, sulfonylurea, and dietary fiber are known to affect gut microbiota in patients with type 2 diabetes mellitus (T2DM). This open and single-arm pilot trial investigated the effects of the additional use of fiber on glycemic parameters, insulin, incretins, and microbiota in patients with T2DM who had been treated with metformin and sulfonylurea.

Methods

Participants took fiber for 4 weeks and stopped for the next 4 weeks. Glycemic parameters, insulin, incretins during mixed-meal tolerance test (MMTT), lipopolysaccharide (LPS) level, and fecal microbiota were analyzed at weeks 0, 4, and 8. The first tertile of difference in glucose area under the curve during MMTT between weeks 0 and 4 was defined as ‘responders’ and the third as ‘nonresponders,’ respectively.

Results

In all 10 participants, the peak incretin levels during MMTT were higher and LPS were lower at week 4 as compared with at baseline. While the insulin sensitivity of the ‘responders’ increased at week 4, that of the ‘nonresponders’ showed opposite results. However, the results were not statistically significant. In all participants, metabolically unfavorable microbiota decreased at week 4 and were restored at week 8. At baseline, metabolically hostile bacteria were more abundant in the ‘nonresponders.’ In ‘responders,’ Roseburia intestinalis increased at week 4.

Conclusion

While dietary fiber did not induce additional changes in glycemic parameters, it showed a trend of improvement in insulin sensitivity in ‘responders.’ Even if patients are already receiving diabetes treatment, the additional administration of fiber can lead to additional benefits in the treatment of diabetes.

INTRODUCTION

Despite various up-to-date classes of antidiabetic agents, the incidence of type 2 diabetes mellitus (T2DM) and its complications continue to increase. Because multiple factors such as genetics, dietary habits, and physical activity influence glycemic control and complications of T2DM, strategies for improving diabetic care should include not only pharmaceutical interventions but also the management of such conditions [1]. Notably, there are many reports suggesting that the consumption of a fiber-rich diet or the use of a dietary fiber supplement such as psyllium may be beneficial in controlling glucose level [234567]. Furthermore, the American Diabetes Association Position Statement advised taking 14 g of dietary fiber per 1,000 kcal to prevent cardiovascular disease [8].
Gut microbiota can regulate host energy metabolism using several pathways, such as short-chain fatty acids (SCFAs) production, gut barrier permeability, fasting-induced adipose factor expression, and the endocannabinoid system. Dietary fibers are fermented into SCFAs by host gut microbiota and SCFA receptors are expressed in both metabolic and immune tissues [9]. Previous investigations have reported the relationship of microbiota, SCFAs, and diseases related to chronic low-grade inflammation (e.g., obesity, metabolic syndrome, and T2DM) [10111213].
The compositions and abundance of microbiota are affected by commonly used antidiabetic agents such as metformin and sulfonylureas [1214151617181920]. In the case of metformin, a large number of reports indicate that it promotes SCFA-producing bacteria in a diet-dependent manner. To the best of our knowledge, there has been only one study published presenting sulfonylurea's beneficial effect on gut metabolism in patients with T2DM, based on their urine levels of hippurate, phenylalanine, and tryptophan [19]. These changes induced by medications could minimize the influences of other important factors such as diet and genetic factors [1112] on T2DM management. However, previous studies completed were predominantly limited to considering the use of single antidiabetic drug, and no studies have been performed in the setting of a combination regimen. Importantly, combination therapy is a major component of T2DM management, especially the combination of metformin and sulfonylurea in Korea [21].
Based on existing data on the effects of dietary fiber, metformin, and sulfonylurea on T2DM metabolism and gut microbiota, we hypothesized that dietary fiber may additionally modify gut microbiota and consequently change glycemic control and systemic inflammation in patients with T2DM who were already using metformin and sulfonylurea.

METHODS

Ethics

The present study's protocol was approved by the Institutional Review Board of Samsung Medical Center (SMC) in Seoul, Republic of Korea and was performed according to the Declaration of Helsinki. All participants were provided with written informed consent forms and signed them voluntarily (IRB File No. SMC 2012-08-074-002).

Study design

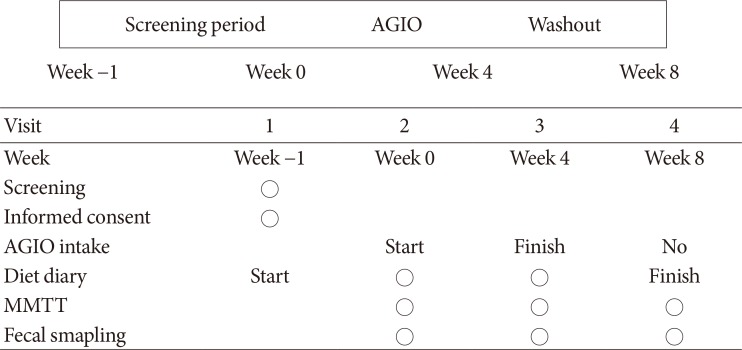
This study was a single center, open-label, single-arm pilot trial without sample size calculation. Glycemic indexes and fecal microbiota were analyzed before and after the administration of a commercially available dietary fiber supplement, AGIO (a mixture of 3.9 g of plantago seed and 0.13 g of ispaghula husk in one package; Bukwang Pharmaceutical Co. Ltd., Seoul, Korea) for 4 weeks. All participants were given three packages of the fiber supplement per day. After 4 weeks of fiber supplement intake, participants stopped consumption for the next 4 weeks to evaluate restoration. They were asked to write in diet diaries three times a week to estimate dietary fiber intake from everyday meals. Mixed-meal tolerance test (MMTT; consisting of 62% carbohydrate, 20% fat, and 18% protein) and fecal sampling were performed at each visit to compare the effects of fiber supplement consumption on incretin levels and microbiota, respectively (Fig. 1).

Study outcomes

The primary outcome of this study was the effect of fiber supplement use on insulin secretion and insulin sensitivity. Secondary outcomes were the changes of incretin levels (i.e., gastric inhibitory polypeptide [GIP], glucagon-like peptide-1 and -2 [GLP-1 and GLP-2], peptide YY [PYY]), systemic inflammatory status as represented by lipopolysaccharide (LPS) level, and microbiota composition.

Study population

This study enrolled patients with T2DM who visited the Diabetes Center at SMC, Seoul, Republic of Korea in 2014. Eligible participants were required to be older than 50 years of age and meet the following three conditions: (1) have a presence of at least two components of the National Cholesterol Education Program Third Adult Treatment Panel (NCEP-ATP III) criteria for metabolic syndrome; (2) have a glycosylated hemoglobin (HbA1c) value of 7.0% to 9.0%; and (3) be taking combination therapy of metformin and sulfonylurea for at least the previous 6 months.
Conversely, patients who met at least one of following criteria were excluded: (1) using insulin, alpha-glucosidase inhibitors, meglitinides, thiazolidinediones, or incretin agents such as dipeptidyl peptidase-4 inhibitors or GLP-1 receptor agonists; (2) experienced acute complications of T2DM in last 6 months; (3) having significant cardiovascular disease; (4) having a treatment history of oral or intravenous antibiotic agent usage within the last 12 months; (5) having taken supplementary fiber agents within the last 6 months; and (6) having a fasting C-peptide level of <1.0 ng/mL.
For subgroup analysis, two groups were defined by the differences in area under the curve (AUC) of glucose during MMTT between the first and second visits. The first and last tertiles of the change ratio of AUC were defined as ‘responders’ and ‘nonresponders,’ respectively.

Clinical and biochemical measurements

We collected past medical history, family history, and current smoking and alcohol consumption status via medical record review and individualized questionnaires. During the participants' three visits (at weeks 0, 4, and 8), venous blood sampling was done after at least 8 hours of overnight fasting and analyzed at a certified central laboratory at SMC. Fasting plasma glucose (FPG) level was determined by the hexokinase method using the GLU kit (Roche Diagnostics, Basel, Switzerland) on a Roche Modular DP analyzer (Roche Diagnostics). Fasting plasma insulin values were derived from an immunoradiometric assay (DIAsource Co., Louvain-la-Neuve, Belgium). LPS was checked before each MMTT. During MMTT, venous blood was drawn at 0, 30, 60 , 90, and 120 minutes for glucose, C-peptide, insulin, and incretins. Serum was isolated and stored at −80℃, then sent to an outside laboratory (BIOINFRA Inc., Seoul, Korea). Glucagon, total GIP, active GLP-1, and total PYY were measured using a Millipore Human Metabolic Hormone Magnetic Bead Panel (Merck Millipore, Darmstadt, Germany) on a Luminex 200 system (Luminex Corp., Austin, TX, USA). GLP-2 and LPS were detected by use of a Millipore enzyme-linked immunosorbent assay (ELISA) kit (Merck Millipore) and a Cloud-Cone Corporation ELISA kit (Cloud-Clone Corp., Houston, TX, USA), respectively, using the Emax analyzer (Promega Corp., Madison, WI, USA).
Insulin secretion was evaluated with the insulinogenic index (IGI) derived from the MMTT data, while insulin sensitivity was determined by the quantitative insulin sensitivity check index (QUICKI) and Matsuda index (MI). Disposition index values were also evaluated [222324].

Microbiota analysis

Microbiota analysis was conducted to reveal the changes of abundance and composition according to each visit and to compare that of ‘responders’ and ‘nonresponders.’ Fecal samples were collected at each visit and stored at −80℃. DNA extraction and 16S ribosomal RNA gene-based pyrosequencing by the methods described previously [25] were conducted at ChunLab Inc. (Seoul, Korea). Chimeric sequences were detected using UCHIME [26] and the EzTaxon-e database [27], and the latter was used to assign each read taxonomically. The linear discriminant analysis of the effect size (LEfSe) algorithm [28] was used to estimate taxonomic composition and to identify differences between paired comparisons.

Statistical analyses

Continuous variables were presented as medians and interquartile ranges. The Mann-Whitney U test, Wilcoxon signed-rank test, and chi-square test were used to compare laboratory and clinical variables. Values of P<0.05 were considered to be statistically significant. Multiple comparisons were corrected with Bonferroni's method. Statistical analyses were performed using the SPSS version 24.0 for Windows software (IBM Corp., Armonk, NY, USA). Based on the relative abundance analysis using LEfSe from the results of the Kruskal-Wallis and Wilcoxon tests, P<0.05 was considered to indicate statistical significance, and the threshold on the logarithmic linear discriminant analysis (LDA) score was deemed to be 2.0.

RESULTS

Overall analysis

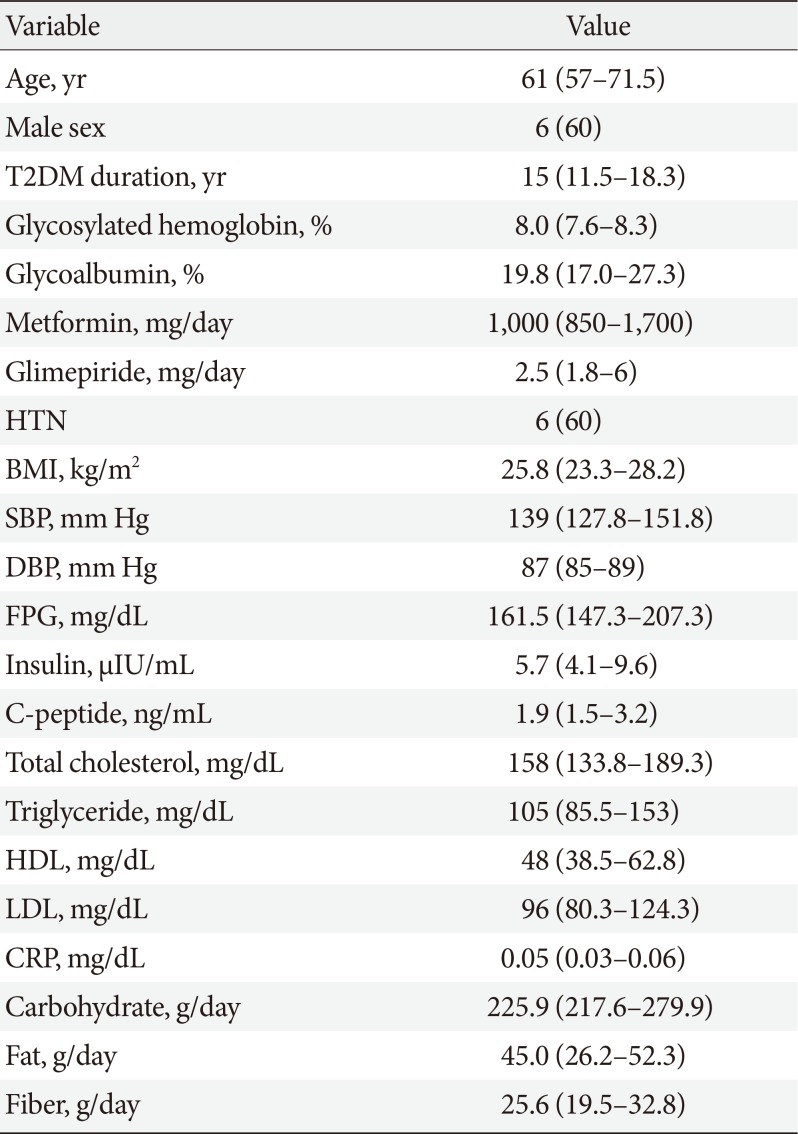
Fourteen patients with T2DM volunteered for the study. Two participants withdrew consent, one was excluded due to low C-peptide level, and one did not pass the quality check of fecal samples. Therefore, the data of 10 participants were finally analyzed. Baseline characteristics of the study participants are presented in Table 1.
Overall, IGI decreased at week 4, and the change was maintained at week 8 (0.2, 0.1, and 0.1 in serial; P>0.05). Meanwhile, QUICKI decreased at week 4 and was restored at week 8 (0.34, 0.31, and 0.34 in serial; P>0.05), while MI changed in the same direction (4.1, 2.6, and 3.4 in serial; P>0.05) (Table 2). For the above-listed outcomes, there were no statistically significant differences between the visits.
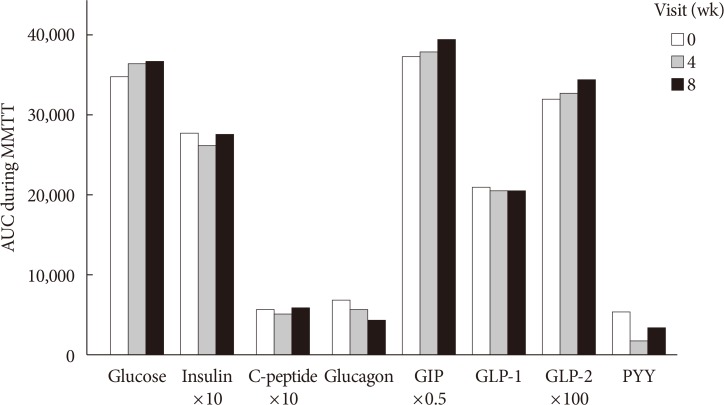
Glucose, insulin, C-peptide, glucagon, GIP, GLP-1, GLP-2, and PYY during MMTT were plotted for AUC calculation. The AUCs of insulin, C-peptide, and PYY decreased at week 4 and increased at week 8. Total AUCs of GIP and GLP-2 tended to increase, while those of glucagon and GLP-1 decreased throughout the study period (Fig. 2). The peak value of GIP, GLP-1, and GLP-2 during MMTT were higher at week 4 than at baseline (data not shown). However, the above changes did not explain the statistical significance. LPS decreased after 4 weeks of dietary fiber intake and then increased after 4 weeks of interruption, without statistical significance (Table 2).
The abundance of family Coriobacteriaceae decreased at week 4 and increased at week 8. The genera Blautia and Eubacterium, Blautia wexlerae, Bifidobacterium longum, and Enterobacter soli decreased after 4 weeks of dietary fiber supplement intake. These microbiota composition changes were statistically significant.

Subgroup analysis: ‘responders’ and ‘nonresponders’

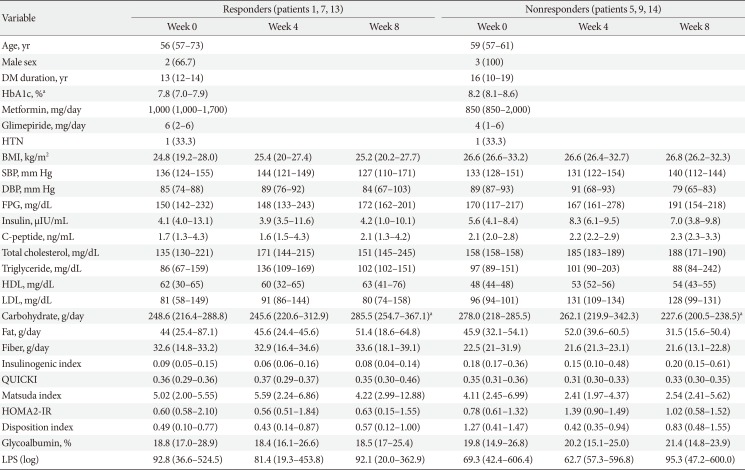
Three participants were assigned to each group of ‘responders’ and ‘nonresponders.’ ‘Responders’ showed a decrease by 3.57% and ‘nonresponders’ showed an increase of 13.48% of change ratio of glucose AUC. Table 3 demonstrates the baseline and changes in laboratory data for each group at each visit. At baseline, the ‘nonresponders’ group included patients with older ages; longer durations of T2DM; and higher levels of HbA1c, body mass index, FPG, total cholesterol, triglycerides, and low density lipoprotein as compared with those in the ‘responders’ group. However, only HbA1c was statistically significantly different between the groups (7.8% in ‘responders’ and 8.2% in ‘nonresponders,’ P<0.05).
In both groups, IGI decreased at week 4 and re-increased at week 8. In ‘responders,’ QUICKI and MI increased at week 4 and then decreased after the discontinuation of AGIO. In ‘nonresponders,’ the indexes changed in the opposite direction. After 4 weeks of fiber intake, the median value of glycoalbumin decreased in the ‘responders’ and increased in the ‘nonresponders.’ LPS levels in both groups dropped at week 4 and increased at week 8. However, none of the behaviors of the variables listed above showed statistical significance.
There was a significant difference in the composition of gut microbiota between ‘responders’ and ‘nonresponders’ from the beginning of the study. The phylum Cyanobacteria, order Propionibacteriales, family Propionibacteriaeae, and genus Butyricicoccus were more abundant in ‘responders,’ while ‘nonresponders’ had more composition of the genera Blautia, Anaerostipes, Dorea, Lachnospiracea, Coprococcus, and Clostridium. In ‘responders,’ the family Propionibacteriaceae decreased and Clostridiaceae increased after 4 weeks of fiber intake. The species Blautia luti, Roseburia intestinalis, and Clostridium disporicum also increased at week 4. In ‘nonresponders,’ the abundance of the family Coprobacillus decreased at week 4 and re-increased at week 8. The changes in microbiota composition were proven to be statistically significant.

DISCUSSION

In the present study, we evaluated how insulin secretion and sensitivity, incretins, an inflammatory marker, and microbiota presented before consumption, after 4 weeks of consumption, and 4 weeks after stopping consumption of the dietary fiber supplement AGIO in patients with T2DM who were already treated with metformin and sulfonylurea. When analyzing all 10 participants, IGI, QUICI, MI, and LPS showed a tendency to decrease initially and then to increase during the study period. Additionally, after 4 weeks of taking the dietary fiber supplement, QUICKI and MI increased in ‘responders’ and decreased in ‘nonresponders.’ These changes were statistically insignificant.
Fiber that reaches the human colon are fermented by bacteria and transformed to SCFAs. Acetate, propionate, and butyrate are major SCFAs in the colonic environment. It has been elucidated that SCFAs have essential roles not only as the local energy source but also as the regulators of host metabolism and inflammation [2930]. SCFAs stimulate the secretion of GIP, GLP-1, and PYY and inhibit insulin signaling in adipocytes, leading to reduced fat accumulation through G-protein-coupled receptors such as free fatty acid receptor 2 (FFAR2) and FFAR3 [2931]. In the current study, higher peak values of GIP and GLP-1 during MMTT were observed at week 4, yet the differences in these were not statistically significant and did not result in metabolic improvement. SCFAs have an anti-inflammatory effect by regulating the differentiation and activation of leukocytes, the inhibition of macrophage migration, and reduction in the neutrophil release of tumor necrosis factor alpha [3233]. As T2DM and insulin resistance are known to be related to chronic low-grade systemic inflammation [34], SCFAs improve insulin resistance, tissue glucose uptake, and serum glucose level [29]. Although SCFAs levels were not directly measured in the present study, LPS values reflecting systemic inflammation tended to decrease after fiber administration.
At the initiation of this study, metabolic features were generally poorer in the ‘nonresponders’ as compared with in the ‘responders.’ These two groups had different microbiota compositions from the baseline. The genera Blautia, Lachnospiraceae, and Clostridium, which are known to be metabolically unfavorable and enriched in T2DM samples [35], were observed more frequently in ‘nonresponders.’ In other words, the preexisting difference of microbiota composition between the groups might have already influenced the baseline metabolic phenotype, and such would have subsequently affected the later outcomes. A higher dose of metformin and glimepiride use might have an impact on such a difference.
Previous studies have reported that R. intestinalis improved insulin sensitivity [3637]. We postulated that the higher abundance of R. intestinalis in ‘responders’ might be associated with the numerical improvement in insulin sensitivity seen at week 4. Furthermore, the metabolically unfavorable family Coprobacillus decreased at week 4 in the ‘nonresponders.’ Regardless of the group to which participants belonged to, these results were in accordance with those of previous studies demonstrating that high fiber intake could reverse the ratio of microbiota into the metabolically favorable direction [3738].
While dietary fiber supplement consumption led to a change in the composition of gut microbiota, it did not result in statistically significant differences in glycemic indexes or other metabolic features, unlike in previous studies [2439]. We hypothesized that the number of participants in the current study was too small to conclude statistical significance or that the study duration was not long enough to translate changes of microbiota into specific metabolic phenotypic results. Recently, the influence of metformin and sulfonylurea on microbiota composition and the consequent metabolic benefits have been emphasized [12161819]. We assumed that the change in microbiota composition by fiber supplement was not strong enough to change the metabolic phenotype significantly, which might have been already fixed by medication usage.
Since the most widely used oral antidiabetic regimen in Korea was dual combination therapy [21], this study was designed to be more similar to the real-world setting, while other studies involving dietary fiber consisted of patients without T2DM or who were taking a single oral hypoglycemic agent. Still, there were limitations in this study. First, as it was a pilot trial, only a small number of participants was enrolled and such could be a cause of statistical insignificance. Second, since a placebo was unavailable, the interpretation of results was complicated by the lack of a control group. Third, there was no dietary control besides psyllium supplement. Future randomized controlled trials consisting of a larger number of patients, a control group, and a more extended study period will be essential to optimally assess the utility of the additional use of dietary fibers in patients with T2DM who are on combination therapy. Besides, a research directly measuring SCFAs (e.g., acetate, butyrate) would be helpful to correlate changes in microbiota composition with metabolic phenotypes.
In conclusion, while the dietary fiber supplement AGIO did not induce statistically significant changes in insulin secretion and sensitivity and metabolic markers, it altered the gut microbiota composition in a metabolically favorable direction with statistical significance. Though the number of cases included is small, the finding in this pilot study suggests that dietary fiber supplementation could induce a change in gut microbiota and such might have a link with insulin sensitivity in particular patients with T2DM.

ACKNOWLEDGMENTS

The authors also thank the Samsung Medical Center Nutrition Team for quantifying each participant's diary for nutritional composition for everyday diet.

Notes

CONFLICTS OF INTEREST: This study was supported by Bukwang Pharmaceutical Co. Ltd. (project no. PHO1131031), Seoul, Republic of Korea. The authors have no other potential conflicts of interest to disclose.

AUTHOR CONTRIBUTIONS:

  • Conception or design: S.M.J., K.Y.H., M.K.L.

  • Acquisition, analysis, or interpretation of data: S.E.L., Y.C., J.E.J., Y.B.L., S.M.J., K.Y.H., G.P.K., M.K.L.

  • Drafting the work or revising: S.E.L., J.E.J., Y.B.L., M.K.L.

  • Final approval of the manuscript: S.E.L., Y.C., J.E.J., Y.B.L., S.M.J., K.Y.H., G.P.K., M.K.L.

References

1. American Diabetes Association. Standards of medical care in diabetes: 2018. Diabetes Care. 2018; 41(Suppl 1):S1–S153. PMID: 29222369.
2. Abutair AS, Naser IA, Hamed AT. Soluble fibers from psyllium improve glycemic response and body weight among diabetes type 2 patients (randomized control trial). Nutr J. 2016; 15:86. PMID: 27733151.
crossref
3. Bajorek SA, Morello CM. Effects of dietary fiber and low glycemic index diet on glucose control in subjects with type 2 diabetes mellitus. Ann Pharmacother. 2010; 44:1786–1792. PMID: 20959501.
crossref
4. Gibb RD, McRorie JW Jr, Russell DA, Hasselblad V, D'Alessio DA. Psyllium fiber improves glycemic control proportional to loss of glycemic control: a meta-analysis of data in euglycemic subjects, patients at risk of type 2 diabetes mellitus, and patients being treated for type 2 diabetes mellitus. Am J Clin Nutr. 2015; 102:1604–1614. PMID: 26561625.
crossref
5. Hall M, Flinkman T. Do fiber and psyllium fiber improve diabetic metabolism? Consult Pharm. 2012; 27:513–516. PMID: 22910133.
crossref
6. Pastors JG, Blaisdell PW, Balm TK, Asplin CM, Pohl SL. Psyllium fiber reduces rise in postprandial glucose and insulin concentrations in patients with non-insulin-dependent diabetes. Am J Clin Nutr. 1991; 53:1431–1435. PMID: 1852093.
crossref
7. Weickert MO, Mohlig M, Koebnick C, Holst JJ, Namsolleck P, Ristow M, Osterhoff M, Rochlitz H, Rudovich N, Spranger J, Pfeiffer AF. Impact of cereal fibre on glucose-regulating factors. Diabetologia. 2005; 48:2343–2353. PMID: 16172868.
crossref
8. Slavin JL. Position of the American Dietetic Association: health implications of dietary fiber. J Am Diet Assoc. 2008; 108:1716–1731. PMID: 18953766.
9. Pluznick J. A novel SCFA receptor, the microbiota, and blood pressure regulation. Gut Microbes. 2014; 5:202–207. PMID: 24429443.
crossref
10. Esteve E, Ricart W, Fernandez-Real JM. Gut microbiota interactions with obesity, insulin resistance and type 2 diabetes: did gut microbiote co-evolve with insulin resistance? Curr Opin Clin Nutr Metab Care. 2011; 14:483–490. PMID: 21681087.
11. Han JL, Lin HL. Intestinal microbiota and type 2 diabetes: from mechanism insights to therapeutic perspective. World J Gastroenterol. 2014; 20:17737–17745. PMID: 25548472.
crossref
12. Hur KY, Lee MS. Gut microbiota and metabolic disorders. Diabetes Metab J. 2015; 39:198–203. PMID: 26124989.
crossref
13. Kasubuchi M, Hasegawa S, Hiramatsu T, Ichimura A, Kimura I. Dietary gut microbial metabolites, short-chain fatty acids, and host metabolic regulation. Nutrients. 2015; 7:2839–2849. PMID: 25875123.
crossref
14. Forslund K, Hildebrand F, Nielsen T, Falony G, Le Chatelier E, Sunagawa S, Prifti E, Vieira-Silva S, Gudmundsdottir V, Pedersen HK, Arumugam M, Kristiansen K, Voigt AY, Vestergaard H, Hercog R, Costea PI, Kultima JR, Li J, Jorgensen T, Levenez F, Dore J; MetaHIT consortium, Nielsen HB, Brunak S, Raes J, Hansen T, Wang J, Ehrlich SD, Bork P, Pedersen O. Disentangling type 2 diabetes and metformin treatment signatures in the human gut microbiota. Nature. 2015; 528:262–266. PMID: 26633628.
crossref
15. Lee H, Ko G. Effect of metformin on metabolic improvement and gut microbiota. Appl Environ Microbiol. 2014; 80:5935–5943. PMID: 25038099.
crossref
16. Mardinoglu A, Boren J, Smith U. Confounding effects of metformin on the human gut microbiome in type 2 diabetes. Cell Metab. 2016; 23:10–12. PMID: 26771114.
crossref
17. Napolitano A, Miller S, Nicholls AW, Baker D, Van Horn S, Thomas E, Rajpal D, Spivak A, Brown JR, Nunez DJ. Novel gut-based pharmacology of metformin in patients with type 2 diabetes mellitus. PLoS One. 2014; 9:e100778. PMID: 24988476.
crossref
18. Wu H, Esteve E, Tremaroli V, Khan MT, Caesar R, Manneras-Holm L, Stahlman M, Olsson LM, Serino M, Planas-Felix M, Xifra G, Mercader JM, Torrents D, Burcelin R, Ricart W, Perkins R, Fernandez-Real JM, Backhed F. Metformin alters the gut microbiome of individuals with treatment-naive type 2 diabetes, contributing to the therapeutic effects of the drug. Nat Med. 2017; 23:850–858. PMID: 28530702.
crossref
19. Huo T, Xiong Z, Lu X, Cai S. Metabonomic study of biochemical changes in urinary of type 2 diabetes mellitus patients after the treatment of sulfonylurea antidiabetic drugs based on ultra-performance liquid chromatography/mass spectrometry. Biomed Chromatogr. 2015; 29:115–122. PMID: 24890121.
crossref
20. Montandon SA, Jornayvaz FR. Effects of antidiabetic drugs on gut microbiota composition. Genes (Basel). 2017; 8.
crossref
21. Korean Diabetes Association. Diabetes Fact Sheet in Korea 2018. Seoul: Korean Diabetes Association;2018.
22. Matsuda M, DeFronzo RA. Insulin sensitivity indices obtained from oral glucose tolerance testing: comparison with the euglycemic insulin clamp. Diabetes Care. 1999; 22:1462–1470. PMID: 10480510.
crossref
23. Levy JC, Matthews DR, Hermans MP. Correct homeostasis model assessment (HOMA) evaluation uses the computer program. Diabetes Care. 1998; 21:2191–2192. PMID: 9839117.
crossref
24. Katz A, Nambi SS, Mather K, Baron AD, Follmann DA, Sullivan G, Quon MJ. Quantitative insulin sensitivity check index: a simple, accurate method for assessing insulin sensitivity in humans. J Clin Endocrinol Metab. 2000; 85:2402–2410. PMID: 10902785.
crossref
25. Hur M, Kim Y, Song HR, Kim JM, Choi YI, Yi H. Effect of genetically modified poplars on soil microbial communities during the phytoremediation of waste mine tailings. Appl Environ Microbiol. 2011; 77:7611–7619. PMID: 21890678.
crossref
26. Edgar RC, Haas BJ, Clemente JC, Quince C, Knight R. UCHIME improves sensitivity and speed of chimera detection. Bioinformatics. 2011; 27:2194–2200. PMID: 21700674.
crossref
27. Kim OS, Cho YJ, Lee K, Yoon SH, Kim M, Na H, Park SC, Jeon YS, Lee JH, Yi H, Won S, Chun J. Introducing EzTaxon-e: a prokaryotic 16S rRNA gene sequence database with phylotypes that represent uncultured species. Int J Syst Evol Microbiol. 2012; 62(Pt 3):716–721. PMID: 22140171.
crossref
28. Segata N, Izard J, Waldron L, Gevers D, Miropolsky L, Garrett WS, Huttenhower C. Metagenomic biomarker discovery and explanation. Genome Biol. 2011; 12:R60. PMID: 21702898.
crossref
29. Puddu A, Sanguineti R, Montecucco F, Viviani GL. Evidence for the gut microbiota short-chain fatty acids as key pathophysiological molecules improving diabetes. Mediators Inflamm. 2014; 2014:162021. PMID: 25214711.
crossref
30. Woting A, Blaut M. The intestinal microbiota in metabolic disease. Nutrients. 2016; 8:202. PMID: 27058556.
crossref
31. Brown AJ, Goldsworthy SM, Barnes AA, Eilert MM, Tcheang L, Daniels D, Muir AI, Wigglesworth MJ, Kinghorn I, Fraser NJ, Pike NB, Strum JC, Steplewski KM, Murdock PR, Holder JC, Marshall FH, Szekeres PG, Wilson S, Ignar DM, Foord SM, Wise A, Dowell SJ. The orphan G protein-coupled receptors GPR41 and GPR43 are activated by propionate and other short chain carboxylic acids. J Biol Chem. 2003; 278:11312–11319. PMID: 12496283.
crossref
32. Mattace Raso G, Simeoli R, Russo R, Iacono A, Santoro A, Paciello O, Ferrante MC, Canani RB, Calignano A, Meli R. Effects of sodium butyrate and its synthetic amide derivative on liver inflammation and glucose tolerance in an animal model of steatosis induced by high fat diet. PLoS One. 2013; 8:e68626. PMID: 23861927.
crossref
33. Roelofsen H, Priebe MG, Vonk RJ. The interaction of short-chain fatty acids with adipose tissue: relevance for prevention of type 2 diabetes. Benef Microbes. 2010; 1:433–437. PMID: 21831781.
crossref
34. Romeo GR, Lee J, Shoelson SE. Metabolic syndrome, insulin resistance, and roles of inflammation: mechanisms and therapeutic targets. Arterioscler Thromb Vasc Biol. 2012; 32:1771–1776. PMID: 22815343.
35. Qin J, Li Y, Cai Z, Li S, Zhu J, Zhang F, Liang S, Zhang W, Guan Y, Shen D, Peng Y, Zhang D, Jie Z, Wu W, Qin Y, Xue W, Li J, Han L, Lu D, Wu P, Dai Y, Sun X, Li Z, Tang A, Zhong S, Li X, Chen W, Xu R, Wang M, Feng Q, Gong M, Yu J, Zhang Y, Zhang M, Hansen T, Sanchez G, Raes J, Falony G, Okuda S, Almeida M, LeChatelier E, Renault P, Pons N, Batto JM, Zhang Z, Chen H, Yang R, Zheng W, Li S, Yang H, Wang J, Ehrlich SD, Nielsen R, Pedersen O, Kristiansen K, Wang J. A metagenome-wide association study of gut microbiota in type 2 diabetes. Nature. 2012; 490:55–60. PMID: 23023125.
crossref
36. Vrieze A, Van Nood E, Holleman F, Salojarvi J, Kootte RS, Bartelsman JF, Dallinga-Thie GM, Ackermans MT, Serlie MJ, Oozeer R, Derrien M, Druesne A, Van Hylckama Vlieg JE, Bloks VW, Groen AK, Heilig HG, Zoetendal EG, Stroes ES, de Vos WM, Hoekstra JB, Nieuwdorp M. Transfer of intestinal microbiota from lean donors increases insulin sensitivity in individuals with metabolic syndrome. Gastroenterology. 2012; 143:913–916. PMID: 22728514.
crossref
37. Neyrinck AM, Possemiers S, Verstraete W, De Backer F, Cani PD, Delzenne NM. Dietary modulation of clostridial cluster XIVa gut bacteria (Roseburia spp.) by chitin-glucan fiber improves host metabolic alterations induced by high-fat diet in mice. J Nutr Biochem. 2012; 23:51–59. PMID: 21411304.
crossref
38. Kovatcheva-Datchary P, Nilsson A, Akrami R, Lee YS, De Vadder F, Arora T, Hallen A, Martens E, Bjorck I, Backhed F. Dietary fiber-induced improvement in glucose metabolism is associated with increased abundance of prevotella. Cell Metab. 2015; 22:971–982. PMID: 26552345.
crossref
39. Post RE, Mainous AG 3rd, King DE, Simpson KN. Dietary fiber for the treatment of type 2 diabetes mellitus: a meta-analysis. J Am Board Fam Med. 2012; 25:16–23. PMID: 22218620.
crossref
Fig. 1

Study design. Participants took fiber for 4 weeks and stopped for the next 4 weeks to evaluate restoration. Glycemic parameters, incretin levels during mixed-meal tolerance test (MMTT), and fecal microbiota were analyzed at weeks 0, 4, and 8 to evaluate baseline status, the immediate change after AGIO (Bukwang Pharmaceutical Co. Ltd.) intake, and restoration, respectively.

dmj-43-422-g001
Fig. 2

Area under the curves (AUCs) during mixed-meal tolerance test (MMTT) by week. AUCs during MMTT were compared at each week. Differences between each visit were analyzed by use of the Wilcoxon signed-rank test, and multiple comparisons were corrected with Bonferroni's method. There were no statistically significant changes in variables over the study period. GIP, gastric inhibitory polypeptide; GLP, glucagon-like peptide; PYY, peptide YY.

dmj-43-422-g002
Table 1

Baseline characteristics of all participants (n=10)

dmj-43-422-i001
Variable Value
Age, yr 61 (57–71.5)
Male sex 6 (60)
T2DM duration, yr 15 (11.5–18.3)
Glycosylated hemoglobin, % 8.0 (7.6–8.3)
Glycoalbumin, % 19.8 (17.0–27.3)
Metformin, mg/day 1,000 (850–1,700)
Glimepiride, mg/day 2.5 (1.8–6)
HTN 6 (60)
BMI, kg/m2 25.8 (23.3–28.2)
SBP, mm Hg 139 (127.8–151.8)
DBP, mm Hg 87 (85–89)
FPG, mg/dL 161.5 (147.3–207.3)
Insulin, μIU/mL 5.7 (4.1–9.6)
C-peptide, ng/mL 1.9 (1.5–3.2)
Total cholesterol, mg/dL 158 (133.8–189.3)
Triglyceride, mg/dL 105 (85.5–153)
HDL, mg/dL 48 (38.5–62.8)
LDL, mg/dL 96 (80.3–124.3)
CRP, mg/dL 0.05 (0.03–0.06)
Carbohydrate, g/day 225.9 (217.6–279.9)
Fat, g/day 45.0 (26.2–52.3)
Fiber, g/day 25.6 (19.5–32.8)

Values are presented as median (interquartile range) or number (%).

T2DM, type 2 diabetes mellitus; HTN, hypertension; BMI, body mass index; SBP, systolic blood pressure; DBP, diastolic blood pressure; FPG, fasting plasma glucose; HDL, high density lipoprotein; LDL, low density lipoprotein; CRP, C-reactive protein.

Table 2

Primary and secondary laboratory outcomes of all participants

dmj-43-422-i002
Variable Week 0 Week 4 Week 8
Glycoalbumin 19.8 (17.0–27.3) 19.4 (17.4–25.7) 21.1 (17.3–25.5)
Insulinogenic index 0.2 (0.1–0.3) 0.1 (0.1–0.3) 0.1 (0.1–0.3)
QUICKI 0.34 (0.30–0.36) 0.31 (0.30–0.35) 0.34 (0.30–0.35)
HOMA2-IR 0.8 (0.6–1.5) 1.3 (0.8–1.6) 1.0 (0.6–1.5)
Matsuda index 4.1 (2.3–5.2) 2.6 (2.2–4.9) 3.4 (2.5–4.9)
Disposition index 0.5 (0.39–0.90) 0.4 (0.4–0.9) 0.6 (0.4–0.9)
LPS (log) 81.0 (47.4–259.2) 72.0 (32.8–455.7) 93.7 (45.3–376.6)

Values are presented as median (interquartile range). Wilcoxon signed-rank tests were adopted for the analysis, all P>0.05.

QUICKI, quantitative insulin sensitivity check index; HOMA2-IR, homeostatic model assessment of insulin resistance model 2; LPS, lipopolysaccharide.

Table 3

Comparison between the ‘responders’ and the ‘nonresponders’

dmj-43-422-i003
Variable Responders (patients 1, 7, 13) Nonresponders (patients 5, 9, 14)
Week 0 Week 4 Week 8 Week 0 Week 4 Week 8
Age, yr 56 (57–73) 59 (57–61)
Male sex 2 (66.7) 3 (100)
DM duration, yr 13 (12–14) 16 (10–19)
HbA1c, %a 7.8 (7.0–7.9) 8.2 (8.1–8.6)
Metformin, mg/day 1,000 (1,000–1,700) 850 (850–2,000)
Glimepiride, mg/day 6 (2–6) 4 (1–6)
HTN 1 (33.3) 1 (33.3)
BMI, kg/m2 24.8 (19.2–28.0) 25.4 (20–27.4) 25.2 (20.2–27.7) 26.6 (26.6–33.2) 26.6 (26.4–32.7) 26.8 (26.2–32.3)
SBP, mm Hg 136 (124–155) 144 (121–149) 127 (110–171) 133 (128–151) 131 (122–154) 140 (112–144)
DBP, mm Hg 85 (74–88) 89 (76–92) 84 (67–103) 89 (87–93) 91 (68–93) 79 (65–83)
FPG, mg/dL 150 (142–232) 148 (133–243) 172 (162–201) 170 (117–217) 167 (161–278) 191 (154–218)
Insulin, μIU/mL 4.1 (4.0–13.1) 3.9 (3.5–11.6) 4.2 (1.0–10.1) 5.6 (4.1–8.4) 8.3 (6.1–9.5) 7.0 (3.8–9.8)
C-peptide, ng/mL 1.7 (1.3–4.3) 1.6 (1.5–4.3) 2.1 (1.3–4.2) 2.1 (2.0–2.8) 2.2 (2.2–2.9) 2.3 (2.3–3.3)
Total cholesterol, mg/dL 135 (130–221) 171 (144–215) 151 (145–245) 158 (158–158) 185 (183–189) 188 (171–190)
Triglyceride, mg/dL 86 (67–159) 136 (109–169) 102 (102–151) 97 (89–151) 101 (90–203) 88 (84–242)
HDL, mg/dL 62 (30–65) 60 (32–65) 63 (41–76) 48 (44–48) 53 (52–56) 54 (43–55)
LDL, mg/dL 81 (58–149) 91 (86–144) 80 (74–158) 96 (94–101) 131 (109–134) 128 (99–131)
Carbohydrate, g/day 248.6 (216.4–288.8) 245.6 (220.6–312.9) 285.5 (254.7–367.1)a 278.0 (218–285.5) 262.1 (219.9–342.3) 227.6 (200.5–238.5)a
Fat, g/day 44 (25.4–87.1) 45.6 (24.4–45.6) 51.4 (18.6–64.8) 45.9 (32.1–54.1) 52.0 (39.6–60.5) 31.5 (15.6–50.4)
Fiber, g/day 32.6 (14.8–33.2) 32.9 (16.4–34.6) 33.6 (18.1–39.1) 22.5 (21–31.9) 21.6 (21.3–23.1) 21.6 (13.1–22.8)
Insulinogenic index 0.09 (0.05–0.15) 0.06 (0.06–0.16) 0.08 (0.04–0.14) 0.18 (0.17–0.36) 0.15 (0.10–0.48) 0.20 (0.15–0.61)
QUICKI 0.36 (0.29–0.36) 0.37 (0.29–0.37) 0.35 (0.30–0.46) 0.35 (0.31–0.36) 0.31 (0.30–0.33) 0.33 (0.30–0.35)
Matsuda index 5.02 (2.00–5.55) 5.59 (2.24–6.86) 4.22 (2.99–12.88) 4.11 (2.45–6.99) 2.41 (1.97–4.37) 2.54 (2.41–5.62)
HOMA2-IR 0.60 (0.58–2.10) 0.56 (0.51–1.84) 0.63 (0.15–1.55) 0.78 (0.61–1.32) 1.39 (0.90–1.49) 1.02 (0.58–1.52)
Disposition index 0.49 (0.10–0.77) 0.43 (0.14–0.87) 0.57 (0.12–1.00) 1.27 (0.41–1.47) 0.42 (0.35–0.94) 0.83 (0.48–1.55)
Glycoalbumin, % 18.8 (17.0–28.9) 18.4 (16.1–26.6) 18.5 (17–25.4) 19.8 (14.9–26.8) 20.2 (15.1–25.0) 21.4 (14.8–23.9)
LPS (log) 92.8 (36.6–524.5) 81.4 (19.3–453.8) 92.1 (20.0–362.9) 69.3 (42.4–606.4) 62.7 (57.3–596.8) 95.3 (47.2–600.0)

Values are presented as median (range) or number (%).

DM, diabetes mellitus; HbA1c, glycosylated hemoglobin; HTN, hypertension; BMI, body mass index; SBP, systolic blood pressure; DBP, diastolic blood pressure; FPG, fasting plasma glucose; HDL, high density lipoprotein; LDL, low density lipoprotein; QUICKI, quantitative insulin sensitivity check index; HOMA2-IR, homeostatic model assessment of insulin resistance model 2; LPS, lipopolysaccharide.

aFor comparing ‘responders’ and ‘nonresponders’ at each week, the Mann-Whitney U test was adopted. Only HbA1c at week 0 and carbohydrate consumption at week 8 showed statistical significance (P<0.05). Wilcoxon signed-rank tests were used to compare values of each week in the ‘responders’ and the ‘nonresponders,’ respectively. All analyses showed no statistically significant difference.

TOOLS
Similar articles