Journal List > Diabetes Metab J > v.43(2) > 1142349

Cho, Rhee, Park, Kwon, Jung, Han, Park, Park, Kim, Yoo, Lee, and on behalf of Taskforce Team of the Obesity Fact Sheet of the Korean Society for the Study of Obesity: The Risk of Myocardial Infarction and Ischemic Stroke According to Waist Circumference in 21,749,261 Korean Adults: A Nationwide Population-Based Study

Abstract

Background

Waist circumference (WC) is a well-known obesity index that predicts cardiovascular disease (CVD). We studied the relationship between baseline WC and development of incident myocardial infarction (MI) and ischemic stroke (IS) using a nationwide population-based cohort, and evaluated if its predictability is better than body mass index (BMI).

Methods

Our study included 21,749,261 Koreans over 20 years of age who underwent the Korean National Health Screening between 2009 and 2012. The occurrence of MI or IS was investigated until the end of 2015 using National Health Insurance Service data.

Results

A total of 127,289 and 181,637 subjects were newly diagnosed with MI and IS. The incidence rate and hazard ratio of MI and IS increased linearly as the WC level increased, regardless of adjustment for BMI. When the analyses were performed according to 11 groups of WC, the lowest risk of MI was found in subjects with WC of 70 to 74.9 and 65 to 69.9 cm in male and female, and the lowest risk of IS in subjects with WC of 65 to 69.9 and 60 to 64.9 cm in male and female, respectively. WC showed a better ability to predict CVD than BMI with smaller Akaike information criterion. The optimal WC cutoffs were 84/78 cm for male/female for predicting MI, and 85/78 cm for male/female for predicting IS.

Conclusion

WC had a significant linear relationship with the risk of MI and IS and the risk began to increase from a WC that was lower than expected.

INTRODUCTION

The years of potential life lost according to cardiovascular disease (CVD) are increasing worldwide [1]. Ischemic heart disease and ischemic stroke (IS), which are the first and second most common cause of mortality from CVD, are positively correlated with obesity [2]. The increase in adipose tissue due to obesity leads to the atherosclerosis and cardiovascular outcome by exacerbation of dyslipidemia, increased insulin resistance, induction of several cytokines and inflammatory markers through adipokines, oxidative stress, pro-coagulation, endothelial dysfunction, changes in hemodynamics, and ventricular dysfunction [3]. In particular, the increase in visceral fat has been demonstrated in various studies as showing a significant relationship between the risk of CVD and obesity [456].
Body mass index (BMI) is the most frequently used measurement for obesity. However, body adiposity differs according to age, sex, and ethnicity, and BMI alone is not able to distinguish between a person with excess fat and a person with high muscle mass, who would thus have the same cardiovascular risk [7]. Waist circumference (WC) is another measure of obesity, which considers fat distribution and correlates well with abdominal imaging in its ability to discriminate visceral adiposity from simple obesity [8]. Recent studies have emphasized that where fat accumulates is more important than the simple fat mass [9]. Thus, indices that reflect central obesity such as WC, waist-hip ratio (WHR), and waist-height ratio (WHtR) have gained popularity for the measurement of relative visceral fat distribution [1011].
The World Health Organization recommends, for the global population, starting obesity management from a WC of >90 cm in male and >80 cm in female because of increasing the metabolic complications [12]. The risk of CVD caused by abdominal obesity varies from race to ethnicity [5], so each ethnicity has its own standard value for the management of obesity [13]. Asians have a relatively lower WC cutoff point, because of a relatively larger amount of visceral adipose tissue compared with other races [1415]. However, these criteria raised several issues, since the guidelines were based on epidemiological data from Chinese living in Hong Kong and Singapore, not including other ethnic groups in Asia [1617]. In addition, even within Asian ethnicity, there are efforts to define their own optimal WC cutoffs for the prediction of CVD risk [1819].
Although numerous studies suggest WC as the optimal indicator of abdominal obesity, the usage of WC as the definite marker of obesity is limited due to the lack of objectivity of measurement. In addition, there are still controversies regarding the superiority of WC to BMI for the detection of CVD risk. Therefore, we investigated the relationship between baseline WC and incident myocardial infarction (MI) and IS in 21,749,261 Korean adults using a nationwide population-based study. Furthermore, we included BMI in the analyses, to see whether WC or BMI could be the better predictor for CVD than the other.

METHODS

Database of the National Health Insurance Service

Nearly all (97.2% of the Korean populations, approximately 50 million) Koreans are covered by the National Health Insurance Service (NHIS), which is a nonprofit, single-payer organization provided by the Korean government. The NHIS maintains patients' demographic information, examination, claims for disease diagnosis codes of the International Classification of Diseases (ICD-10) and treatment that can be used to produce a population-based cohort. [20]. Insured Korean adults over the age of 40 and employees over the age of 20 undergo regular health checkups provided by the NHIS every 1 or 2 years. The Korean National Health Screening databases obtained through these checkups provide a variety of information including anthropometric measurements, health questionnaires and laboratory findings. These databases and the aforementioned nationwide medical records were combined and analyzed to construct a cohort for investigating health problems, after the NHIS approved the use of its database for the research (research number NHIS-2017-1-201).
Our study protocol was approved by the official review committee and the Institutional Review Board of the Korea National Institute for Bioethics Policy (P01-201603-21-005) and informed consent was waived because of the anonymous nature of the data. This study was carried out according to the ethical principles of the Declaration of Helsinki.

Study population

Our study included 21,749,261 Koreans over 20 years of age who underwent the Korean National Health Screening between 2009 and 2012. Baseline enrollment was conducted for participants who had health screening for 4 years from 2009 to 2012 (n=23,503,802); participants with missing data of baseline characteristics and covariates (n=125,699) or were younger than 20 years of age (n=50,430) were excluded first from the study. Participants previously diagnosed with MI (at least 1 claim with the ICD code I21 or I22; n=414,810) or IS (at least 1 claim with ICD code I63 or I64; n=1,008,422) identified with the records of NHIS, or a history of heart disease or stroke according to the self-administered questionnaire of health screening (n=664,487) were further excluded (total n=1,578,412), leaving 21,749,261 subjects participating in the study (Supplementary Fig. 1).

Anthropometric measurement and baseline characteristics

Body weight (kg) and height (cm) were measured using an electronic scale, and WC (cm) was measured at the middle point between the rib cage and iliac crest by trained examiners. All blood samples were collected after fasting, and blood pressure was measured using a sphygmomanometer after 5 minutes of rest. Baseline health behaviors such as income, smoking, alcohol drinking and exercise were confirmed through standardized questionnaires. The diagnosis of diabetes, hypertension, and hyperlipidemia was confirmed using laboratory data (fasting blood glucose level ≥126 mg/dL; systolic blood pressure ≥140 mm Hg and diastolic blood pressure ≥90 mm Hg; total cholesterol levels ≥240 mg/dL) or ICD code (ICD-10 code E11 to 14; I10 to I15; or E78) with a claim of for medication for the individual disease. Cancer was defined as patient registration in the NHIS with ICD-10 code C, and chronic obstructive pulmonary disease (COPD) was defined as ICD-10 codes J41 to J44.

Study design and outcomes

We recorded newly diagnosed MI and IS of participants using the claim records of NHIS until the end of 2015. MI was defined when a claim of ICD code I21 or I22 through the NHIS was made at least twice, or once if hospitalization was required, during the observation period. IS was confirmed by the ICD code I63 or I64 with hospitalization and a claim for computed tomography or magnetic resonance imaging. The WC of subjects was divided into six levels at intervals of 5 cm, and the incidence rates (IR, per 1,000 person years) and hazard ratio (HR) of newly diagnosed MI or IS were compared to determine how the risk of CVD changes as the WC level increases, using a reference range of 85 to 89.9 cm for male and 80 to 84.9 cm for female. These were the reference ranges immediately preceding the current standard of abdominal obesity in Korean male and female (≥90 and ≥85 cm, respectively) [18].
Furthermore, WC was divided into 11 levels for analysis to identify the detailed differences and lowest level in risk according to WC. HRs were compared according to BMI to confirm the impact of BMI on CVD, divided into five levels (from underweight to obese) using 18.5 to 22.9 kg/m2 as the normal reference range for adult Koreans [2122].

Statistical analysis

HRs were assessed using the Cox proportional hazards model with a 95% confidence interval (CI) by analyzing the risk of MI and IS according to baseline BMI or WC. We conducted multivariable adjustments of age, sex, health behaviors (income below the 20th percentile or not, current smoking or not, drinking more than 30 g/day or not, regular exercise or not; vigorous exercise ≥3 days/week or moderate exercise ≥5 days/week) and underlying diseases (hypertension, diabetes, dyslipidemia, COPD, and cancer) that could affect the outcome, and further included BMI or WC levels as a calibration variable in the analyses of WC or BMI to demonstrate independent relationships not affected by another anthropometric marker. In multivariate models that include WC and BMI in the same model, variance inflation factor (VIF) values were calculated and VIF values did not exceed 10. Therefore, we assumed that including these two factors in the same model would not have a multicollinearity problem. Continuous HR according to the change of the standard deviation of BMI and WC were analyzed and Akaike information criterion (AIC) was calculated were calculated to compare the predictive value for CVD between BMI and WC. Receiver operating characteristics (ROC) curve analyses were performed to calculate optimal WC cutoffs for predicting MI and IS.
For the designation of levels of WC, we've drawn log-log survival plot for each outcome in total and different sex groups to confirm whether six or 11 levels of WC groups satisfied proportional hazard assumption. As the curves were parallel according to different WC levels, we could assume these models satisfied proportional hazard assumptions.
Categorical variables were analyzed using the chi-square test, and continuous variables were analyzed using analysis of variance. SAS version 9.3 (SAS Institute Inc., Cary, NC, USA) was used for all statistical analyses.

RESULTS

Baseline characteristics

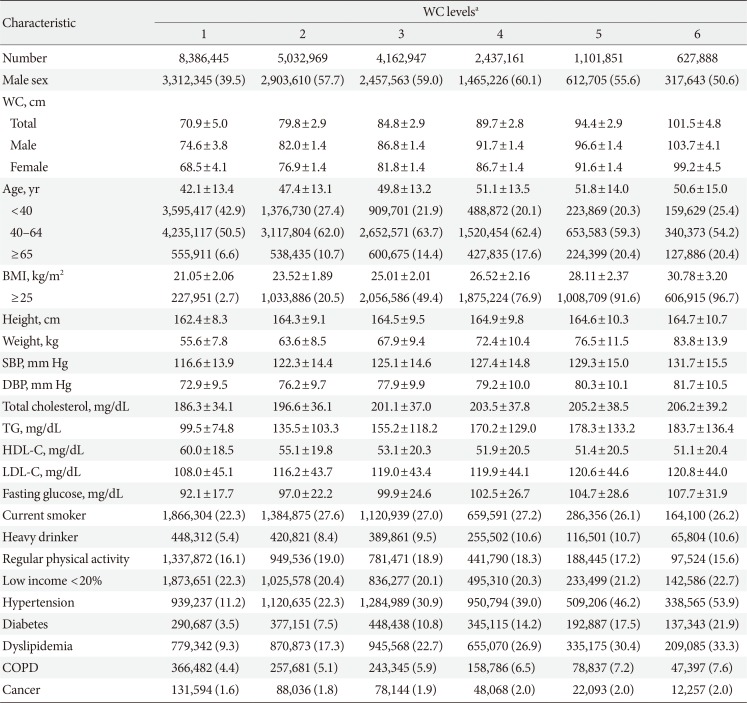
The mean duration of follow-up of participants was 5.44 years, and the median time to development of both MI and IS was 2.99 years. BMI, blood pressure, fasting glucose, total cholesterol, triglyceride and prevalence of hypertension, diabetes and dyslipidemia tended to increase as the WC level increased from 1 to 6 (Table 1). The top 80th percentile of WC was identified as 90 cm for male and 83 cm for female. The baseline characteristics showed similar trends in male and female (Supplementary Table 1).

WC analysis in six levels

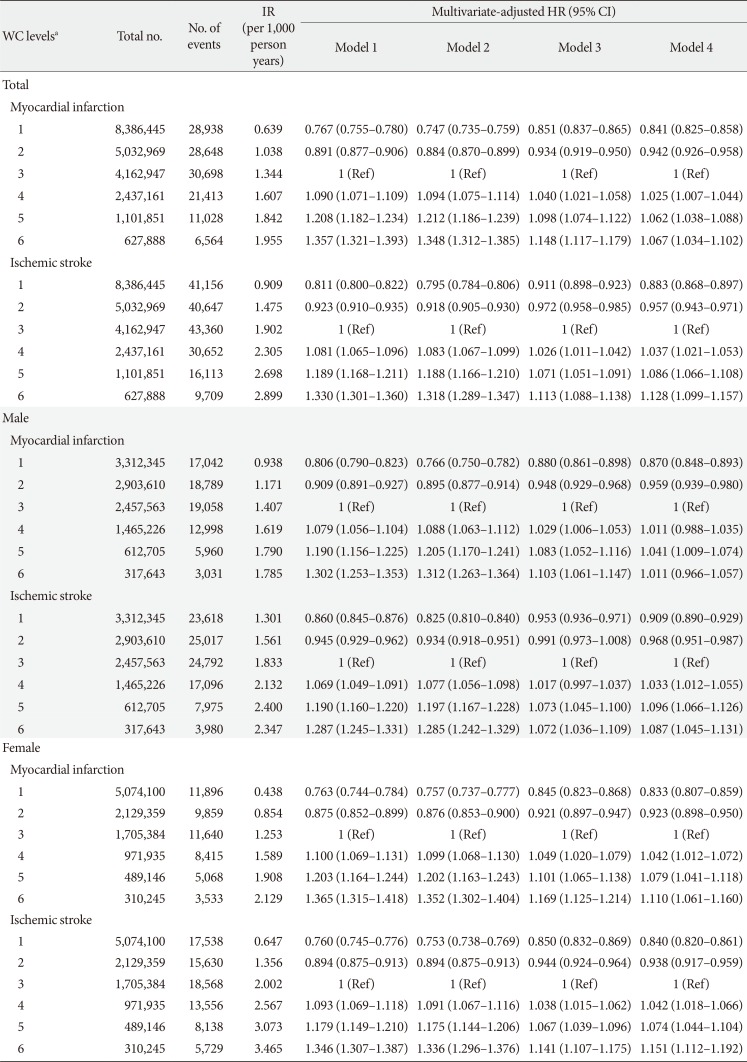
Of the total 21,749,261 participants, 127,289 (0.59% of total) were newly diagnosed with MI and 181,637 (0.84%) were diagnosed with IS. The IRs and HRs after adjusting variables increased linearly with increasing WC level with 5-cm intervals from the lowest (male <80 cm, female <75 cm; IR, 0.639; HR, 0.851; 95% CI, 0.837 to 0.865; P<0.0001) to the highest (male ≥100 cm, female ≥95 cm; IR, 1.955; HR, 1.148; 95% CI, 1.117 to 1.179; P<0.0001) in six WC levels for MI, and a similar pattern was also confirmed for IS (Table 2). Even after adding BMI as a variable to model 3 (including all other variables of our study), these trends did not change for either outcome. Results by sex were similar to those for the entire subject population except for the highest WC level in male (Table 2).

WC analysis in 11 levels

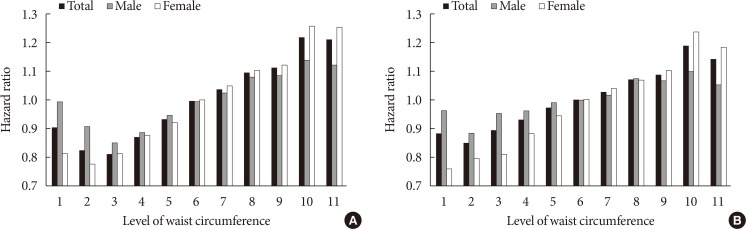
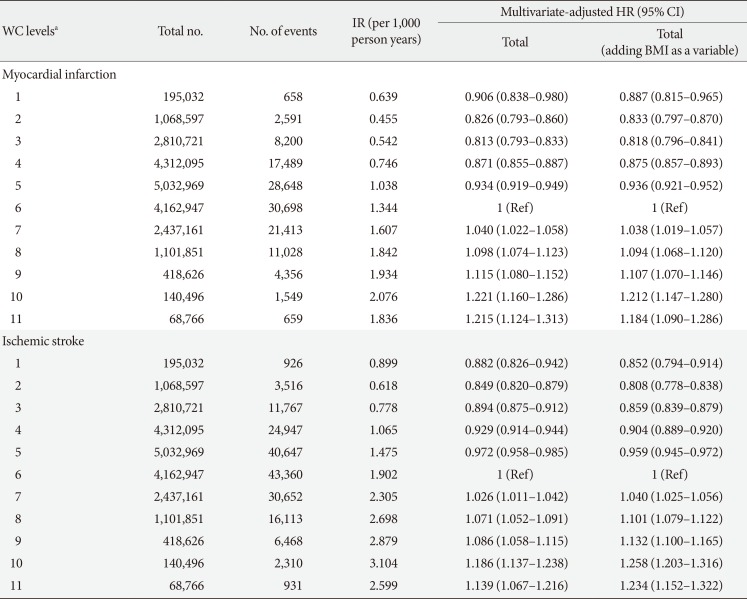
When the WC level was divided into 11 levels of wider categories with 5-cm intervals, the lowest MI risk was found for a WC of 70 to 74.9 cm for male and 65 to 69.9 cm for female (IR, 0.542; HR, 0.813; 95% CI, 0.793 to 0.833; P<0.0001), and the lowest IS risk was for 65 to 69.9 in male and 60 to 64.9 cm in female (IR, 0.618; HR, 0.849; 95% CI, 0.82 to 0.879; P<0.0001) (Table 3). Beyond that level, the risk ratio of MI and IS increased linearly with increasing WC level except for the highest WC level (male ≥110 cm, female ≥105 cm), and there was no significant change in the overall trend even after additional adjustment for BMI. According to sex, the lowest IRs of both MI and IS were confirmed in lower WC level (WC level 2, 60 to 64.9 cm) in female than in male (WC level 3, 70 to 74.9 cm) (Supplementary Table 2). The variation and slope of the risk with the changing level of WC seemed to be relatively larger and steeper in female (Fig. 1).

Comparison of BMI and WC for prediction of CVD

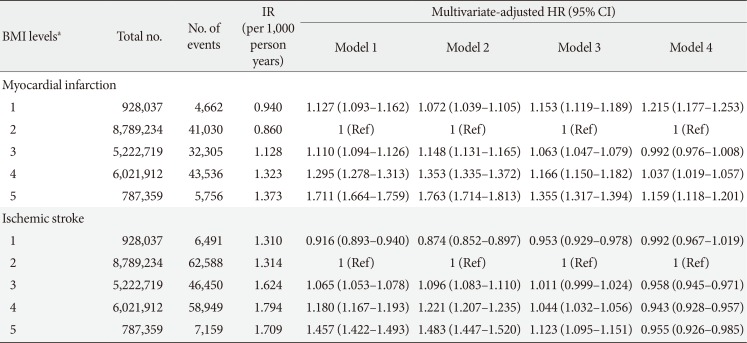
In the IRs and HRs according to BMI, a U-shaped curve was obtained in the MI group with the reference range (BMI 18.5 to 22.9 kg/m2) as the lowest point. The risk of IS showed a linearly increasing pattern with increasing BMI, although this tendency was lost after adjusting for WC (Table 4). The continuous HR according to the change of standard deviation were higher for WC (continuous HR, 1.105 for MI; 1.067 for IS) than for BMI (continuous HR, 1.075 for MI; 1.032 for IS) for both MI and IS (Supplementary Table 3). When AIC was calculated in two models predicting CVD with BMI and WC, the model using WC showed smaller AIC, suggesting superiority of WC to predict CVD to BMI (Supplementary Table 3).
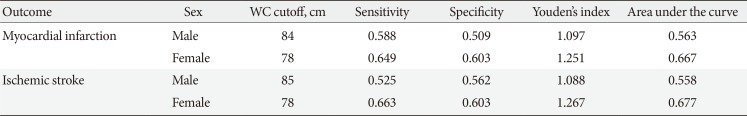
When ROC curve analyses were performed to calculate the optimal WC cutoffs for prediction of CVD, the optimal cutoffs were 84/78 cm for male/female for predicting MI, and 85/78 cm for male/female for predicting IS (Table 5).

DISCUSSION

In this study, we studied the relationship between baseline WC and the risk of incident CVD events represented by MI and IS, conducted in a nationwide setting of nearly half of the adult population in Korea, more than 20 million. In our knowledge, this study is one of the largest studies that were performed regarding this issue in a huge, homogenous nationwide population-based cohort. We demonstrated that WC had a significant linear relationship and powerful enough to predict the risk of MI and IS. The incidence and risk of MI and IS were beginning to increase from a lower WC than the current cutoff of abdominal obesity suggested from the guidelines. In addition, the optimal cutoffs for predicting CVD were lower than current recommended cutoffs. These results are emphasizing the importance of abdominal obesity and the accuracy of WC for the prediction of CVD in a nationwide population base. We also showed the superiority of WC on the prediction of CVD to BMI.
According to the WHO criteria of abdominal obesity, the gaps according to different sex are 14 cm globally and 10 cm in Asians [12]. These were larger than the current Korean standard of WC of a 5 cm difference [18]. This narrow gap was also indirectly seen through the WC corresponding to the 80th percentile, which was 90 cm for male and 86.5 cm for female. In our study reflecting more recent trends of obesity in Korea, the IRs of both MI and IS were higher in female than in male as the WC is larger than the reference range. The risk of MI and IS in female began to increase at lower levels than in male, and the increase in the slope after the lowest point of WC was relatively steeper. In addition, the 80th percentiles of WC were identified as 90 cm for male and 83 cm for female, a larger sex gap and a lower WC in female than were found in previous study. Yusuf et al. [5] demonstrated an increase in the risk of MI in 19% of male and 40% of female per 1 standard deviation change in WC. In a meta-analysis conducted by Lee et al. [23], WC had a higher area under the curve in female than in male in discrimination of cardiovascular risk. Considering these results together, female should pay more attention to the risk of CVD due to increasing WC than male do [23].
In the analysis of the BMI model, the crude incidence of MI was lowest in the normal (BMI 18.5 to 22.9 kg/m2) group and showed a U-shaped pattern. After adjustment for WC, the risk of people with underweight further increased. These people have lower lean body mass, and this lack of lean body mass is associated with atherosclerosis and the risk of subclinical CVD [24]. In a meta-analysis of sex-specific relationships between BMI and coronary heart disease, higher risk was observed in both male and female at underweight compared to normal weight [25]. A previous study suggested that BMI was a more important risk factor of MI than the presence of the metabolic syndrome, but this study did not classify the BMI in the underweight category separately [26]. And the “normal” (including the underweight) BMI group with the metabolic syndrome had a higher risk than the metabolically healthy overweight group. After adjusting for the components of the metabolic syndrome including WC, the risk for CVD in overweight to obese BMI level was relatively attenuated in our study. In the case of IS, there have been arguments in several studies on the superiority of BMI and WC [2728]. The reason for attenuation of the risk for IS in high BMI group after adjustment for WC is not clear. However, it could be assumed that in this group with high BMI, WC could have stronger effect on IS risk than BMI itself.
Our study seemed to show a linear increase in risk in the BMI model after adjusting for all variables except WC, but this aspect disappeared after additional adjustment for WC. Furthermore, when BMI was further adjusted in the analysis of the WC model, the linear trend was augmented. BMI has a limitation with respect to distinguishing between fat and lean body mass, and many studies including large-scale meta-analyses have demonstrated that markers of central obesity are superior to BMI in predicting CVD risk [456212930]. After additional analyses to further confirm the efficacy of risk prediction between BMI and WC in our study, the AIC and continuous HR of WC was higher than that of BMI in risk prediction of both MI and IS. Taken all these findings together, we suggested that WC, a marker of a metabolically unhealthy phenotype, is a better predictor of incident CVD than BMI.
In addition to WC, there are various markers of central obesity such as WHR and WHtR. Some studies have shown that these markers predict the risk of CVD better than WC does [52131]. However, the differences between WC and others in these studies were small or not significant, and WC was still shown to be an important marker [462832]. Furthermore, WHR was less reliable than WC [3334]. Despite that we could not check the above markers, WC was powerful enough to predict the risk of MI and IS and had a significant linear relationship with outcomes in our study. Therefore, WC as a simple marker was useful to predict CVD, especially in a nationwide setting as in our study where reliability and simplicity of measurement and interpretation could be important.
Our study has several limitations. First, it appeared that the risk started to increase in the very low WC level (WC level 1: male <65 cm, female <60 cm) when the WC was further divided into 11 levels. This was not seen in the analyses using wider range of the WC divided into six levels. The CI was wider and the number of participants was smaller in the very low WC level than in the other levels. In addition, because the average of BMI and the frequency of regular physical activity was lowest in the very low WC group (BMI 18.43 kg/m2; regular physical activity 10.37%; data not shown), we could not rule out that lean body and lack of fitness were associated with an increase in the risk of CVD [35]. Otherwise, the possibility of failure to exclude any diseases that might cause cachexic conditions related with high risk for CVD in this group, could exist. However, these are only assumptions and it might not explain the actual association. Second, the study design with a relatively short follow-up period and no washout period may confound the casual relationship. We tried to overcome the statistical weakness of our study by enrolling more than 20 million people, nearly half of the adult population in Korea, and excluding participants using strict criteria of MI and IS preceding the initial enrollment process in order not to affect the casual relationship. Third, the diagnosis of outcomes was confirmed using claim data of the NHIS, which might differ from the actual incidence of CVD. Fourth, since our study included only Koreans, our results cannot be applied directly to other ethnicities. Fifth, although WC is a convenient and common method to assess abdominal obesity, WC measurement could have bias and the accuracy could depend on the measurer's experience, relatively subjective compared to BMI [36]. Lastly, the validation of operational definition of CVD used in our study was not performed. Therefore, there could be gap between the actual CVD development and our study results. Despite these limitations, our study results provide supportive information to the published literature regarding the association between abdominal obesity and CVD risk.
In conclusion, WC had a significant linear relationship with the risk of MI and IS and predicted CVD events better than BMI in a nationwide population based-cohort of more than 20 million Korean adults. These results indicate the importance of WC for predicting CVD events even in the short-term follow-up. In addition, the risk of incident MI and IS increased from a lower WC level than the current cut-off of abdominal obesity and the optimal cutoffs for predicting CVD were lower than the currently recommended cutoffs from the guidelines. The risk of CVD according to increasing WC seems to be larger than we've expected in this study population. Therefore, we need to inform and emphasize the risk of CVD in people with abdominal obesity.

ACKNOWLEDGMENTS

We sincerely thank the Korean Society for the Study of Obesity for their assistance of our study with funding of analyzing and exporting the cohort data of NHIS. The continuing interest in managing obesity-related problems and the financial support of the Society has always been helpful for us. Also, we thank the Korean National Health Insurance Corporation for organizing and providing the excellent cohort database based on nationwide population.
Our sponsor (Korean Society for the Study of Obesity) assisted us with funding of exporting the cohort data of NHIS. The sponsor itself had no role in the collection, analysis or interpretation of the data, or in the drafting and publication of the paper. The corresponding authors (Soon-Jib Yoo and Won-Young Lee) presented the overall design of the research, had full access to all the data in the study and had final responsibility for the decision to submit for publication.

Notes

CONFLICTS OF INTEREST: No potential conflict of interest relevant to this article was reported.

References

1. Moran AE, Forouzanfar MH, Roth GA, Mensah GA, Ezzati M, Murray CJ, Naghavi M. Temporal trends in ischemic heart disease mortality in 21 world regions, 1980 to 2010: the Global Burden of Disease 2010 study. Circulation. 2014; 129:1483–1492. PMID: 24573352.
2. Roth GA, Forouzanfar MH, Moran AE, Barber R, Nguyen G, Feigin VL, Naghavi M, Mensah GA, Murray CJ. Demographic and epidemiologic drivers of global cardiovascular mortality. N Engl J Med. 2015; 372:1333–1341. PMID: 25830423.
crossref
3. Van Gaal LF, Mertens IL, De Block CE. Mechanisms linking obesity with cardiovascular disease. Nature. 2006; 444:875–880. PMID: 17167476.
crossref
4. Rexrode KM, Carey VJ, Hennekens CH, Walters EE, Colditz GA, Stampfer MJ, Willett WC, Manson JE. Abdominal adiposity and coronary heart disease in women. JAMA. 1998; 280:1843–1848. PMID: 9846779.
crossref
5. Yusuf S, Hawken S, Ounpuu S, Bautista L, Franzosi MG, Commerford P, Lang CC, Rumboldt Z, Onen CL, Lisheng L, Tanomsup S, Wangai P Jr, Razak F, Sharma AM, Anand SS. INTERHEART Study Investigators. Obesity and the risk of myocardial infarction in 27,000 participants from 52 countries: a case-control study. Lancet. 2005; 366:1640–1649. PMID: 16271645.
crossref
6. de Koning L, Merchant AT, Pogue J, Anand SS. Waist circumference and waist-to-hip ratio as predictors of cardiovascular events: meta-regression analysis of prospective studies. Eur Heart J. 2007; 28:850–856. PMID: 17403720.
crossref
7. Yajnik CS, Yudkin JS. The Y-Y paradox. Lancet. 2004; 363:163. PMID: 14726172.
crossref
8. Oh HG, Nallamshetty S, Rhee EJ. Increased risk of progression of coronary artery calcification in male subjects with high baseline waist-to-height ratio: the Kangbuk Samsung Health Study. Diabetes Metab J. 2016; 40:54–61. PMID: 26912156.
crossref
9. Mathieu P, Pibarot P, Larose E, Poirier P, Marette A, Despres JP. Visceral obesity and the heart. Int J Biochem Cell Biol. 2008; 40:821–836. PMID: 18201922.
crossref
10. Xu Z, Qi X, Dahl AK, Xu W. Waist-to-height ratio is the best indicator for undiagnosed type 2 diabetes. Diabet Med. 2013; 30:e201–e207. PMID: 23444984.
11. Browning LM, Hsieh SD, Ashwell M. A systematic review of waist-to-height ratio as a screening tool for the prediction of cardiovascular disease and diabetes: 0.5 could be a suitable global boundary value. Nutr Res Rev. 2010; 23:247–269. PMID: 20819243.
crossref
12. World Health Organization. Waist circumference and waist-hip ratio: report of a WHO expert consultation. Geneva: World Health Organization;2011.
13. Alberti KG, Zimmet P, Shaw J. Metabolic syndrome: a new world-wide definition. A Consensus Statement from the International Diabetes Federation. Diabet Med. 2006; 23:469–480. PMID: 16681555.
14. Tan CE, Ma S, Wai D, Chew SK, Tai ES. Can we apply the National Cholesterol Education Program Adult Treatment Panel definition of the metabolic syndrome to Asians. Diabetes Care. 2004; 27:1182–1186. PMID: 15111542.
crossref
15. Lear SA, Humphries KH, Kohli S, Chockalingam A, Frohlich JJ, Birmingham CL. Visceral adipose tissue accumulation differs according to ethnic background: results of the Multicultural Community Health Assessment Trial (M-CHAT). Am J Clin Nutr. 2007; 86:353–359. PMID: 17684205.
crossref
16. Deurenberg-Yap M, Chew SK, Lin VF, Tan BY, van Staveren WA, Deurenberg P. Relationships between indices of obesity and its co-morbidities in multi-ethnic Singapore. Int J Obes Relat Metab Disord. 2001; 25:1554–1562. PMID: 11673781.
crossref
17. Deurenberg-Yap M, Schmidt G, van Staveren WA, Deurenberg P. The paradox of low body mass index and high body fat percentage among Chinese, Malays and Indians in Singapore. Int J Obes Relat Metab Disord. 2000; 24:1011–1017. PMID: 10951540.
crossref
18. Yoon YS, Oh SW. Optimal waist circumference cutoff values for the diagnosis of abdominal obesity in korean adults. Endocrinol Metab (Seoul). 2014; 29:418–426. PMID: 25559570.
crossref
19. Ekoru K, Murphy GAV, Young EH, Delisle H, Jerome CS, Assah F, Longo-Mbenza B, Nzambi JPD, On'Kin JBK, Buntix F, Muyer MC, Christensen DL, Wesseh CS, Sabir A, Okafor C, Gezawa ID, Puepet F, Enang O, Raimi T, Ohwovoriole E, Oladapo OO, Bovet P, Mollentze W, Unwin N, Gray WK, Walker R, Agoudavi K, Siziya S, Chifamba J, Njelekela M, Fourie CM, Kruger S, Schutte AE, Walsh C, Gareta D, Kamali A, Seeley J, Norris SA, Crowther NJ, Pillay D, Kaleebu P, Motala AA, Sandhu MS. Deriving an optimal threshold of waist circumference for detecting cardiometabolic risk in sub-Saharan Africa. Int J Obes (Lond). 2018; 42:487–494.
crossref
20. Song SO, Jung CH, Song YD, Park CY, Kwon HS, Cha BS, Park JY, Lee KU, Ko KS, Lee BW. Background and data configuration process of a nationwide population-based study using the Korean National Health Insurance System. Diabetes Metab J. 2014; 38:395–403. PMID: 25349827.
crossref
21. WHO Expert Consultation. Appropriate body-mass index for Asian populations and its implications for policy and intervention strategies. Lancet. 2004; 363:157–163. PMID: 14726171.
22. Oh SW, Shin SA, Yun YH, Yoo T, Huh BY. Cut-off point of BMI and obesity-related comorbidities and mortality in middle-aged Koreans. Obes Res. 2004; 12:2031–2040. PMID: 15687405.
crossref
23. Lee CM, Huxley RR, Wildman RP, Woodward M. Indices of abdominal obesity are better discriminators of cardiovascular risk factors than BMI: a meta-analysis. J Clin Epidemiol. 2008; 61:646–653. PMID: 18359190.
crossref
24. Newman AB, Gottdiener JS, Mcburnie MA, Hirsch CH, Kop WJ, Tracy R, Walston JD, Fried LP. Cardiovascular Health Study Research Group. Associations of subclinical cardiovascular disease with frailty. J Gerontol A Biol Sci Med Sci. 2001; 56:M158–M166. PMID: 11253157.
crossref
25. Mongraw-Chaffin ML, Peters SAE, Huxley RR, Woodward M. The sex-specific association between BMI and coronary heart disease: a systematic review and meta-analysis of 95 cohorts with 1·2 million participants. Lancet Diabetes Endocrinol. 2015; 3:437–449. PMID: 25960160.
crossref
26. Thomsen M, Nordestgaard BG. Myocardial infarction and ischemic heart disease in overweight and obesity with and without metabolic syndrome. JAMA Intern Med. 2014; 174:15–22. PMID: 24217719.
crossref
27. Hu G, Tuomilehto J, Silventoinen K, Sarti C, Mannisto S, Jousilahti P. Body mass index, waist circumference, and waist-hip ratio on the risk of total and type-specific stroke. Arch Intern Med. 2007; 167:1420–1427. PMID: 17620537.
crossref
28. Yatsuya H, Folsom AR, Yamagishi K, North KE, Brancati FL, Stevens J. Atherosclerosis Risk in Communities Study Investigators. Race- and sex-specific associations of obesity measures with ischemic stroke incidence in the Atherosclerosis Risk in Communities (ARIC) study. Stroke. 2010; 41:417–425. PMID: 20093637.
crossref
29. Romero-Corral A, Somers VK, Sierra-Johnson J, Thomas RJ, Collazo-Clavell ML, Korinek J, Allison TG, Batsis JA, Sert-Kuniyoshi FH, Lopez-Jimenez F. Accuracy of body mass index in diagnosing obesity in the adult general population. Int J Obes (Lond). 2008; 32:959–966. PMID: 18283284.
crossref
30. Winter Y, Rohrmann S, Linseisen J, Lanczik O, Ringleb PA, Hebebrand J, Back T. Contribution of obesity and abdominal fat mass to risk of stroke and transient ischemic attacks. Stroke. 2008; 39:3145–3151. PMID: 18703800.
crossref
31. Ashwell M, Gunn P, Gibson S. Waist-to-height ratio is a better screening tool than waist circumference and BMI for adult cardiometabolic risk factors: systematic review and meta-analysis. Obes Rev. 2012; 13:275–286. PMID: 22106927.
crossref
32. Pouliot MC, Despres JP, Lemieux S, Moorjani S, Bouchard C, Tremblay A, Nadeau A, Lupien PJ. Waist circumference and abdominal sagittal diameter: best simple anthropometric indexes of abdominal visceral adipose tissue accumulation and related cardiovascular risk in men and women. Am J Cardiol. 1994; 73:460–468. PMID: 8141087.
crossref
33. Rimm EB, Stampfer MJ, Colditz GA, Chute CG, Litin LB, Willett WC. Validity of self-reported waist and hip circumferences in men and women. Epidemiology. 1990; 1:466–473. PMID: 2090285.
crossref
34. Nordhamn K, Sodergren E, Olsson E, Karlstrom B, Vessby B, Berglund L. Reliability of anthropometric measurements in overweight and lean subjects: consequences for correlations between anthropometric and other variables. Int J Obes Relat Metab Disord. 2000; 24:652–657. PMID: 10849590.
crossref
35. Lee CD, Blair SN, Jackson AS. Cardiorespiratory fitness, body composition, and all-cause and cardiovascular disease mortality in men. Am J Clin Nutr. 1999; 69:373–380. PMID: 10075319.
crossref
36. Seimon RV, Wild-Taylor AL, Gibson AA, Harper C, McClintock S, Fernando HA, Hsu MSH, Luz FQD, Keating SE, Johnson NA, Grieve SM, Markovic TP, Caterson ID, Byrne NM, Sainsbury A. Less waste on waist measurements: determination of optimal waist circumference measurement site to predict visceral adipose tissue in postmenopausal women with obesity. Nutrients. 2018; 10:E239. PMID: 29461494.
crossref

SUPPLEMENTARY MATERIALS

Supplementary Table 1

Baseline characteristics of participants according to baseline WC (in six levels) in different sex
dmj-43-206-s001.pdf

Supplementary Table 2

IR and multivariate-adjusted HR (95% CI) of myocardial infarction and ischemic stroke in male and female according to baseline WC (in 11 levels)
dmj-43-206-s002.pdf

Supplementary Table 3

The likelihood ratio and the continuous HR (95% CI) of myocardial infarction and ischemic stroke according to change of SD of BMI and WC
dmj-43-206-s003.pdf

Supplementary Fig. 1

Selection process of study population. ICD, International Classification of Diseases; F/U, follow-up; MI, myocardial infarction; IS, ischemic stroke; NHIS, National Health Insurance Service.
dmj-43-206-s004.pdf
Fig. 1

Multivariate-adjusted hazard ratio (95% confidence interval) of myocardial infarction and ischemic stroke in 11 waist circumference levels according to sex difference. (A) Myocardial infarction. (B) Ischemic stroke.

dmj-43-206-g001
Table 1

Baseline characteristics of participants according to baseline WC (in six levels)

dmj-43-206-i001
Characteristic WC levelsa
1 2 3 4 5 6
Number 8,386,445 5,032,969 4,162,947 2,437,161 1,101,851 627,888
Male sex 3,312,345 (39.5) 2,903,610 (57.7) 2,457,563 (59.0) 1,465,226 (60.1) 612,705 (55.6) 317,643 (50.6)
WC, cm
 Total 70.9±5.0 79.8±2.9 84.8±2.9 89.7±2.8 94.4±2.9 101.5±4.8
 Male 74.6±3.8 82.0±1.4 86.8±1.4 91.7±1.4 96.6±1.4 103.7±4.1
 Female 68.5±4.1 76.9±1.4 81.8±1.4 86.7±1.4 91.6±1.4 99.2±4.5
Age, yr 42.1±13.4 47.4±13.1 49.8±13.2 51.1±13.5 51.8±14.0 50.6±15.0
 <40 3,595,417 (42.9) 1,376,730 (27.4) 909,701 (21.9) 488,872 (20.1) 223,869 (20.3) 159,629 (25.4)
 40–64 4,235,117 (50.5) 3,117,804 (62.0) 2,652,571 (63.7) 1,520,454 (62.4) 653,583 (59.3) 340,373 (54.2)
 ≥65 555,911 (6.6) 538,435 (10.7) 600,675 (14.4) 427,835 (17.6) 224,399 (20.4) 127,886 (20.4)
BMI, kg/m2 21.05±2.06 23.52±1.89 25.01±2.01 26.52±2.16 28.11±2.37 30.78±3.20
 ≥25 227,951 (2.7) 1,033,886 (20.5) 2,056,586 (49.4) 1,875,224 (76.9) 1,008,709 (91.6) 606,915 (96.7)
Height, cm 162.4±8.3 164.3±9.1 164.5±9.5 164.9±9.8 164.6±10.3 164.7±10.7
Weight, kg 55.6±7.8 63.6±8.5 67.9±9.4 72.4±10.4 76.5±11.5 83.8±13.9
SBP, mm Hg 116.6±13.9 122.3±14.4 125.1±14.6 127.4±14.8 129.3±15.0 131.7±15.5
DBP, mm Hg 72.9±9.5 76.2±9.7 77.9±9.9 79.2±10.0 80.3±10.1 81.7±10.5
Total cholesterol, mg/dL 186.3±34.1 196.6±36.1 201.1±37.0 203.5±37.8 205.2±38.5 206.2±39.2
TG, mg/dL 99.5±74.8 135.5±103.3 155.2±118.2 170.2±129.0 178.3±133.2 183.7±136.4
HDL-C, mg/dL 60.0±18.5 55.1±19.8 53.1±20.3 51.9±20.5 51.4±20.5 51.1±20.4
LDL-C, mg/dL 108.0±45.1 116.2±43.7 119.0±43.4 119.9±44.1 120.6±44.6 120.8±44.0
Fasting glucose, mg/dL 92.1±17.7 97.0±22.2 99.9±24.6 102.5±26.7 104.7±28.6 107.7±31.9
Current smoker 1,866,304 (22.3) 1,384,875 (27.6) 1,120,939 (27.0) 659,591 (27.2) 286,356 (26.1) 164,100 (26.2)
Heavy drinker 448,312 (5.4) 420,821 (8.4) 389,861 (9.5) 255,502 (10.6) 116,501 (10.7) 65,804 (10.6)
Regular physical activity 1,337,872 (16.1) 949,536 (19.0) 781,471 (18.9) 441,790 (18.3) 188,445 (17.2) 97,524 (15.6)
Low income <20% 1,873,651 (22.3) 1,025,578 (20.4) 836,277 (20.1) 495,310 (20.3) 233,499 (21.2) 142,586 (22.7)
Hypertension 939,237 (11.2) 1,120,635 (22.3) 1,284,989 (30.9) 950,794 (39.0) 509,206 (46.2) 338,565 (53.9)
Diabetes 290,687 (3.5) 377,151 (7.5) 448,438 (10.8) 345,115 (14.2) 192,887 (17.5) 137,343 (21.9)
Dyslipidemia 779,342 (9.3) 870,873 (17.3) 945,568 (22.7) 655,070 (26.9) 335,175 (30.4) 209,085 (33.3)
COPD 366,482 (4.4) 257,681 (5.1) 243,345 (5.9) 158,786 (6.5) 78,837 (7.2) 47,397 (7.6)
Cancer 131,594 (1.6) 88,036 (1.8) 78,144 (1.9) 48,068 (2.0) 22,093 (2.0) 12,257 (2.0)

Values are presented as number (%) or mean±standard deviation. P<0.0001 for all data.

WC, waist circumference; BMI, body mass index; SBP, systolic blood pressure; DBP, diastolic blood pressure; TG, triglyceride; HDL-C, high density lipoprotein cholesterol; LDL-C, low density lipoprotein cholesterol; COPD, chronic obstructive pulmonary disease.

aWC levels, in cm: level 1 (male <80, female <75), level 2 (male 80 to 84.9, female 75 to 79.9), level 3 (male 85 to 89.9, female 80 to 84.9), level 4 (male 90 to 94.9, female 85 to 89.9), level 5 (male 95 to 99.9, female 90 to 94.9), and level 6 (male ≥100, female ≥95).

Table 2

IR and multivariate-adjusted HR (95% CI) of myocardial infarction and ischemic stroke according to baseline WC (in six levels)

dmj-43-206-i002
WC levelsa Total no. No. of events IR (per 1,000 person years) Multivariate-adjusted HR (95% CI)
Model 1 Model 2 Model 3 Model 4
Total
 Myocardial infarction
  1 8,386,445 28,938 0.639 0.767 (0.755–0.780) 0.747 (0.735–0.759) 0.851 (0.837–0.865) 0.841 (0.825–0.858)
  2 5,032,969 28,648 1.038 0.891 (0.877–0.906) 0.884 (0.870–0.899) 0.934 (0.919–0.950) 0.942 (0.926–0.958)
  3 4,162,947 30,698 1.344 1 (Ref) 1 (Ref) 1 (Ref) 1 (Ref)
  4 2,437,161 21,413 1.607 1.090 (1.071–1.109) 1.094 (1.075–1.114) 1.040 (1.021–1.058) 1.025 (1.007–1.044)
  5 1,101,851 11,028 1.842 1.208 (1.182–1.234) 1.212 (1.186–1.239) 1.098 (1.074–1.122) 1.062 (1.038–1.088)
  6 627,888 6,564 1.955 1.357 (1.321–1.393) 1.348 (1.312–1.385) 1.148 (1.117–1.179) 1.067 (1.034–1.102)
 Ischemic stroke
  1 8,386,445 41,156 0.909 0.811 (0.800–0.822) 0.795 (0.784–0.806) 0.911 (0.898–0.923) 0.883 (0.868–0.897)
  2 5,032,969 40,647 1.475 0.923 (0.910–0.935) 0.918 (0.905–0.930) 0.972 (0.958–0.985) 0.957 (0.943–0.971)
  3 4,162,947 43,360 1.902 1 (Ref) 1 (Ref) 1 (Ref) 1 (Ref)
  4 2,437,161 30,652 2.305 1.081 (1.065–1.096) 1.083 (1.067–1.099) 1.026 (1.011–1.042) 1.037 (1.021–1.053)
  5 1,101,851 16,113 2.698 1.189 (1.168–1.211) 1.188 (1.166–1.210) 1.071 (1.051–1.091) 1.086 (1.066–1.108)
  6 627,888 9,709 2.899 1.330 (1.301–1.360) 1.318 (1.289–1.347) 1.113 (1.088–1.138) 1.128 (1.099–1.157)
Male
 Myocardial infarction
1 3,312,345 17,042 0.938 0.806 (0.790–0.823) 0.766 (0.750–0.782) 0.880 (0.861–0.898) 0.870 (0.848–0.893)
2 2,903,610 18,789 1.171 0.909 (0.891–0.927) 0.895 (0.877–0.914) 0.948 (0.929–0.968) 0.959 (0.939–0.980)
3 2,457,563 19,058 1.407 1 (Ref) 1 (Ref) 1 (Ref) 1 (Ref)
4 1,465,226 12,998 1.619 1.079 (1.056–1.104) 1.088 (1.063–1.112) 1.029 (1.006–1.053) 1.011 (0.988–1.035)
5 612,705 5,960 1.790 1.190 (1.156–1.225) 1.205 (1.170–1.241) 1.083 (1.052–1.116) 1.041 (1.009–1.074)
6 317,643 3,031 1.785 1.302 (1.253–1.353) 1.312 (1.263–1.364) 1.103 (1.061–1.147) 1.011 (0.966–1.057)
 Ischemic stroke
1 3,312,345 23,618 1.301 0.860 (0.845–0.876) 0.825 (0.810–0.840) 0.953 (0.936–0.971) 0.909 (0.890–0.929)
2 2,903,610 25,017 1.561 0.945 (0.929–0.962) 0.934 (0.918–0.951) 0.991 (0.973–1.008) 0.968 (0.951–0.987)
3 2,457,563 24,792 1.833 1 (Ref) 1 (Ref) 1 (Ref) 1 (Ref)
4 1,465,226 17,096 2.132 1.069 (1.049–1.091) 1.077 (1.056–1.098) 1.017 (0.997–1.037) 1.033 (1.012–1.055)
5 612,705 7,975 2.400 1.190 (1.160–1.220) 1.197 (1.167–1.228) 1.073 (1.045–1.100) 1.096 (1.066–1.126)
6 317,643 3,980 2.347 1.287 (1.245–1.331) 1.285 (1.242–1.329) 1.072 (1.036–1.109) 1.087 (1.045–1.131)
Female
 Myocardial infarction
  1 5,074,100 11,896 0.438 0.763 (0.744–0.784) 0.757 (0.737–0.777) 0.845 (0.823–0.868) 0.833 (0.807–0.859)
  2 2,129,359 9,859 0.854 0.875 (0.852–0.899) 0.876 (0.853–0.900) 0.921 (0.897–0.947) 0.923 (0.898–0.950)
  3 1,705,384 11,640 1.253 1 (Ref) 1 (Ref) 1 (Ref) 1 (Ref)
  4 971,935 8,415 1.589 1.100 (1.069–1.131) 1.099 (1.068–1.130) 1.049 (1.020–1.079) 1.042 (1.012–1.072)
  5 489,146 5,068 1.908 1.203 (1.164–1.244) 1.202 (1.163–1.243) 1.101 (1.065–1.138) 1.079 (1.041–1.118)
  6 310,245 3,533 2.129 1.365 (1.315–1.418) 1.352 (1.302–1.404) 1.169 (1.125–1.214) 1.110 (1.061–1.160)
 Ischemic stroke
  1 5,074,100 17,538 0.647 0.760 (0.745–0.776) 0.753 (0.738–0.769) 0.850 (0.832–0.869) 0.840 (0.820–0.861)
  2 2,129,359 15,630 1.356 0.894 (0.875–0.913) 0.894 (0.875–0.913) 0.944 (0.924–0.964) 0.938 (0.917–0.959)
  3 1,705,384 18,568 2.002 1 (Ref) 1 (Ref) 1 (Ref) 1 (Ref)
  4 971,935 13,556 2.567 1.093 (1.069–1.118) 1.091 (1.067–1.116) 1.038 (1.015–1.062) 1.042 (1.018–1.066)
  5 489,146 8,138 3.073 1.179 (1.149–1.210) 1.175 (1.144–1.206) 1.067 (1.039–1.096) 1.074 (1.044–1.104)
  6 310,245 5,729 3.465 1.346 (1.307–1.387) 1.336 (1.296–1.376) 1.141 (1.107–1.175) 1.151 (1.112–1.192)

P<0.0001 for all data. Model 1 was adjusted for age and sex. Model 2 was adjusted for the variables in model 1 plus smoking, alcohol drinking, regular physical activity, and low-income status. Model 3 was adjusted for the variables in model 2 plus hypertension, diabetes, dyslipidemia, chronic obstructive pulmonary disease, and cancer. Model 4 was adjusted for the variables in model 3 plus body mass index.

IR, incidence rate; HR, hazard ratio; CI, confidence interval; WC, waist circumference.

aWC levels, in cm: level 1 (male <80, female <75), level 2 (male 80 to 84.9, female 75 to 79.9), level 3 (male 85 to 89.9, female 80 to 84.9), level 4 (male 90 to 94.9, female 85 to 89.9), level 5 (male 95 to 99.9, female 90 to 94.9), and level 6 (male ≥100, female ≥95).

Table 3

IR and multivariate-adjusted HR (95% CI) of myocardial infarction and ischemic stroke according to baseline WC (in 11 levels)

dmj-43-206-i003
WC levelsa Total no. No. of events IR (per 1,000 person years) Multivariate-adjusted HR (95% CI)
Total Total (adding BMI as a variable)
Myocardial infarction
 1 195,032 658 0.639 0.906 (0.838–0.980) 0.887 (0.815–0.965)
 2 1,068,597 2,591 0.455 0.826 (0.793–0.860) 0.833 (0.797–0.870)
 3 2,810,721 8,200 0.542 0.813 (0.793–0.833) 0.818 (0.796–0.841)
 4 4,312,095 17,489 0.746 0.871 (0.855–0.887) 0.875 (0.857–0.893)
 5 5,032,969 28,648 1.038 0.934 (0.919–0.949) 0.936 (0.921–0.952)
 6 4,162,947 30,698 1.344 1 (Ref) 1 (Ref)
 7 2,437,161 21,413 1.607 1.040 (1.022–1.058) 1.038 (1.019–1.057)
 8 1,101,851 11,028 1.842 1.098 (1.074–1.123) 1.094 (1.068–1.120)
 9 418,626 4,356 1.934 1.115 (1.080–1.152) 1.107 (1.070–1.146)
 10 140,496 1,549 2.076 1.221 (1.160–1.286) 1.212 (1.147–1.280)
 11 68,766 659 1.836 1.215 (1.124–1.313) 1.184 (1.090–1.286)
Ischemic stroke
 1 195,032 926 0.899 0.882 (0.826–0.942) 0.852 (0.794–0.914)
 2 1,068,597 3,516 0.618 0.849 (0.820–0.879) 0.808 (0.778–0.838)
 3 2,810,721 11,767 0.778 0.894 (0.875–0.912) 0.859 (0.839–0.879)
 4 4,312,095 24,947 1.065 0.929 (0.914–0.944) 0.904 (0.889–0.920)
 5 5,032,969 40,647 1.475 0.972 (0.958–0.985) 0.959 (0.945–0.972)
 6 4,162,947 43,360 1.902 1 (Ref) 1 (Ref)
 7 2,437,161 30,652 2.305 1.026 (1.011–1.042) 1.040 (1.025–1.056)
 8 1,101,851 16,113 2.698 1.071 (1.052–1.091) 1.101 (1.079–1.122)
 9 418,626 6,468 2.879 1.086 (1.058–1.115) 1.132 (1.100–1.165)
 10 140,496 2,310 3.104 1.186 (1.137–1.238) 1.258 (1.203–1.316)
 11 68,766 931 2.599 1.139 (1.067–1.216) 1.234 (1.152–1.322)

P<0.0001 for all data. Data were adjusted for age, sex, smoking, alcohol drinking, regular physical activity, low-income status, hypertension, diabetes, dyslipidemia, chronic obstructive pulmonary disease, and cancer.

IR, incidence rate; HR, hazard ratio; CI, confidence interval; WC, waist circumference; BMI, body mass index.

aWC levels, in cm: level 1 (male <65, female <60), level 2 (male 65 to 69.9, female 60 to 64.9), level 3 (male 70 to 74.9, female 65 to 69.9), level 4 (male 75 to 79.9, female 70 to 74.9), level 5 (male 80 to 84.9, female 75 to 79.9), level 6 (male 85 to 89.9, female 80 to 84.9), level 7 (male 90 to 94.9, female 85 to 89.9), level 8 (male 95 to 99.9, female 90 to 94.9), level 9 (male 100 to 104.9, female 95 to 99.9), level 10 (male 105 to 109.9, female 100 to 104.9), and level 11 (male ≥110, female ≥105).

Table 4

IR and multivariate-adjusted HR (95% CI) of myocardial infarction and ischemic stroke according to BMI (in five levels)

dmj-43-206-i004
BMI levelsa Total no. No. of events IR (per 1,000 person years) Multivariate-adjusted HR (95% CI)
Model 1 Model 2 Model 3 Model 4
Myocardial infarction
 1 928,037 4,662 0.940 1.127 (1.093–1.162) 1.072 (1.039–1.105) 1.153 (1.119–1.189) 1.215 (1.177–1.253)
 2 8,789,234 41,030 0.860 1 (Ref) 1 (Ref) 1 (Ref) 1 (Ref)
 3 5,222,719 32,305 1.128 1.110 (1.094–1.126) 1.148 (1.131–1.165) 1.063 (1.047–1.079) 0.992 (0.976–1.008)
 4 6,021,912 43,536 1.323 1.295 (1.278–1.313) 1.353 (1.335–1.372) 1.166 (1.150–1.182) 1.037 (1.019–1.057)
 5 787,359 5,756 1.373 1.711 (1.664–1.759) 1.763 (1.714–1.813) 1.355 (1.317–1.394) 1.159 (1.118–1.201)
Ischemic stroke
 1 928,037 6,491 1.310 0.916 (0.893–0.940) 0.874 (0.852–0.897) 0.953 (0.929–0.978) 0.992 (0.967–1.019)
 2 8,789,234 62,588 1.314 1 (Ref) 1 (Ref) 1 (Ref) 1 (Ref)
 3 5,222,719 46,450 1.624 1.065 (1.053–1.078) 1.096 (1.083–1.110) 1.011 (0.999–1.024) 0.958 (0.945–0.971)
 4 6,021,912 58,949 1.794 1.180 (1.167–1.193) 1.221 (1.207–1.235) 1.044 (1.032–1.056) 0.943 (0.928–0.957)
 5 787,359 7,159 1.709 1.457 (1.422–1.493) 1.483 (1.447–1.520) 1.123 (1.095–1.151) 0.955 (0.926–0.985)

P<0.0001 for all data. Model 1 was adjusted for age and sex. Model 2 was adjusted for the variables in model 1 plus smoking, alcohol drinking, regular physical activity, and low-income status. Model 3 was adjusted for the variables in model 2 plus hypertension, diabetes, dyslipidemia, chronic obstructive pulmonary disease, and cancer. Model 4 was adjusted for the variables in model 3 plus waist circumference.

IR, incidence rate; HR, hazard ratio; CI, confidence interval; BMI, body mass index.

aBMI levels, in kg/m2: level 1 (<18.5), level 2 (18.5 to 22.9), level 3 (23.0 to 24.9), level 4 (25.0 to 29.9), and level 5 (≥30.0).

Table 5

Optimal cutoffs of waist circumference for myocardial infarction and ischemic stroke in different sex

dmj-43-206-i005
Outcome Sex WC cutoff, cm Sensitivity Specificity Youden's index Area under the curve
Myocardial infarction Male 84 0.588 0.509 1.097 0.563
Female 78 0.649 0.603 1.251 0.667
Ischemic stroke Male 85 0.525 0.562 1.088 0.558
Female 78 0.663 0.603 1.267 0.677

WC, waist circumference.

TOOLS
Similar articles