Journal List > Diabetes Metab J > v.43(1) > 1142338

Kim, Hwang, Chung, Kim, Seo, Kim, Kim, Choi, Baik, and Yoo: Proportion and Characteristics of the Subjects with Low Muscle Mass and Abdominal Obesity among the Newly Diagnosed and Drug-Naïve Type 2 Diabetes Mellitus Patients

Abstract

Background

Sarcopenic obesity (SO) is a serious public health concern, few studies have examined the clinical implications of SO in newly-diagnosed type 2 diabetes mellitus (T2DM) patients. We evaluated the prevalence of the newly diagnosed, drug-naïve T2DM patients with low muscle mass with abdominal obesity and its association with insulin resistance and other diabetic complications.

Methods

We classified 233 drug-naïve T2DM subjects into four groups according to abdominal obesity (waist circumference ≥90 cm in men and ≥85 cm in women) and low muscle mass status (appendicular skeletal muscle <7.0 kg/m2 for men and <5.4 kg/m2 for women).

Results

The proportion of the subjects with low muscle mass and abdominal obesity among the newly diagnosed, drug-naïve T2DM patients was 8.2%. Homeostasis model assessment of insulin resistance (HOMA-IR) increased linearly according to body composition group from normal to abdominal obesity to both low muscle mass and abdominal obesity. The multiple logistic regression analysis indicated that subjects with low muscle mass and abdominal obesity (odds ratio [OR], 9.39; 95% confidence interval [CI], 2.41 to 36.56) showed a higher risk for insulin resistance, defined as HOMA-IR ≥3, than those with abdominal obesity (OR, 5.36; 95% CI, 2.46 to 11.69), even after adjusting for other covariates. However, there were no differences in lipid profiles, microalbuminuria, or various surrogate markers for atherosclerosis among the four groups.

Conclusion

Subjects with both low muscle mass and abdominal obesity had a higher risk of insulin resistance than those with low muscle mass or abdominal obesity only.

INTRODUCTION

In an aging society, the prevalence of type 2 diabetes mellitus (T2DM) and sarcopenia is rapidly growing. Sarcopenia is defined as the degenerative reduction of skeletal muscle mass and strength with aging [1]. The progressive decrease in muscle mass occurs at a rate of 1.5% to 3% per year after the age of 60 years, with muscle mass decreased by about half in individuals in their 80s [2]. As muscle is the main organ of glucose disposal [3], reduced muscle mass leads to increased insulin resistance. Conversely, insulin resistance or T2DM itself is associated with accelerating loss of skeletal muscle [45], causing a bidirectional positive feedback loop between metabolic disorders and sarcopenia.
Along with sarcopenia, recent growing evidence has reinforced the crucial role of sarcopenic obesity (SO) in metabolic disorders. Obesity and sarcopenia are strongly related pathogenetically. Accumulated visceral fat produces inflammatory cytokines, which influence muscle wasting via catabolic effects [6]. Moreover, decreased muscle mass reduces total energy expenditure and aggravates visceral obesity. As a result, the combination of obesity and sarcopenia might cause cardiometabolic disturbances more rapidly than does obesity or sarcopenia alone. Kwon et al. [7] recently showed that obese men with sarcopenia exhibited a significantly higher risk of insulin resistance than did obese men without sarcopenia. We also reported that women with SO had three times the risk of metabolic syndrome, whereas subjects with obesity only had twice the risk of metabolic syndrome, compared to normal subjects [8]. However, there has been no research on the association of SO with insulin resistance or diabetic complications such as atherosclerosis and microalbuminuria in newly diagnosed, drug-naïve T2DM patients. Furthermore, although in our previous Korean Sarcopenic Obesity Study (KSOS), patients with T2DM had three times greater risk of sarcopenia than subjects without diabetes after adjusting for other covariates [9], the prevalence of SO in newly-diagnosed, Asian, T2DM patients has not been reported.
Therefore, to clarify the prevalence and clinical influences of SO in newly diagnosed T2DM patients, we classified patients from the Korea Guro Diabetes Program (KGDP) Cohort study into four groups based on body composition: (1) subjects with normal body composition, (2) subjects with low muscle mass only, (3) subjects with abdominal obesity only, and (4) subjects with both low muscle mass and abdominal obesity. Next, we compared clinical parameters among the four groups, including lipid profiles, insulin resistance, microalbuminuria, and surrogate markers for atherosclerosis such as carotid intima media thickness (CIMT) and brachial-ankle pulse wave velocity (baPWV).

METHODS

Study design and participants

We analyzed baseline cross-sectional data of 233 subjects from the KGDP study, which is an ongoing prospective observational cohort study that started in September 2014, with the purpose of clarifying the risk factors of diabetes-related complications. The KGDP cohort enrolled drug-naïve patients with T2DM or metformin-only users. In this cohort, T2DM patients were defined as those with a previous diagnosis by a physician or glycosylated hemoglobin (HbA1c) ≥6.5%. We collected all the data from the initial work-up for diabetes and diabetes-related complications. Through June 30, 2017, the KGDP cohort had enrolled a total of 269 patients with T2DM. After excluding metformin users (n=36) from this study, we analyzed the data of 233 patients with drug-naïve T2DM, and all the subjects were subdivided into four groups according to abdominal obesity or low muscle mass. Medical histories and lifestyle information were collected for all subjects by personal interview using a detailed questionnaire. All participants provided written informed consent, and the Korea University Institutional Review Board approved this study protocol in accordance with the World Medical Association Declaration of Helsinki (2014GR0140).

Anthropometric and laboratory measurements

BMI was calculated as weight/height2 (kg/m2), and waist circumference was measured at the midpoint between the lower edge of the rib cage and the iliac crest. All blood samples were obtained in the morning after a 12-hour overnight fast and were immediately stored at −80℃ for subsequent assays. Serum triglyceride and high density lipoprotein cholesterol (HDL-C) levels were determined enzymatically using a model 747 chemistry analyzer (Hitachi, Tokyo, Japan). The glucose oxidase method was used to measure plasma glucose level, and an electrochemiluminescence immunoassay (Roche Diagnostics, Indianapolis, IN, USA) was used to measure insulin level. Insulin resistance was calculated by homeostasis model assessment (HOMA) [10]. HbA1c level was measured using high performance liquid chromatography on a Bio-Rad Variant II instrument (Bio-Rad, Hercules, CA, USA). Urinary albumin and creatinine levels were used to calculate the urine albumin to creatinine ratio, the preferred indicator for albuminuria. Latex-enhanced turbidimetric immunoassay (HiSens hs-CRP LTIA; HBI, Anyang, Korea) was used for measurement of high-sensitivity C-reactive protein (hs-CRP) with an interassay coefficient of variation (CV) of 7.2%.

Definitions of abdominal obesity and low muscle mass

A whole body dual energy X-ray absorptiometry scan was performed for each patient to measure total and regional lean mass (kg) using fan-beam technology (Hologic Discovery A; Hologic, Bedford, MA, USA). Appendicular skeletal muscle mass (ASM, kg) was defined as the sum of the lean soft tissue masses for the arms and legs, according to the method of Heymsfield et al. [11]. In this study, low muscle mass was defined as ASM/height2 of 2 standard deviation (SD) below the sex-specific mean value of young reference group [12]. We used 7.0 kg/m2 for men and 5.4 kg/m2 for women as the cutoff points for low muscle mass, as suggested in the consensus report of the Asian Working Group for Sarcopenia (AWGS) [13]. Abdominal obesity was defined as waist circumference ≥90 cm in men and ≥85 cm in women [14]. Using these criteria, subjects were classified into four groups: subjects without low muscle mass and abdominal obesity, with low muscle mass only, with abdominal obesity only, and with both low muscle mass and abdominal obesity.

Carotid intima-media thickness

The CIMT was determined using high-resolution B-mode ultrasonography (EnVisor; Philips Healthcare, Andover, MA, USA) with a 5- to 12-MHz transducer and Intimascope measurement software (Media Cross Co., Tokyo, Japan) at three levels of the lateral and medial walls, 1 to 3 cm proximal to the carotid bifurcation. The mean CIMT was calculated as the average value of 99 computer-based points in the region, and the maximum CIMT was defined as the intima-media thickness at the maximal point in the region. The intraobserver CV of CIMT was 0.93. In this study, carotid atherosclerosis was defined as mean CIMT >0.9 mm or the existence of carotid plaque, consistent with the 2013 European Society of Hypertension (ESH) and the European Society of Cardiology (ESC) guidelines for the management of arterial hypertension [15].

Brachial-ankle pulse wave velocity

After the subject had rested in the supine position for 5 minutes, the baPWV was measured using a BP-203RPE II volume-plethysmographic apparatus (Colin, Komaki, Japan), which simultaneously records baPWV and brachial and ankle blood pressure on the left and right sides. The baPWV was calculated as the mean of the left and right baPWV values. Details of this method, including validity and reproducibility, have been described in previous reports [1617].

Statistical analyses

Each variable was assessed for a normal distribution. Data are expressed as mean±SD or median (interquartile range [25% to 75%]). Differences among the groups were tested using one-way analysis of variance (ANOVA) for normally distributed variables, and subsequent comparisons were performed by the Tukey multiple comparison test. Differences among the groups were tested using the Kruskal-Wallis H test for non-normally distributed variables, and subsequent comparisons were performed by the Dwass, Steel, Critchlow-Fligner (DSCF) multiple comparison test. Categorical variables were analyzed with the chi-square test or Fisher's exact test. The odds ratio (OR) and 95% confidence interval (CI) for the prediction of homeostasis model assessment of insulin resistance (HOMA-IR) ≥3 based on body composition were obtained from logistic regression models after controlling for potential covariates including age, gender, smoking status, alcohol status, physical activity, and HDL-C, triglyceride, aspartate aminotransferase (AST), alanine aminotransferase (ALT), and medication history including statin, antiplatelet, and antihypertensive agents. We used analysis of covariance (ANCOVA) adjusted for age, gender, smoking status, alcohol status, physical activity, and HDL-C, triglyceride, AST, ALT, and medication history including statin, antiplatelet, and antihypertensive agents to compare HOMA-IR values between four groups. All statistical results were based on two-sided tests. Significant independent variables were chosen using the stepwise selection method and were analyzed using SAS version 9.3 (SAS Institute, Cary, NC, USA). P values <0.05 were considered statistically significant.

RESULTS

Baseline characteristics

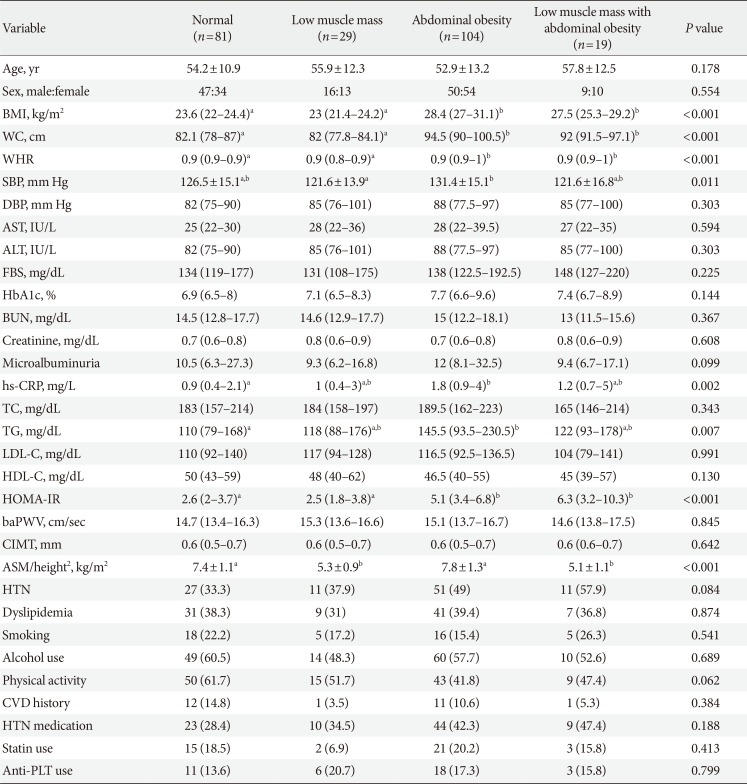
Out of the 233 subjects, the numbers classified in the normal body composition, low muscle mass, abdominal obesity, and low muscle mass with abdominal obesity (LMAO) subgroups were 81, 29, 104, and 19, respectively. The percentages of patients in the low muscle mass, abdominal obesity, and LMAO subgroups were 13.1%, 41.0%, and 7.4% in men, respectively, and 11.7%, 48.6%, and 9% in women (Fig. 1). The baseline characteristics of all study subjects are presented in Table 1. At the first diagnosis of T2DM, there were no significant differences in fasting blood glucose and HbA1c levels according to the body composition groups. Subjects with abdominal obesity had significantly higher serum hs-CRP and triglyceride levels than those with normal body composition, but there was no significant difference between the abdominal obesity only and LMAO groups.

Insulin resistance, microalbuminuria, and atherosclerosis

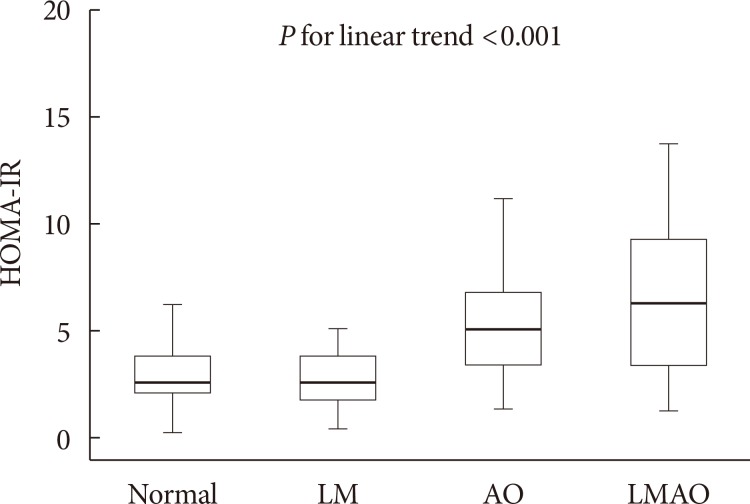
The values of the albumin to creatinine ratio and surrogate markers for atherosclerosis such as CIMT and baPWV did not differ significantly in the four groups (Table 1). However, insulin resistance measured by HOMA-IR was significantly higher in the subjects with abdominal obesity only or LMAO than in those with normal body composition or low muscle mass (Table 1). HOMA-IR increased linearly according to body composition from normal to abdominal obesity to LMAO, even after adjusting for age, gender, smoking status, alcohol status, physical activity, and HDL-C, triglyceride, AST, ALT, and medication history including statin, antiplatelet, and antihypertensive agents (Fig. 2).

Multiple logistic regression analysis for insulin resistance

The multiple logistic regression analysis for insulin resistance (defined as HOMA-IR ≥3) indicated that subjects with LMAO had a higher risk for insulin resistance (OR, 9.39; 95% CI, 2.41 to 36.56) rather than those with abdominal obesity only abdominal obesity only (OR, 5.36; 95% CI, 2.46 to 11.69) even after adjusting for age, gender, smoking, alcohol, and physical activity history and serum HDL-cholesterol, triglyceride, AST, ALT, and medication history including statin, antiplatelet, and antihypertensive agents (Table 2). There was a significant linear-increase trend in the risk for HOMA-IR ≥3 according to body composition, from normal body composition to low muscle mass to abdominal obesity to LMAO, after adjusting for other covariates (P for trend <0.001).

DISCUSSION

This study documented for the first time the prevalence of low muscle mass and LMAO among newly-diagnosed, drug-naïve T2DM patients in Korea; 12.4% of patients had low muscle mass and 8.2% had LMAO (men 7.4% vs. women 9.0%). Although there were no significant differences in the progression of atherosclerosis and microalbuminuria between the LMAO group and the other groups, subjects with LMAO exhibited a higher risk for insulin resistance, defined as HOMA-IR ≥3, than subjects in the low muscle mass or abdominal obesity only groups.
T2DM is an important risk factor for the development of sarcopenia or SO. Park et al. [18] reported that mid-thigh muscle cross-sectional area declined two times faster in older women with diabetes than in their non-diabetic counterparts. In a cross-sectional study with 1,090 community-dwelling Chinese citizens aged 60 years and older, subjects with T2DM exhibited significantly increased risks of sarcopenia compared to non-diabetic individuals, even after adjusting for other covariates (OR, 1.37; 95% CI, 1.02 to 2.03) [19]. Persistent hyperglycemia increases the production of advanced glycation end products that accumulate in the muscle, causing reduced muscle function [20], and increased inflammatory cytokines in subjects with T2DM aggravate muscle loss [21]. We previously reported that the prevalence of sarcopenia using low muscle mass in patients with diabetes was 15.7%, compared to 6.9% in the control group [9]. However, there has been no study of the prevalence of SO in newly diagnosed and drug naive T2DM patients. In this study, the prevalence of LMAO among newly diagnosed, drug-naïve T2DM patients was 7.4% in men and 9.0% in women. This prevalence was higher than that of other studies that included the non-diabetic population, although the average age of our study subjects was relatively young (men 52.4 years and women 56.0 years). Hwang et al. [22] demonstrated that the prevalence of SO was 6.1% in men and 7.3% in women using 2,221 Koreans over 60 years of age from the Fourth Korea National Health and Nutrition Examination Survey. In community-dwelling, elderly German men (age ≥70), the prevalence of SO ranged from 2.1% to 4.1% depending on the definition used [23]. Therefore, early assessment of muscle quantity in subjects with newly diagnosed T2DM might be important irrespective of age.
A vicious cycle between loss of muscle and accumulation of visceral fat might be associated with the increased risk of cardiometabolic diseases (CVDs) in SO individuals [24]. Honda et al. [25] reported that SO was associated with inflammation and increased mortality in patients with end-stage renal disease. In a prospective study of 3,366 older men and women who were free of CVD at baseline, CVD risk increased by 23% in the SO group during the 8-year follow-up after adjusting for other risk factors, but did not increase in the sarcopenic or obesity only groups. Visceral adipose tissue produces several adipocytokines, such as leptin and tumor necrosis factor-α, and inflammatory cytokines, which increase insulin resistance. Inflammatory cytokines originating from visceral fat aggravate muscle wasting, which in turn causes abdominal obesity, creating a metabolic viscous cycle in SO patients. Because of the enrollment of subjects with newly-diagnosed T2DM who were at the initial stage of diabetic complications, the present study showed no significant differences in albuminuria, CIMT, and baPWV values between LMAO patients and the remaining groups. To clarify the effects of LMAO on diabetic complications such as albuminuria and atherosclerosis, a prospective long-term follow-up study using a large-scale newly diagnosed drug naïve T2DM cohort should be completed.
The HOMA model is a powerful tool in descriptions of the pathophysiology of diabetes [26]. Homeostasis of hepatic glucose output and insulin secretion is reflected by the relationship between basal glucose and insulin [27]. In the present study, the LMAO group exhibited the highest risk for development of insulin resistance even after adjusting for other risk factors. Although we could not confirm the causality between LMAO and insulin resistance due to the limitations of a cross-sectional study, they appear to be intimately related. Recently, Moon [28] reported that sarcopenia is associated with insulin resistance, diabetes, and metabolic syndrome in the non-obese Korean elderly population. Skeletal muscle is the primary organ of insulin-mediated glucose metabolism; thus, the loss of skeletal muscle is the major factor in provoking insulin resistance. Furthermore, insulin resistance itself can accelerate skeletal muscle protein breakdown [29]. Insulin stimulates muscle protein synthesis through its ability to activate the mammalian target of rapamycin complex 1 (mTORC1) [30] and suppresses the transcription of atrophy-related genes (atrogins), thereby preventing skeletal muscle atrophy [31]. Therefore, although abdominal obesity is a fundamental risk factor for development of insulin resistance, sarcopenia can aggravate its progress.
There were some limitations in the present study. First, we could not consider muscle function when defining sarcopenia. After the muscle mass begins to decrease, which occurs usually after 50 years, physical strength and ability of performance declines consecutively [32]. Thus, we utilized only the quantity of muscle mass for the definition of sarcopenia without considering of muscle function, due to the relative young-age of our study subjects. Furthermore, there were several previous studies defining sarcopenia based on the low muscle mass alone before the consensus report of the AWGS [789222833]. Nevertheless, in the present study we used the term low muscle mass instead of sarcopenia for the accurate definition and identified for the first time the proportion of T2DM subjects with a deficiency of muscle mass using the formal criteria suggested by the AWGS in Korea [13]. Second, this study recruited only Asian men and women. Asian populations are more prone to abdominal obesity and low skeletal muscle mass with increased insulin resistance compared with their Western counterparts [34]. Therefore, a large-scaled study with other ethnic population should be followed. Third, we could not get the data about the weight change at the time of enrollment, but there were no participants with other severe illness exhibiting weight loss. Lastly, due to the inherent limitations of a cross-sectional study, it was not possible to assess a causal relationship of LMAO with metabolic disturbances including insulin resistance and diabetic complications. We are currently building upon the second-wave follow-up data of this cohort and planning the prospective study about the relationship between baseline LMAO and the progression of metabolic disturbances in the newly diagnosed, drug-naïve T2DM.
In conclusion, about 8.2% of the subjects in the KGDP cohort with newly diagnosed, drug-naïve T2DM (men 7.4% vs. women 9.0%) exhibited the body composition with LMAO. Insulin resistance increased linearly according to body composition from normal to low muscle mass to abdominal obesity to LMAO; individuals with LMAO exhibited the highest risk for insulin resistance.

Notes

CONFLICTS OF INTEREST: No potential conflict of interest relevant to this article was reported.

References

1. Cruz-Jentoft AJ, Baeyens JP, Bauer JM, Boirie Y, Cederholm T, Landi F, Martin FC, Michel JP, Rolland Y, Schneider SM, Topinková E, Vandewoude M, Zamboni M. European Working Group on Sarcopenia in Older People. Sarcopenia: European consensus on definition and diagnosis: report of the European Working Group on Sarcopenia in Older People. Age Ageing. 2010; 39:412–423. PMID: 20392703.
crossref
2. Hughes VA, Frontera WR, Roubenoff R, Evans WJ, Singh MA. Longitudinal changes in body composition in older men and women: role of body weight change and physical activity. Am J Clin Nutr. 2002; 76:473–481. PMID: 12145025.
crossref
3. Klip A, Paquet MR. Glucose transport and glucose transporters in muscle and their metabolic regulation. Diabetes Care. 1990; 13:228–243. PMID: 2407478.
crossref
4. Lee CG, Boyko EJ, Strotmeyer ES, Lewis CE, Cawthon PM, Hoffman AR, Everson-Rose SA, Barrett-Connor E, Orwoll ES. Osteoporotic Fractures in Men Study Research Group. Association between insulin resistance and lean mass loss and fat mass gain in older men without diabetes mellitus. J Am Geriatr Soc. 2011; 59:1217–1224. PMID: 21718263.
crossref
5. Kalyani RR, Corriere M, Ferrucci L. Age-related and disease-related muscle loss: the effect of diabetes, obesity, and other diseases. Lancet Diabetes Endocrinol. 2014; 2:819–829. PMID: 24731660.
crossref
6. Cesari M, Penninx BW, Pahor M, Lauretani F, Corsi AM, Rhys Williams G, Guralnik JM, Ferrucci L. Inflammatory markers and physical performance in older persons: the InCHIANTI study. J Gerontol A Biol Sci Med Sci. 2004; 59:242–248. PMID: 15031308.
crossref
7. Kwon SS, Lee SG, Lee YH, Lim JB, Kim JH. Homeostasis model assessment of insulin resistance in a general adult population in Korea: additive association of sarcopenia and obesity with insulin resistance. Clin Endocrinol (Oxf). 2017; 86:44–51. PMID: 27623436.
crossref
8. Kim TN, Yang SJ, Yoo HJ, Lim KI, Kang HJ, Song W, Seo JA, Kim SG, Kim NH, Baik SH, Choi DS, Choi KM. Prevalence of sarcopenia and sarcopenic obesity in Korean adults: the Korean Sarcopenic Obesity Study. Int J Obes (Lond). 2009; 33:885–892. PMID: 19564878.
crossref
9. Kim TN, Park MS, Yang SJ, Yoo HJ, Kang HJ, Song W, Seo JA, Kim SG, Kim NH, Baik SH, Choi DS, Choi KM. Prevalence and determinant factors of sarcopenia in patients with type 2 diabetes: the Korean Sarcopenic Obesity Study (KSOS). Diabetes Care. 2010; 33:1497–1499. PMID: 20413515.
crossref
10. Matthews DR, Hosker JP, Rudenski AS, Naylor BA, Treacher DF, Turner RC. Homeostasis model assessment: insulin resistance and beta-cell function from fasting plasma glucose and insulin concentrations in man. Diabetologia. 1985; 28:412–419. PMID: 3899825.
11. Heymsfield SB, Smith R, Aulet M, Bensen B, Lichtman S, Wang J, Pierson RN Jr. Appendicular skeletal muscle mass: measurement by dual-photon absorptiometry. Am J Clin Nutr. 1990; 52:214–218. PMID: 2375286.
crossref
12. Baumgartner RN. Body composition in healthy aging. Ann N Y Acad Sci. 2000; 904:437–448. PMID: 10865787.
crossref
13. Chen LK, Liu LK, Woo J, Assantachai P, Auyeung TW, Bahyah KS, Chou MY, Chen LY, Hsu PS, Krairit O, Lee JS, Lee WJ, Lee Y, Liang CK, Limpawattana P, Lin CS, Peng LN, Satake S, Suzuki T, Won CW, Wu CH, Wu SN, Zhang T, Zeng P, Akishita M, Arai H. Sarcopenia in Asia: consensus report of the Asian Working Group for Sarcopenia. J Am Med Dir Assoc. 2014; 15:95–101. PMID: 24461239.
crossref
14. Lee S, Park HS, Kim SM, Kwon HS, Kim DY, Kim DJ, Cho GJ, Han JH, Kim SR, Park CY, Oh SJ, Lee CB, Kim KS, Oh SW, Kim YS, Choi WH, Yoo HJ. Cut-off points of waist circumference for defining abdominal obesity in the Korean population. Korean J Obes. 2006; 15:1–9.
15. Mancia G, Fagard R, Narkiewicz K, Redon J, Zanchetti A, Bohm M, Christiaens T, Cifkova R, De Backer G, Dominiczak A, Galderisi M, Grobbee DE, Jaarsma T, Kirchhof P, Kjeldsen SE, Laurent S, Manolis AJ, Nilsson PM, Ruilope LM, Schmieder RE, Sirnes PA, Sleight P, Viigimaa M, Waeber B, Zannad F, Redon J, Dominiczak A, Narkiewicz K, Nilsson PM, Burnier M, Viigimaa M, Ambrosioni E, Caufield M, Coca A, Olsen MH, Schmieder RE, Tsioufis C, van de Borne P, Zamorano JL, Achenbach S, Baumgartner H, Bax JJ, Bueno H, Dean V, Deaton C, Erol C, Fagard R, Ferrari R, Hasdai D, Hoes AW, Kirchhof P, Knuuti J, Kolh P, Lancellotti P, Linhart A, Nihoyannopoulos P, Piepoli MF, Ponikowski P, Sirnes PA, Tamargo JL, Tendera M, Torbicki A, Wijns W, Windecker S, Clement DL, Coca A, Gillebert TC, Tendera M, Rosei EA, Ambrosioni E, Anker SD, Bauersachs J, Hitij JB, Caulfield M, De Buyzere M, De Geest S, Derumeaux GA, Erdine S, Farsang C, Funck-Brentano C, Gerc V, Germano G, Gielen S, Haller H, Hoes AW, Jordan J, Kahan T, Komajda M, Lovic D, Mahrholdt H, Olsen MH, Ostergren J, Parati G, Perk J, Polonia J, Popescu BA, Reiner Z, Ryden L, Sirenko Y, Stanton A, Struijker-Boudier H, Tsioufis C, van de Borne P, Vlachopoulos C, Volpe M, Wood DA. 2013 ESH/ESC guidelines for the management of arterial hypertension: the task force for the management of arterial hypertension of the European Society of Hypertension (ESH) and of the European Society of Cardiology (ESC). Eur Heart J. 2013; 34:2159–2219. PMID: 23771844.
16. Choi KM, Lee KW, Seo JA, Oh JH, Kim SG, Kim NH, Choi DS, Baik SH. Relationship between brachial-ankle pulse wave velocity and cardiovascular risk factors of the metabolic syndrome. Diabetes Res Clin Pract. 2004; 66:57–61. PMID: 15364162.
crossref
17. Yamashina A, Tomiyama H, Takeda K, Tsuda H, Arai T, Hirose K, Koji Y, Hori S, Yamamoto Y. Validity, reproducibility, and clinical significance of noninvasive brachial-ankle pulse wave velocity measurement. Hypertens Res. 2002; 25:359–364. PMID: 12135313.
crossref
18. Park SW, Goodpaster BH, Lee JS, Kuller LH, Boudreau R, de Rekeneire N, Harris TB, Kritchevsky S, Tylavsky FA, Nevitt M, Cho YW, Newman AB. Health, Aging, and Body Composition Study. Excessive loss of skeletal muscle mass in older adults with type 2 diabetes. Diabetes Care. 2009; 32:1993–1997. PMID: 19549734.
crossref
19. Wang T, Feng X, Zhou J, Gong H, Xia S, Wei Q, Hu X, Tao R, Li L, Qian F, Yu L. Type 2 diabetes mellitus is associated with increased risks of sarcopenia and pre-sarcopenia in Chinese elderly. Sci Rep. 2016; 6:38937. PMID: 27958337.
crossref
20. Semba RD, Bandinelli S, Sun K, Guralnik JM, Ferrucci L. Relationship of an advanced glycation end product, plasma carboxymethyl-lysine, with slow walking speed in older adults: the InCHIANTI study. Eur J Appl Physiol. 2010; 108:191–195. PMID: 19756703.
crossref
21. Cesari M, Kritchevsky SB, Baumgartner RN, Atkinson HH, Penninx BW, Lenchik L, Palla SL, Ambrosius WT, Tracy RP, Pahor M. Sarcopenia, obesity, and inflammation: results from the Trial of Angiotensin Converting Enzyme Inhibition and Novel Cardiovascular Risk Factors study. Am J Clin Nutr. 2005; 82:428–434. PMID: 16087989.
22. Hwang B, Lim JY, Lee J, Choi NK, Ahn YO, Park BJ. Prevalence rate and associated factors of sarcopenic obesity in Korean elderly population. J Korean Med Sci. 2012; 27:748–755. PMID: 22787369.
crossref
23. Kemmler W, Teschler M, Weibenfels A, Sieber C, Freiberger E, von Stengel S. Prevalence of sarcopenia and sarcopenic obesity in older German men using recognized definitions: high accordance but low overlap. Osteoporos Int. 2017; 28:1881–1891. PMID: 28220197.
crossref
24. Kim TN, Choi KM. The implications of sarcopenia and sarcopenic obesity on cardiometabolic disease. J Cell Biochem. 2015; 116:1171–1178. PMID: 25545054.
crossref
25. Honda H, Qureshi AR, Axelsson J, Heimburger O, Suliman ME, Barany P, Stenvinkel P, Lindholm B. Obese sarcopenia in patients with end-stage renal disease is associated with inflammation and increased mortality. Am J Clin Nutr. 2007; 86:633–638. PMID: 17823427.
crossref
26. Wallace TM, Levy JC, Matthews DR. Use and abuse of HOMA modeling. Diabetes Care. 2004; 27:1487–1495. PMID: 15161807.
crossref
27. Turner RC, Holman RR, Matthews D, Hockaday TD, Peto J. Insulin deficiency and insulin resistance interaction in diabetes: estimation of their relative contribution by feedback analysis from basal plasma insulin and glucose concentrations. Metabolism. 1979; 28:1086–1096. PMID: 386029.
crossref
28. Moon SS. Low skeletal muscle mass is associated with insulin resistance, diabetes, and metabolic syndrome in the Korean population: the Korea National Health and Nutrition Examination Survey (KNHANES) 2009–2010. Endocr J. 2014; 61:61–70. PMID: 24088600.
crossref
29. Wang X, Hu Z, Hu J, Du J, Mitch WE. Insulin resistance accelerates muscle protein degradation: activation of the ubiquitin-proteasome pathway by defects in muscle cell signaling. Endocrinology. 2006; 147:4160–4168. PMID: 16777975.
crossref
30. Timmerman KL, Lee JL, Dreyer HC, Dhanani S, Glynn EL, Fry CS, Drummond MJ, Sheffield-Moore M, Rasmussen BB, Volpi E. Insulin stimulates human skeletal muscle protein synthesis via an indirect mechanism involving endothelial-dependent vasodilation and mammalian target of rapamycin complex 1 signaling. J Clin Endocrinol Metab. 2010; 95:3848–3857. PMID: 20484484.
crossref
31. Sandri M, Sandri C, Gilbert A, Skurk C, Calabria E, Picard A, Walsh K, Schiaffino S, Lecker SH, Goldberg AL. Foxo transcription factors induce the atrophy-related ubiquitin ligase atrogin-1 and cause skeletal muscle atrophy. Cell. 2004; 117:399–412. PMID: 15109499.
crossref
32. Lexell J, Taylor CC, Sjostrom M. What is the cause of the ageing atrophy? Total number, size and proportion of different fiber types studied in whole vastus lateralis muscle from 15- to 83-year-old men. J Neurol Sci. 1988; 84:275–294. PMID: 3379447.
33. Lim S, Kim JH, Yoon JW, Kang SM, Choi SH, Park YJ, Kim KW, Lim JY, Park KS, Jang HC. Sarcopenic obesity: prevalence and association with metabolic syndrome in the Korean Longitudinal Study on Health and Aging (KLoSHA). Diabetes Care. 2010; 33:1652–1654. PMID: 20460442.
crossref
34. Chan JC, Malik V, Jia W, Kadowaki T, Yajnik CS, Yoon KH, Hu FB. Diabetes in Asia: epidemiology, risk factors, and pathophysiology. JAMA. 2009; 301:2129–2140. PMID: 19470990.
Fig. 1

Proportion of newly-diagnosed and drug-naïve type 2 diabetes mellitus subjects in normal body composition, low muscle mass (LM), abdominal obesity (AO), and low muscle mass with obesity (LMAO) groups. (A) All subjects, (B) men, and (C) women.

dmj-43-105-g001
Fig. 2

Homeostasis model assessment of insulin resistance (HOMA-IR) values by body composition group (normal, low muscle mass [LM], abdominal obesity [AO], and low muscle mass with obesity [LMAO]). P value for linear trend was calculated using analysis of covariance (ANCOVA) adjusted for age, gender, smoking status, alcohol status, physical activity, and high density lipoprotein cholesterol, triglyceride, aspartate aminotransferase, alanine aminotransferase and medication history including statin, antiplatelet, and antihypertensive agents.

dmj-43-105-g002
Table 1

Metabolic characteristics of study subjects by body composition group

dmj-43-105-i001
Variable Normal (n=81) Low muscle mass (n=29) Abdominal obesity (n=104) Low muscle mass with abdominal obesity (n=19) P value
Age, yr 54.2±10.9 55.9±12.3 52.9±13.2 57.8±12.5 0.178
Sex, male:female 47:34 16:13 50:54 9:10 0.554
BMI, kg/m2 23.6 (22–24.4)a 23 (21.4–24.2)a 28.4 (27–31.1)b 27.5 (25.3–29.2)b <0.001
WC, cm 82.1 (78–87)a 82 (77.8–84.1)a 94.5 (90–100.5)b 92 (91.5–97.1)b <0.001
WHR 0.9 (0.9–0.9)a 0.9 (0.8–0.9)a 0.9 (0.9–1)b 0.9 (0.9–1)b <0.001
SBP, mm Hg 126.5±15.1a,b 121.6±13.9a 131.4±15.1b 121.6±16.8a,b 0.011
DBP, mm Hg 82 (75–90) 85 (76–101) 88 (77.5–97) 85 (77–100) 0.303
AST, IU/L 25 (22–30) 28 (22–36) 28 (22–39.5) 27 (22–35) 0.594
ALT, IU/L 82 (75–90) 85 (76–101) 88 (77.5–97) 85 (77–100) 0.303
FBS, mg/dL 134 (119–177) 131 (108–175) 138 (122.5–192.5) 148 (127–220) 0.225
HbA1c, % 6.9 (6.5–8) 7.1 (6.5–8.3) 7.7 (6.6–9.6) 7.4 (6.7–8.9) 0.144
BUN, mg/dL 14.5 (12.8–17.7) 14.6 (12.9–17.7) 15 (12.2–18.1) 13 (11.5–15.6) 0.367
Creatinine, mg/dL 0.7 (0.6–0.8) 0.8 (0.6–0.9) 0.7 (0.6–0.8) 0.8 (0.6–0.9) 0.608
Microalbuminuria 10.5 (6.3–27.3) 9.3 (6.2–16.8) 12 (8.1–32.5) 9.4 (6.7–17.1) 0.099
hs-CRP, mg/L 0.9 (0.4–2.1)a 1 (0.4–3)a,b 1.8 (0.9–4)b 1.2 (0.7–5)a,b 0.002
TC, mg/dL 183 (157–214) 184 (158–197) 189.5 (162–223) 165 (146–214) 0.343
TG, mg/dL 110 (79–168)a 118 (88–176)a,b 145.5 (93.5–230.5)b 122 (93–178)a,b 0.007
LDL-C, mg/dL 110 (92–140) 117 (94–128) 116.5 (92.5–136.5) 104 (79–141) 0.991
HDL-C, mg/dL 50 (43–59) 48 (40–62) 46.5 (40–55) 45 (39–57) 0.130
HOMA-IR 2.6 (2–3.7)a 2.5 (1.8–3.8)a 5.1 (3.4–6.8)b 6.3 (3.2–10.3)b <0.001
baPWV, cm/sec 14.7 (13.4–16.3) 15.3 (13.6–16.6) 15.1 (13.7–16.7) 14.6 (13.8–17.5) 0.845
CIMT, mm 0.6 (0.5–0.7) 0.6 (0.5–0.7) 0.6 (0.5–0.7) 0.6 (0.6–0.7) 0.642
ASM/height2, kg/m2 7.4±1.1a 5.3±0.9b 7.8±1.3a 5.1±1.1b <0.001
HTN 27 (33.3) 11 (37.9) 51 (49) 11 (57.9) 0.084
Dyslipidemia 31 (38.3) 9 (31) 41 (39.4) 7 (36.8) 0.874
Smoking 18 (22.2) 5 (17.2) 16 (15.4) 5 (26.3) 0.541
Alcohol use 49 (60.5) 14 (48.3) 60 (57.7) 10 (52.6) 0.689
Physical activity 50 (61.7) 15 (51.7) 43 (41.8) 9 (47.4) 0.062
CVD history 12 (14.8) 1 (3.5) 11 (10.6) 1 (5.3) 0.384
HTN medication 23 (28.4) 10 (34.5) 44 (42.3) 9 (47.4) 0.188
Statin use 15 (18.5) 2 (6.9) 21 (20.2) 3 (15.8) 0.413
Anti-PLT use 11 (13.6) 6 (20.7) 18 (17.3) 3 (15.8) 0.799

Values are presented as mean±standard deviation, median (interquartile range), or number (%). P values were calculated using the Kruskal-Wallis H test, one-way analysis of variance (ANOVA), the chi-square test, or Fisher's exact test.

BMI, body mass index; WC, waist circumference; WHR, waist hip ratio; SBP, systolic blood pressure; DBP, diastolic blood pressure; AST, aspartate aminotransferase; ALT, alanine aminotransferase; FBS, fasting blood sugar; HbA1c, glycosylated hemoglobin; BUN, blood urea nitrogen; hs-CRP, high-sensitivity C-reactive protein; TC, total cholesterol; TG, triglyceride; LDL-C, low density lipoprotein cholesterol; HDL-C, high density lipoprotein cholesterol; HOMA-IR, homeostasis model assessment of insulin resistance; baPWV, brachial-ankle pulse wave velocity; CIMT, carotid intima media thickness; ASM, appendicular skeletal muscle; HTN, hypertension; CVD, cardiovascular disease; PLT, platelet.

a,bDifferent letters indicate significant differences between groups (P<0.05).

Table 2

Multiple logistic regression analysis for the risk of homeostasis model assessment of insulin resistance ≥3 by body composition group

dmj-43-105-i002
Normal Low muscle mass Abdominal obesity Low muscle mass with abdominal obesity P value P for trend
Univariate 1 1.38 (0.59–3.26) 6.34 (3.30–12.16) 6.38 (1.94–20.99) <0.001 <0.001
Multivariate
 Model 1 1 1.51 (0.62–3.68) 6.69 (3.41–13.12) 8.17 (2.39–27.99) <0.001 <0.001
 Model 2 1 1.51 (0.62–3.67) 6.58 (3.35–12.94) 8.07 (2.36–27.65) <0.001 <0.001
 Model 3 1 1.48 (0.60–3.62) 6.54 (3.27–13.08) 8.63 (2.44–30.48) <0.001 <0.001
 Model 4 1 1.34 (0.51–3.51) 5.17 (2.40–11.14) 9.27 (2.41–35.69) <0.001 <0.001
 Model 5 1 1.33 (0.50–3.54) 5.36 (2.46–11.69) 9.39 (2.41–36.56) <0.001 <0.001

Values are presented as odds ratio (95% confidence interval). P values were calculated using multiple logistic regression analysis.

Model 1: adjusted for age; Model 2: adjusted for age and gender; Model 3: adjusted for age, gender, smoking status, alcohol status, and physical activity; Model 4: adjusted for age, gender, smoking status, alcohol status, physical activity, high density lipoprotein cholesterol (HDL-C), triglycerides, aspartate aminotransferase (AST), and alanine aminotransferase (ALT); Model 5: age, gender, smoking status, alcohol status, physical activity, and HDL-C, triglyceride, AST, ALT, and medication history including statin, antiplatelet, and antihypertensive agents.

TOOLS
Similar articles