

 PDF
PDF ePub
ePub Citation
 Print
Print


INTRODUCTION
Diabetes is one of the most common causes of vision disability among 20- to 74-year-old adults [1]. Diabetic retinopathy (DR) is a recognized complication of diabetes mellitus [2], and one of the leading causes of blindness worldwide. In addition, loss of productivity and quality of life in patients with DR results in additional socioeconomic burdens on the community [3]. Retinopathy progression is gradual, varying from mild abnormalities such as increased vascular permeability to moderate and severe non-proliferative DR [4]. The total number of individuals with diabetes has been assumed to rise from 171 million in 2000 to 366 million by 2030, mostly in developing countries [5].
DR risk factors that are described in the literature include: diabetes duration, age, gender, type of treatment (insulin treatment, oral medications, and diabetes diet), hypertension, retinal function, high levels of serum cholesterol and/or triglycerides [6], and body mass index (BMI) [7]. Although many preventive measures and treatment methods have been used, DR has remained to be the leading cause of blindness in the 21st century [8]. Given the limited number of studies and high prevalence of DR in Iran, the current study aimed to evaluate its prevalence and related risk factors in diabetic patients in Fars province, Iran.
Go to : 
METHODS
This cross-sectional study was conducted on 478 diabetic patients admitted to a referral diabetes and ophthalmic clinic (Motahari) in Shiraz, Iran from 2015 to 2016. As this clinic is the biggest and the most referred medical center for all types of diseases, including diabetes, in Southern Iran, it seems that there are no significant differences between demographic and clinical characteristics of recruited and not-recruited patients who visited the center [9]. All patients had medical records and were routinely checked by an expert physician, the required data were obtained from the patients' medical records, as well as a face-to-face interview using a structured questionnaire. The questionnaire included questions about demographic data, weight, height, and clinical data (i.e., diabetes duration, chronic conditions, presence or absence of retinopathy, type of retinopathy).
Variables categories and definitions
DR was the main outcome in the present study and it was classified based on Watkins [10] standards. In fact, DR was classified into proliferative and non-proliferative groups based on the data extracted from the patients' medical records. Non-proliferative DR was classified into mild, moderate, and severe [5]. Furthermore, chronic conditions were classified into hypertension, retinal diseases, heart diseases, hyperlipidemia, and other type of diseases. Also, family history (no history vs. having history) of diabetes was asked from participants and checked in their medical records (κ agreement=0.86). Furthermore, glycosylated hemoglobin (HbA1c) levels were divided into two groups; i.e., controlled and uncontrolled. As such, HbA1c level was measured using the Bayer DCA 2000+analyzer (Bayer Healthcare, Leverkusen, Germany), patients with HbA1c levels lower than 7% were included in the controlled group and those with HbA1c levels higher than 7% were included in the uncontrolled group [5]. Blood pressure was measured in a seated position, using standard mercury sphygmomanometers, and hypertension was defined as a systolic blood pressure of 140 mm Hg or more and/or a diastolic blood pressure of 90 mm Hg or more; or ongoing treatment with antihypertensive drugs [11]. Hyperlipidemia was defined as the total cholesterol of 6.2 mmol/L or more or the use of lipid-lowering drugs [5].
An expert physician diagnosed type 1 or type 2 of diabetes mellitus, according to patients' medical records. Diabetes was defined by the use of diabetic medication or physician's diagnosis, and those without known diabetes, it was defined as fasting blood sugar ≥126 mg/dL and 2-hour postprandial blood glucose ≥200 mg/dL in accordance with the current World Health Organization diagnostic criteria for diabetes [12].
Logistic regression was performed to find associations between the study factors and DR using the IBM SPSS statistical software version 21.0 (IBM Co., Armonk, NY, USA). Multivariable analysis included all variables that were shown to be associated with DR at P<0.25 level in univariate analysis [13]. P<0.05 was considered to be statistically significant.
Written consent was obtained from all study participants and verbal consent was taken from illiterate subjects. Behbahan University of Medical Sciences Ethical Committee approved the study (no: 9715).
Go to :
RESULTS
Prevalence of DR and other health status characteristics of the participants
The prevalence of DR was 32.8%. Of 478 diabetic patients, 60.9% were female. The mean±standard deviation age of the participants was 56.64±12.45 years old and the mean age at diagnosis was 45.17±13.27 and 44.95±14.39 years old in female and male patients, respectively. Of all, 91.7% of the patients had non-proliferative DR. In addition, 94.1% of the patients had type 2 diabetes mellitus. On average, the patients had suffered from diabetes for 11.37±9.0 years. Hypertension was the most prevalent chronic condition (35.6%) followed by heart diseases (16.1%) (Table 1).
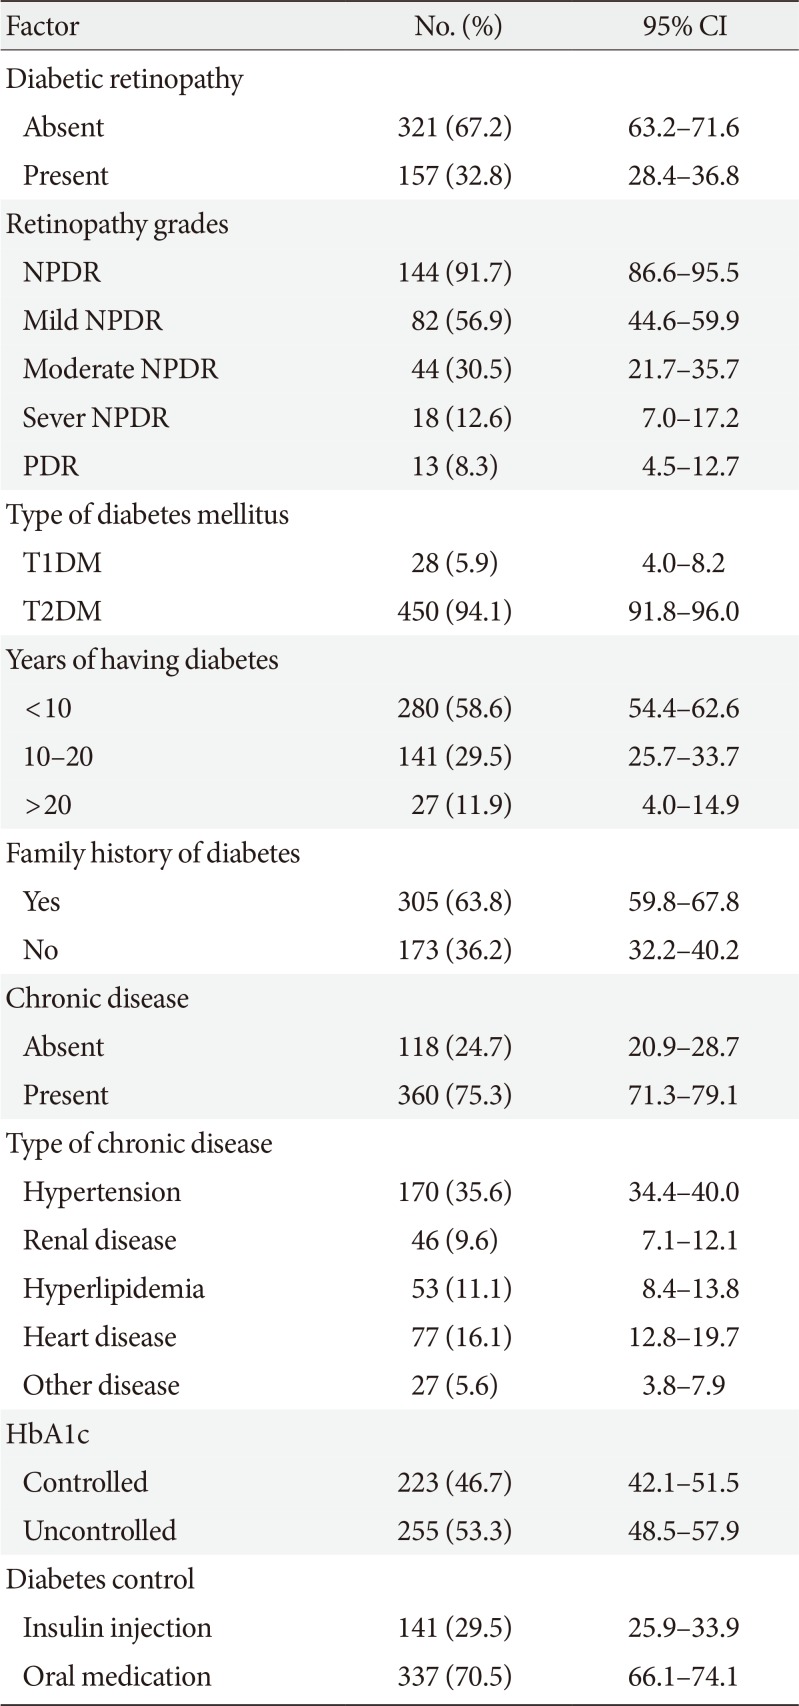
Table 1
Health status characteristics of patients diagnosed with type 2 diabetes mellitus, Shiraz, Iran, 2015 to 2016
![]()
Logistic regression analysis
As showed in Table 2, the results of univariate logistic regression analysis indicated that age, overweightness, diabetes duration, insulin treatment, and having non-communicable chronic diseases were significantly associated with DR (P<0.05). The results of adjusted regression analysis showed that the patients with middle school or high school education levels (middle school or high school vs. illiterate: odds ratio [OR], 0.43; 95% confidence interval [CI], 0.24 to 0.76) and academic education (academic vs. illiterate or primary: OR, 0.41; 95% CI, 0.19 to 0.87) were less likely to develop DR in comparison with illiterate patients. Being overweight (overweight vs. normal BMI: OR, 1.70; 95% CI, 1.02 to 2.83) and obese (obese vs. normal BMI: OR, 1.88; 95% CI, 1.09 to 3.26), diabetes duration (10 to 20 years vs. <10 years: OR, 2.35; 95% CI, 1.48 to 3.73) (≥20 years vs. <10 years: OR, 5.63; 95% CI, 2.97 to 10.68), and treatment (insulin treatment vs. oral medication: OR, 1.99; 95% CI, 1.27 to 3.10) were significantly associated with DR. The results showed a significant relationship between having non-communicable diseases and DR. As such, diabetic patients with chronic diseases experiencing a higher risk of developing DR (yes vs. no: OR, 1.71; 95% CI, 1.02 to 2.85). Table 2 shows adjusted association between study factors and DR among patients diagnosed with type 2 diabetes mellitus, Shiraz, Iran.
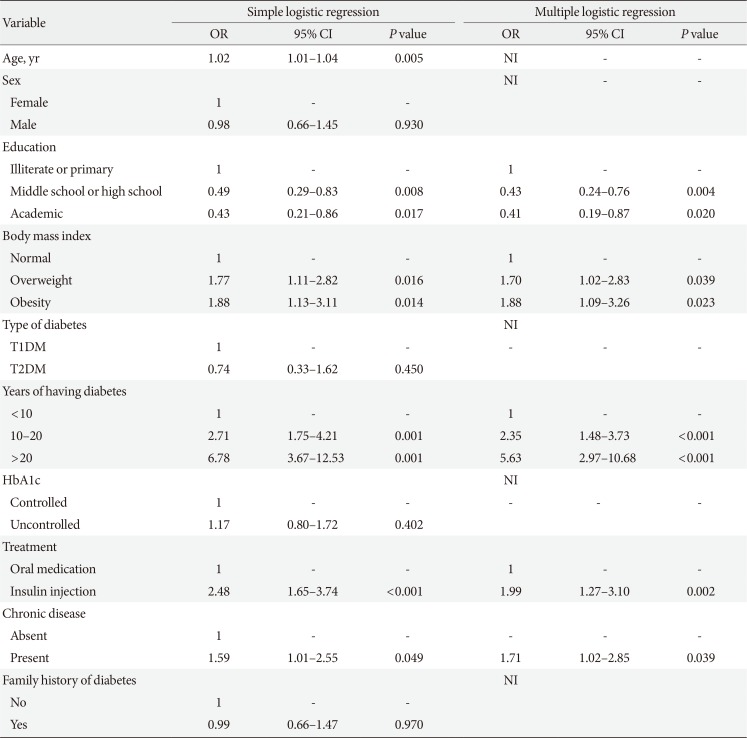
Table 2
Association between study factors and diabetic retinopathy among patients diagnosed with type 2 diabetes mellitus, Shiraz, Iran, 2015 to 2016
![]()
Go to :
DISCUSSION
The study findings showed that the prevalence of DR was 32.8% among diabetic patients. In addition, the results of multivariable regression analysis revealed a significant relationship between DR and diabetes duration, BMI, type of diabetes treatment, education level, and chronic diseases.
The prevalence of DR in the present study was different from or lower than that reported in other studies. For instance, in Armenia the prevalence of DR was 36.2% [13], in Nepal was 44.7% [8], and 37% in another region of Iran [5]. Also, this rate was 11.9% in China [7] and 19% in United Arab Emirates [4]. Generally, many studies have reported different rates of DR, with the estimates largely depending on methodology, diagnostic methods, effect of interventional factors, and study samples [513]. Overweight and obesity as major complications associated with diabetes have become a major public health problem worldwide as they have shown an increasing trend in many countries [7]. Therefore, BMI should be taken into account as a major risk factor associated with DR in studies focusing on diabetes and its related complications, such as DR. The present study showed that BMI was positively associated with DR development. Accordingly, overweight and obese patients were respectively 1.70 and 1.88 times more likely to develop DR than those with normal BMI [14]. However, this was not consistent with the results of several studies [1516]. In addition, duration of diabetes was positively associated with DR, which is in line with the previous studies [17]. Our findings showed that the patients with higher education levels were less likely to develop DR than illiterate patients. A previous study also examined the relationship between health literacy and diabetes outcomes. The results revealed that participants with lower education levels were at a higher risk of DR [18]. However, the findings of our study were not in agreement with some other studies [1419]. Our results showed that the risk of DR was significantly higher (1.71 times) in diabetic patients with chronic diseases compared to those with no chronic diseases. Javadi et al. [5] reported that the prevalence of DR was 1.55 times higher in diabetic patients with hypertension. They also found a positive, but not statistically significant association between hyperlipidemia and DR [5]. Moreover, a study in Nepal showed that diabetic patients with hypertension were 2.41 times more likely to develop DR [8]. Several studies have also shown a significant association between heart diseases and DR in diabetic patients [15]. However, some studies have indicated no significant associations between the presence of chronic diseases and DR [1314]. The present study showed a higher risk of DR among patients who were treated with insulin in comparison to those treated with oral medications; hence, our result was in line with the results of the previous studies [1517]. Although age was a risk factor associated with DR in univariate analysis, it was considered as a confounding factor in multivariable analysis. Many studies have supported these findings, but have mentioned that age is not significant [1720]. Nonetheless, few studies have disclosed age as a risk factor for DR [8]. The present study revealed that type of diabetes was not significantly associated with DR, which is inconsistent with some studies [513]. However, some other studies have shown a significant association between type of diabetes and DR [46]. Moreover, patients with controlled and uncontrolled HbA1c levels were not significantly different regarding the risk of DR. Furthermore, family history of diabetes was not significantly associated with DR, which is similar to the previous study [4]. Finally, the prevalence of DR was 32.8% in this study. Given the inconsistency in the results of the previous studies, as well as DR prevalence it seems that policymakers and healthcare providers haven't been able to come up with an applicable strategy.
In conclusion, our study indicated that longer diabetes duration and obesity or having chronic disease are strongly associated with DR suggesting that control of these risk factors may reduce both the prevalence and impact of retinopathy in Iranian patients.
Recruiting participants who had visited the biggest referral center in Southern Iran makes our results generalizable for the population of Shiraz. We selected a major referral center in Southern Iran, and it seems that there are no significant differences between demographic and clinical characteristics of recruited diabetic patients and not-recruited patients who visited the center. However, there is the possibility that clinical characteristics between recruited and not-recruited diabetic patients may be different. Authors checked patients' medical records, but due to lack of comprehensive data registry, some biochemical data were not available.
Go to :
 XML Download