

 PDF
PDF ePub
ePub Citation
 Print
Print


INTRODUCTION
METHODS
Study population
Clinical and laboratory measurements
Diabetic retinopathy
Definition of CHD
Definition of stroke
Statistical analysis
RESULTS
Comparison of type 2 diabetes mellitus characteristics according to serum CysC levels
Table 1
Clinical and biochemical characteristics of type 2 diabetes mellitus patients with normal renal function or mild renal impairment according to serum cystatin C quartiles
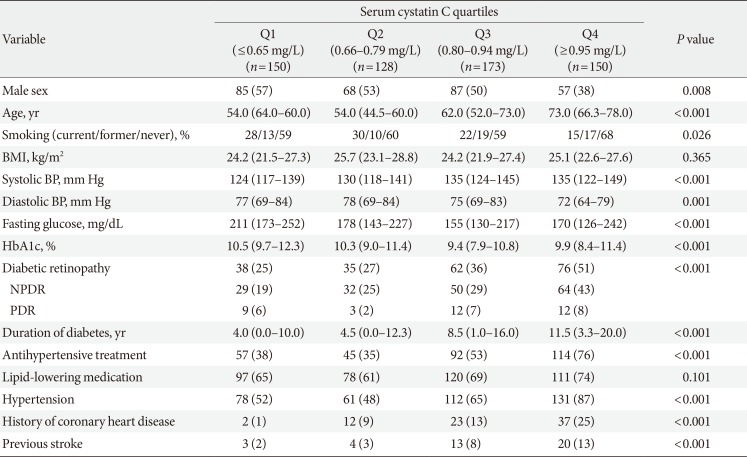
Values are presented as number (%) or median (interquartile range). Demographic and biochemical characteristics were compared using chi-square test for categorical variables and Kruskal-Wallis test for continuous variables.
BMI, body mass index; BP, blood pressure; HbA1c, glycosylated hemoglobin; NPDR, nonproliferative diabetic retinopathy; PDR, proliferative diabetic retinopathy.
![]()
Risk for vascular complications in type 2 diabetes mellitus patients
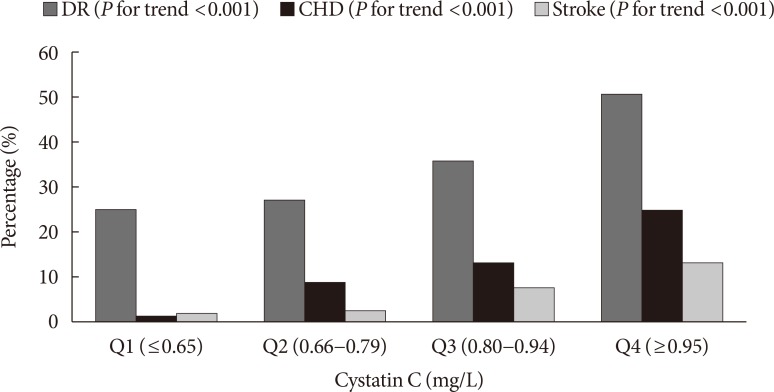 | Fig. 1Proportion of patients with vascular complications according to cystatin C quartiles. DR, diabetic retinopathy; CHD, coronary heart disease.
|
Table 2
Odds ratio and 95% confidence intervals for the risk of diabetes complications based on serum cystatin C quartiles
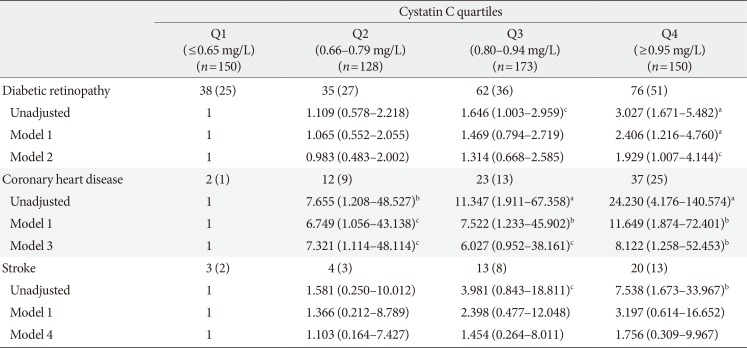
Values are presented as number (%). Model 1, adjusted for gender (male, female) and age (years); Model 2, adjusted for gender (male, female), age (years), smoking (current, former, never), body mass index (BMI, kg/m2), glycosylated hemoglobin (HbA1c, %), duration of diabetes (years), hypertension (no, yes), history of coronary heart disease (no, yes), and previous stroke (no, yes); Model 3, adjusted for gender (male, female), age (years), smoking (current, former, never), BMI (kg/m2), HbA1c (%), duration of diabetes (years), hypertension (no, yes), diabetic retinopathy (no, yes), and previous stroke (no, yes); Model 4, adjusted for gender (male, female), age (years), smoking (current, former, never), BMI (kg/m2), HbA1c (%), duration of diabetes (years), hypertension (no, yes), diabetic retinopathy (no, yes), and history of coronary heart disease (no, yes). Odds ratio (OR) and 95% confidence interval (CI) for development of metabolic syndrome were estimated using logistic regression models. All P values and 95% CI for OR were corrected by Bonferroni's method due to multiple testing.
aP<0.001, b0.001≤P<0.01, c0.01≤P<0.05.
![]()
 XML Download