

 PDF
PDF ePub
ePub Citation
 Print
Print


INTRODUCTION
The increasing number of people with obesity has resulted in an increasing prevalence of diabetes in Korea [1]. Additionally, due to lower rates of both diabetes awareness and participation in health screening among young adults, it is important to identify at-risk asymptomatic individuals, especially in this age group.
Screening and early diagnosis of diabetes has considerable health benefits due to the ability to control glycemia and cardiovascular risk factors [2]. Additionally previous clinical trials have indicated that interventions targeting lifestyle factors and diabetes medication with people with impaired glucose tolerance can prevent or delay the onset of diabetes [34]. However, many diabetes risk assessment tools were developed based on specific ethnic groups, and the risk scores may not apply to other ethnic groups [56]. Although a diabetes risk score for the Korean population was developed using the Korea National Health and Nutrition Examination Survey (KNHANES), it did not reflect the incidence of diabetes [7]. Lim et al. [8] also developed a risk score to predict the 4-year risk of diabetes using the Korean Genome and Epidemiology Study (KoGES); however, it was developed using a limited cohort size, the score did not take into account long-term outcome, and the sample might not be representative of the general population of Korea.
The National Health Insurance Service-National Health Screening Cohort (NHIS-HEALS) was developed in 2002 as a random sample of 10% of the population between the ages of 40 and 79 years who completed a national health screening test in 2002 or 2003 and who were followed up through 2013. We therefore developed a 10-year Korean Diabetes Risk Score (KDRS) using the NHIS-HEALS.
METHODS
Development and validation samples
We used the NHIS-HEALS to derive a diabetes risk equation. A detailed description of the study design and methods has been published previously [9]. In brief, the NHIS-HEALS cohort study enrolled 514,795 participants in 2002 or 2003. The database of this study contains demographic information, diagnoses, therapeutic procedures, drug prescriptions, date of death, and information from health examinations, such as health questionnaire surveys, physical examinations, and biochemical test results. For this study, we excluded people without variables used in the KDRS, people who had been diagnosed with diabetes (10th edition of the International Classification of Diseases [ICD-10] codes E10–E14), and those with a self-reported medical history of diabetes or a fasting blood glucose level of 126 mg/dL or greater in 2002 or 2003. Thus, 359,349 people were included at baseline. The incidence of diabetes was defined in terms of receiving a prescription for diabetes medication (Anatomical Therapeutic Chemical [ATC] code A10) or a fasting blood glucose level of 126 mg/dL or greater. The end of follow-up was the event of diabetes, death, or the end of the study period (December 31, 2013). Data on family history of diabetes, alcohol consumption, smoking status, and physical activity were obtained from self-report questionnaires. Use of antihypertensive (ATC codes C02–C03 or C07–C09) and statin (ATC code C10AA) therapy was ascertained based on drug prescriptions. Body mass index (BMI) was calculated as weight (kg) divided by height squared (m2) and classified according to Asian-specific criteria [10] as follows: underweight (<18.5 kg/m2), normal weight (18.5 to 22.9 kg/m2), overweight (23.0 to 24.9 kg/m2), obese class I (25.0 to 29.9 kg/m2), and obese class II (≥30.0 kg/m2). Fasting blood samples were taken to measure total cholesterol, glucose, and γ glutamyl transferase (GGT) levels.
The Ansung-Ansan Cohort Study, which is part of the KoGES, was used for external validation. This population-based cohort was used in an epidemiological study of rural and urban communities in Korea. The baseline survey was completed in 2001 or 2002, and follow-up examinations are ongoing biennially. A detailed description of the study design and methods has been published previously [11]. The Ansung-Ansan Cohort study enrolled 10,030 participants who were aged 40 to 69 years in 2001 or 2002. We excluded people without variables used in the KDRS and people with diabetes. Diabetes was defined as a fasting blood glucose level of ≥126 mg/dL, a 2-hour glucose level of ≥200 mg/dL in a 75-g oral glucose tolerance test, a glycosylated hemoglobin (HbA1c) level ≥6.5%, or a self-reported medical history of diabetes. The end of follow-up was the event of diabetes or the last examination. Data on family history of diabetes, alcohol consumption, smoking status, physical activity, and use of drugs were obtained from self-report questionnaires. Height, weight, and blood pressure were measured using standardized techniques and equipment. Blood samples were obtained after fasting for at least 12 hours.
Risk factors for diabetes
Our analysis included the following variables, which are known to affect diabetes risk: age (years), family history of diabetes (yes or no), alcohol intake (abstinent, low to medium, or high; only in men), smoking status (current, former, or non-smoker), physical activity (low, medium, or high), use of antihypertensive therapy (yes or no), use of statin therapy (yes or no), BMI (<18.5, 18.5 to 22.9, 23.0 to 24.9, 25.0 to 29.9, or ≥30.0 kg/m2), systolic blood pressure (<100, 100 to 119, 120 to 139, 140 to 159, or ≥160 mm Hg), total cholesterol (<240 or ≥240 mg/dL), fasting glucose (<70, 70 to 84, 85 to 99, 100 to 109, or ≥110 mg/dL), and GGT level (continuous; only in women).
Statistical analysis
We used the Cox proportional hazards model in the development dataset to estimate the coefficients and hazard ratios associated with each potential risk factor for the incidence of diabetes for men and women separately. The prognostic index, which is the sum of each coefficient multiplied by the confounder variable, was centered on the mean values of the risk factors to derive a risk equation for a 10-year follow-up [12]. We did not consider the interaction terms between the independent variables. We tested the performance of the KDRS in the development and validation dataset. Discrimination was evaluated by Harrell's C-statistic [13]. Calibration (prediction accuracy) was assessed using a calibration plot comparing the observed probabilities (from the 10-year Kaplan-Meier estimates) with the predicted probabilities within deciles of predicted risk. The times to outcome events were visualized using Kaplan-Meier graphs according to confounding factors. The difference in the Kaplan-Meier curves between groups was assessed using the log-rank test. All analyses were conducted using the SAS software version 9.4 (SAS Institute Inc., Cary, NC, USA).
Ethical consideration
The study protocol was reviewed and approved by the Ajou University Institutional Review Board (IRB) (IRB No. AJIRB-MED-OBS-16-509). Review board requirements for written informed consent were waived because all personal identifying information was removed from the dataset prior to analysis.
RESULTS
Table 1 presents the characteristics of the men and women in both cohorts. In the development cohort, the mean±standard deviation (SD) age at baseline was 51.2±9.2 years in men and 52.5±9.6 years in women. In the validation cohort, the mean±SD age at baseline was 50.4±8.4 years in men and 51.3±8.8 years in women. The median (interquartile range [IQR]) follow-up period was 10.8 years (IQR, 10.1 to 11.3 years) for the development cohort and 9.5 years (IQR, 3.8 to 9.7 years) for the validation cohort. We identified 37,678 cases of diabetes arising from 3,624,243 person-years (event rate=10.4 per 1,000 person-years) in the development cohort. In the validation cohort we identified 1,040 cases of diabetes from 46,028 person-years (event rate=22.6 per 1,000 person-years).
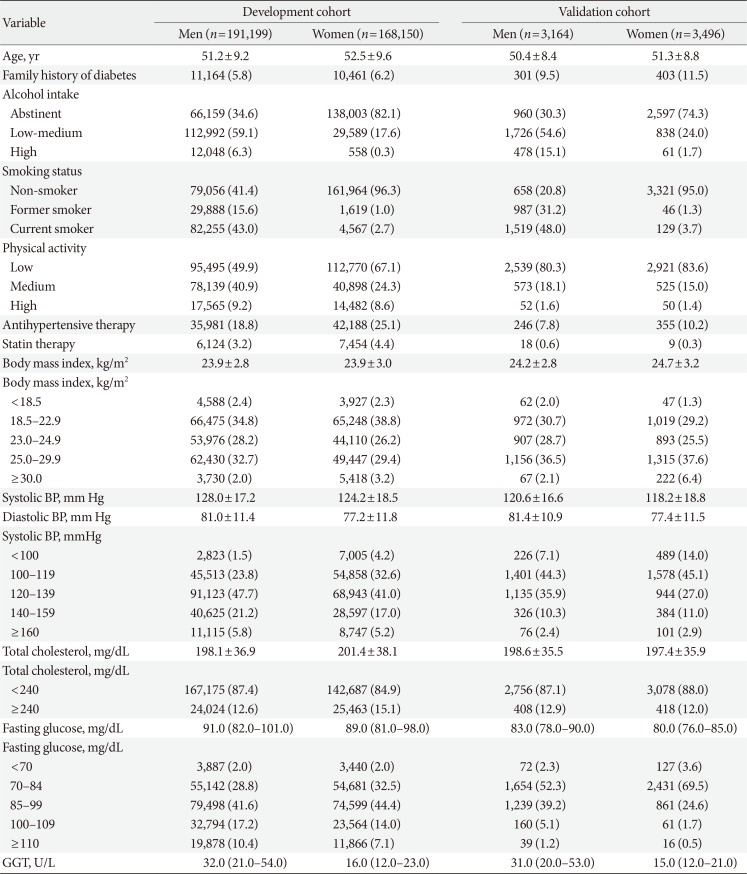
Table 1
Baseline characteristics of participants in development and validation cohorts at study entry
![]()
Table 2 lists the results of the Cox regression analysis for the development dataset. The risk of diabetes was significantly higher among people with a family history of diabetes, high levels of alcohol consumption (only in men), and low levels of physical activity as well as among users of antihypertensive or statin therapy and former/current smokers. The risk of diabetes increased with high BMI, systolic blood pressure, total cholesterol, or fasting glucose in men and women. In women, the risk increased with increasing GGT. People with fasting glucose values ≥110 mg/dL had the highest hazard ratio for the incidence of diabetes (men, 3.65; women, 3.83). The risk equation is provided in Supplementary Table 1.
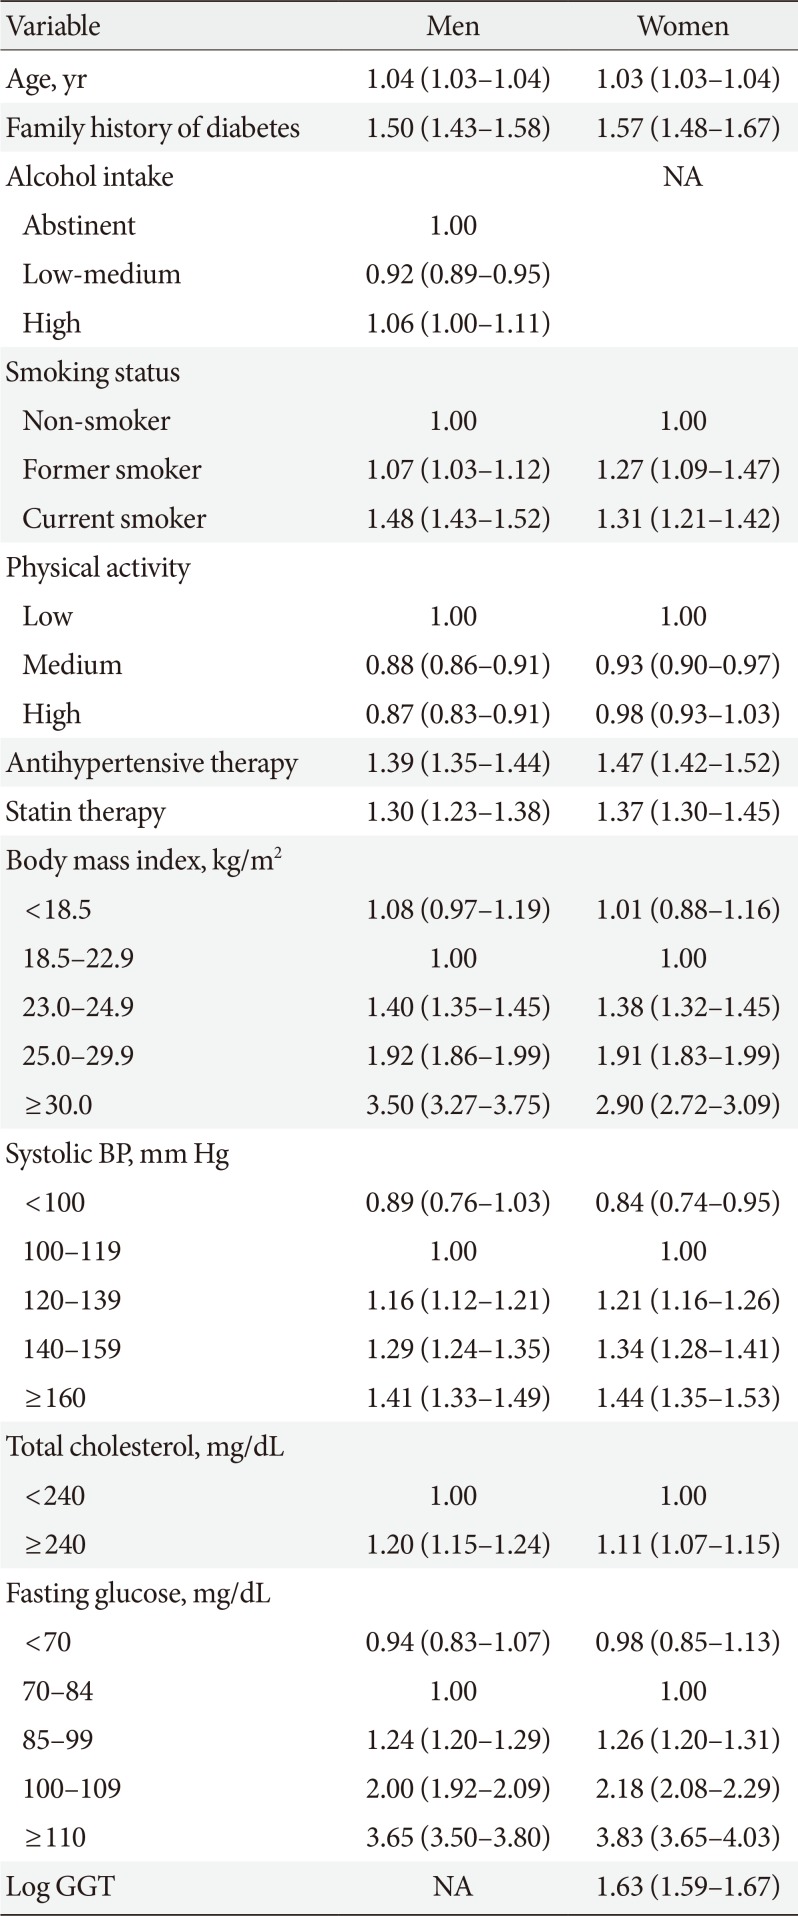
Table 2
Adjusted hazard ratio (95% confidence interval) for diabetes in the development cohort
![]()
Fig. 1 compares the predicted and observed risks of a diabetes event at 10 years by decile of predicted risk. The predicted number of diabetes events in the top decile showed a pronounced deviation from the observed number of diabetes events, overestimating diabetes risk in the development cohort. However, the calibration plots in the validation cohort showed a predominance of underestimation.
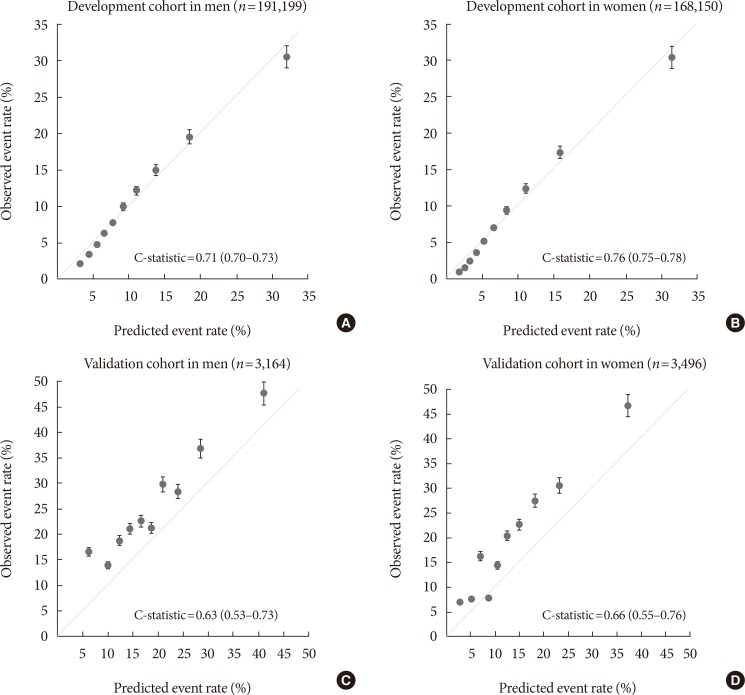
The C-statistics for the models for risk at 10 years were 0.71 (95% confidence interval [CI], 0.70 to 0.73) in men and 0.76 (95% CI, 0.75 to 0.78) in women in the development dataset. In the validation dataset, the C-statistics for the models were 0.63 (95% CI, 0.53 to 0.73) in men and 0.66 (95% CI, 0.55 to 0.76) in women (Fig. 1).
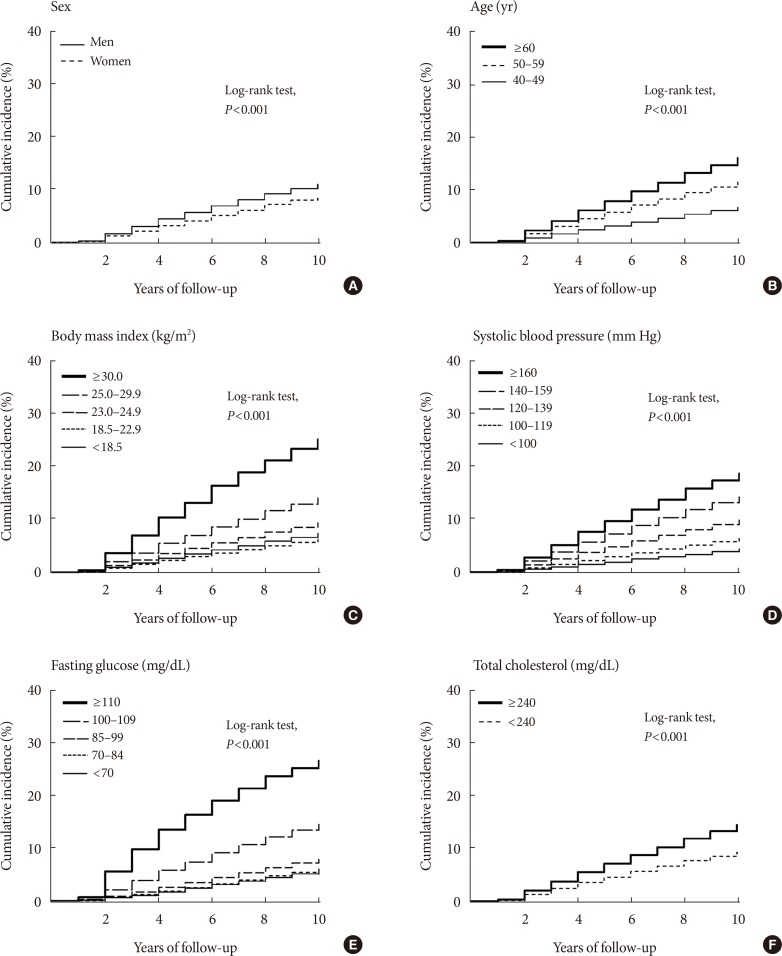
Time to diabetes event is presented as Kaplan-Meier plots in Fig. 2. There were significant differences between groups in sex, age, BMI, systolic blood pressure, fasting glucose, and total cholesterol (log-rank test, P<0.001 for all comparisons).
DISCUSSION
We developed and validated the KDRS, which identifies people at high risk for diabetes based on data from regular health screening tests in Korea. The prevalence of diabetes in Korea was 8.6 in 2001 and increased to 11.0% in 2013 [1]. In addition, coronary revascularization such as percutaneous coronary intervention and coronary artery bypass graft was performed 7 to 10 times higher in people with type 2 diabetes mellitus (T2DM) than in people without diabetes in Korea [14]. However, the awareness rate for diabetes is 70.7%, and the lower the age, the lower the awareness [15]; therefore, there is a need to establish a diabetes risk score for the Korean population. Established prediction models for diabetes have been developed and validated in various population-based cohorts [16]. However, risk scores developed in Caucasian populations might not perform accurately in Asian populations because of the different biological factors associated with the onset of diabetes: lowers BMI levels, younger ages, or earlier declines in β-cell function with the onset of diabetes in Asian populations [171819]. Although previous studies reported risk scores derived from Asian populations, these risk scores might not accurately predict the risk of diabetes due to the use of cross-sectional data [20], logistic regression models [21], or only short-term outcomes [222324]. In Korea, although discrimination was similar to KDRS, two risk scores for diabetes developed using different types of datasets, depending on the different purpose (Supplementary Table 2) [7825]. Lee et al. [7] developed diabetes score using the KNHANES to detect asymptomatic diabetes through simple questions. Lim et al. [8] developed diabetes score using cohort study to predict the incidence of diabetes through multiple risk factors. Although KDRS also developed to predict the incidence of diabetes, we used long-term outcomes and survival regression. In addition, because the risk score developed based on national regular health screening test, general population may calculate diabetes risk score based on results of health screening test without any additional examination, and may check diabetes risk score regularly.
The risk score was validated using a different population-based cohort in Korea. The score exhibited moderate discrimination in the external validation cohort. However, the predicted risk was underestimated in the external validation cohort. We used a different definition of diabetes in the development and validation cohorts; thus, the event rate was significantly higher in the validation dataset than in the development dataset. Moreover, differences in the definitions of clinical variables, such as the use of statins, may have also contributed to the underestimation. However, when definition of diabetes was applied equally to a fasting blood glucose level of ≥126 mg/dL or medical history of diabetes in the development and validation cohort, the event rate was 11.8 per 1,000 person-years, similar to the event rate of development set, and the C-statistic were 0.76 (95% CI, 0.63 to 0.87) for the men and 0.81 (95% CI, 0.68 to 0.91) for the women in the validation dataset, which was higher than the main analysis (data not shown).
Lifestyle factors, such as smoking, and low physical activity are well known that increase the risk of diabetes [2627]. However, the effect of alcohol consumption on diabetes is controversial. Recent meta-analysis reported that light and moderate alcohol consumption was associated with a lower risk of T2DM, whereas heavy alcohol consumption did not affect the incidence of T2DM [28]. Another meta-analysis reported that moderate alcohol consumption reduces the risk of diabetes in women, but a dose-response relationship beyond the threshold. However, there was no reduction in risk in Asian populations [29]. In Korea, in a community-based cohort study of Korean adults, heavy alcohol consumption was associated with an increased risk of diabetes, whereas the light and moderated consumption was associated with a decreased risk of diabetes [30]. However, using KNHANES data, high-risk groups based on the alcohol-use disorders identification test associated with a higher risk of diabetes in men, but not in women [31]. In addition, the proportion of individuals who were abstinent with regard to alcohol intake was higher in women than men (34.6% and 82.1% for men and women, respectively). Thus, we included alcohol consumption in risk score only in men. Instead of alcohol consumption, we included GGT in the risk score in women. GGT, which is a commonly used indicator of alcohol consumption or liver disease, may predict disease by acting as a cumulative biomarker of various environmental chemicals [32]. Exposure to several environmental irritants, such as persistent organic pollutants, may affect the risk for diabetes and obesity [33]. Additionally, a previous study reported that GGT was a predictor of diabetes in the Coronary Artery Risk Development in Young Adult study [34]. As a result, the C-index in the external validation cohort was higher in women than in men (0.63 and 0.66 for men and women, respectively).
We also determined the appropriate range of BMI and systolic blood pressure values for increasing the risk of developing diabetes by evaluating the risk associated with each category of variables. Obesity is one of the most important modifiable risk factors that can prevent diabetes. However, the effect of being underweight on the development of diabetes has been controversial. In the National Health and Nutrition Examination Survey, the prevalence of diabetes increased as the range of obesity class increased [35]. However, Sairenchi et al. [36] reported significant associations of low (<18.5 kg/m2) and high (≥30.0 kg/m2) BMIs with the risk of diabetes in participants aged 60 to 79 years using data from a large Japanese cohort, whereas a low BMI showed no significant association in participants aged 40 to 59 years. Our study also showed that underweight (BMI <18.5 kg/m2) individuals had a higher risk of diabetes than normal-weight (BMI 18.5 to 22.9 kg/m2) men and women, but this difference did not reach statistical significance. High blood pressure is also associated with increased risk for diabetes. In African Americans and Caucasians aged 35 to 54 years, higher blood pressure was associated with a higher risk of diabetes than normal blood pressure (systolic blood pressure/diastolic blood pressure, <120/80 mm Hg) [37]. In a community-based cohort study of Korean adults, people with prehypertension (120 to 139/80 to 89 mm Hg), stage 1 hypertension (140 to 159/90 to 99 mm Hg), and stage 2 hypertension (≥160/100 mm Hg) had a higher risk of developing diabetes than people in the normal range (<120/80 mm Hg) [38]. Additionally, the 2017 American College of Cardiology/American Heart Association Task Force on Clinical Practice Guidelines suggested that a blood pressure target of less than 130/80 mm Hg may be reasonable [39]. Our study showed that the risk of diabetes increased as systolic blood pressure increased; however, there was no significant association in men with a systolic blood pressure of 100 or less.
This study has several limitations. First, the 2-hour glucose and HbA1c levels have played important roles in the prediction of diabetes [84041], although fasting glucose is the recommended screening test. We did not include the results of a 2-hour oral glucose tolerance test or data on HbA1c levels. And, it is necessary to increase the accuracy of diabetes diagnosis by also measuring HbA1c when the fasting glucose is greater than 100 mg/dL in the national health screening. Second, self-reported data on such variables as physical activity and alcohol intake may have introduced measurement error and led to the underestimation of the predictive strength of the risk factors. Third, we could not discriminate between type 1 diabetes mellitus (T1DM) and T2DM. As T1DM affects about 0.02% of the Korean population [42], our data can be attributed to people with T2DM. Fourth, a previous study reported that BMI should not be included in risk scores [43] and that, in Korea, waist circumference was a better predictor of diabetes than BMI [7]. However, we did not include waist circumference. Additionally, we also did not consider triglyceride and high density lipoprotein cholesterol levels, which are known risk factors for diabetes [44]. Waist circumference, triglyceride, and high density lipoprotein cholesterol have been measured in the national health screening since 2009, and it is necessary to develop a prediction equation that includes these factors. Finally, dietary pattern such as red meat and sugar sweetened beverages intake increased risk of diabetes, while healthy diets such as fruit and vegetable intake decreased risk of diabetes [454647]. However, we didn't consider these effect for diabetes.
In conclusion, we developed and validated a 10-year KDRS. The score may help people who undergo national health screening in Korea to recognize the risk of diabetes and decide whether they should seek diabetes testing. Additionally, the score may be effective for delaying or preventing the onset of diabetes by underscoring the need to manage the modifiable risk factors.
 XML Download