

 PDF
PDF ePub
ePub Citation
 Print
Print


INTRODUCTION
Type 2 diabetes mellitus (T2DM) is a growing epidemic, with an estimated 415 million people with diabetes worldwide in 2015, and projected to increase to 642 million in 2040 [1]. There has also been a great increase since the 1970s in the prevalence of T2DM in Asian countries, including Korea [2]. T2DM is often accompanied by microvascular complications, and the development and progression of microvascular complications can be prevented by improved glycemic control [3]. Lifestyle factors, including a healthy diet, physical activity, maintaining a normal weight, and not smoking, are also essential in the management of T2DM [4].
Lower socioeconomic status (SES) has been shown to be associated with the development of T2DM [5]. Lower SES has also been reported to be associated with higher mortality in patients with T2DM [6]. Studies evaluating the effect of socioeconomic deprivation on the prevalence of complications and glycemic control in patients with diabetes have been reported, and some have shown higher prevalence of diabetic complications and poorer glycemic control [7891011]. However, this association has not been consistently seen in all studies [12], and while many studies have evaluated the impact of socioeconomic deprivation on prevalence or incidence of diabetes or cardiovascular risk factors in various populations, the role of SES in patients with T2DM has been less studied [5713].
Although previous studies have evaluated the association between SES and diabetes care-associated parameters, few studies have evaluated glycemic control, diabetes-specific complications, and related health behaviors concurrently in people with T2DM. Also, since these associations may differ between different societies, there is a need to evaluate this association in Asian countries that have gone through rapid economic changes and urbanization in recent decades. Therefore, this study aimed to evaluate the role of socioeconomic position on glycemic control, microvascular complications, and health behaviors in Korean patients with T2DM. Because many of the lifestyle factors and clinical parameters differ between men and women [14], the effect of SES was analyzed separately in men and women.
METHODS
Study population
The study population consisted of patients with T2DM age 30 to 65 years old who participated in the Korean National Diabetes Program (KNDP) cohort study. The KNDP cohort is a prospective, multicenter, observational study performed in Korean patients with T2DM and patients at high risk for diabetes that started enrollment in May 2006, and primary observation of the registered patients ended in March 2014. Study details have been published previously [1516]. The present study population consisted of 3,294 individuals from the KNDP cohort who were diagnosed with T2DM and were 30 to 65 years old at enrollment and had data on SES with concurrent baseline clinical evaluation. The study protocol was approved by the Institutional Review Board of Inha University Hospital (IRB 2006-67) and of each hospital and all participants provided written informed consent before participation.
SES, dietary assessment, and lifestyle variables
SES, dietary assessment, and lifestyle variables were collected according to a standardized questionnaire by trained research personnel. Indicators of SES used in the current study were household income and maximal education attainment. Level of education attainment was divided into three categories: less than high school, high school graduation, and college graduation. Data for monthly household income were obtained by a questionnaire that consisted of multiple-choice questions covering each 1,000,000 Korean won (KRW) as follows: (1) <1,000,000 KRW; (2) 1,000,000 to 2,000,000 KRW; (3) 2,000,000 to 3,000,000 KRW; (4) 3,000,000 to 4,000,000 KRW; (5) 4,000,000 to 5,000,000 KRW; and (6) >5,000,000 KRW. Monthly household income was divided into three categories after merging each two categories as follows: <2,000,000 KRW (1,700 US$), 2,000,000 to 4,000,000 KRW (1,700 to 3,400 US$), and >4,000,000 KRW (3,400 US$).
For dietary intake, patients were interviewed in person by trained registered dietitians using a 24-hour dietary recall questionnaire as previously described [14]. The reported dietary intake was analyzed by the Computed Aided Nutrient Analysis Program version 3.0 (CAN-Pro 3.0; The Korean Nutrition Society, Seoul, Korea) that converted food consumption records to nutrient intake. Intakes of total calories, carbohydrate, protein, total fat, and fiber were assessed in the current analysis. Energy-adjusted nutrient intakes were shown as percent of total energy for protein, fat, and carbohydrates and g/1,000 kcal for dietary fiber.
Leisure time physical activity was evaluated by a questionnaire that was modified from the Minnesota Leisure Time Physical Activity Questionnaire (MLTPAQ) [1417]. The total energy expenditure was calculated into kcal/day as previously described [14]. Smoking habit was classified into two categories: current smoker or not. Alcohol intake was categorized into two categories as current regular drinking or not. Stress level was evaluated by the Korean version of the Brief Encounter Psychosocial Instrument (BEPSI-K). The BEPSI-K score is the average of five closed question items, which is measured using a five-point Likert scale. A higher score indicates a higher stress level [1819].
Anthropometric and laboratory measurements
All anthropometric measurements were standardized for all participating centers and made with participants wearing light clothing without shoes. Weight and height were measured to the nearest 0.1 kg and 0.1 cm. Body mass index (BMI) was calculated as weight (kg) divided by the square of height (m). Obesity was defined as BMI ≥25 kg/m2 [20]. Blood pressure was measured after the subject has been at rest for at least 5 minutes in a sitting position. Blood samples were collected after an overnight fast of at least 10 hours and was analyzed as previously described [21]. Glycosylated hemoglobin (HbA1c) levels were determined by a high-performance liquid chromatography method that received National Glycohemoglobin Standardization Program certification. Total cholesterol, triglyceride, high density lipoprotein cholesterol (HDL-C), low density lipoprotein cholesterol (LDL-C), creatinine, and plasma glucose levels were analyzed using an automated analyzer that received a certification of quality control from the Korean Society for Laboratory Medicine.
Diabetic complications and medical history assessment
Diabetic microvascular complications were assessed as previously reported [22]. To identify diabetic nephropathy, albuminuria was assessed by random urinary albumin creatinine ratio (UACR). Diabetic nephropathy with the presence of increased urinary albumin excretion was defined as UACR ≥30 mg/g Cr. Diabetic retinopathy was diagnosed by funduscopic examination.
Statistical analysis
Differences of clinical and laboratory variables between men and women were analyzed by Mann-Whitney U test and chi-square test for continuous and categorical variables, respectively. The association between education level or income level and baseline clinical and laboratory data were assessed separately in men and women. To assess the trend of variables according to education level or income level, spearman correlation was used for continuous variables, and Mantel-Haenszel test of trend was used for categorical variables. Partial spearman correlation was used to assess trend of continuous variables after adjustment for age, duration, or other relevant factors. Logistic regression analyses were performed to evaluate the impact of lower education and income levels on risks of binary variables, including uncontrolled hyperglycemia, obesity, and diabetic retinopathy after adjustment of confounding factors. All analyses were performed with SPSS version 19 (IBM Co., Armonk, NY, USA). Statistical significance was defined as P<0.05.
RESULTS
General characteristics of the population
The study population comprised 1,927 men (58.5%) and 1,367 women (41.5%). Median age was 52 years (interquartile range [IQR], 46 to 58 years), diabetes duration was 4 years (IQR, 1 to 10 years), BMI 25.0 kg/m2 (IQR, 23.0 to 27.1 kg/m2), and HbA1c 7.4% (IQR, 6.6% to 8.8%). Men had higher education and higher household income than women. Compared to men, women had older age, lower systolic and diastolic blood pressure, fasting plasma glucose (FPG), triglyceride, and higher HDL-C and LDL-C levels. Women had lower energy, protein and fat intake, and higher carbohydrate and fiber intake than men. Women had lower UACR, lower rates of current drinking, smoking, and albuminuria (Supplementary Table 1).
Characteristics according to education and household income level in men
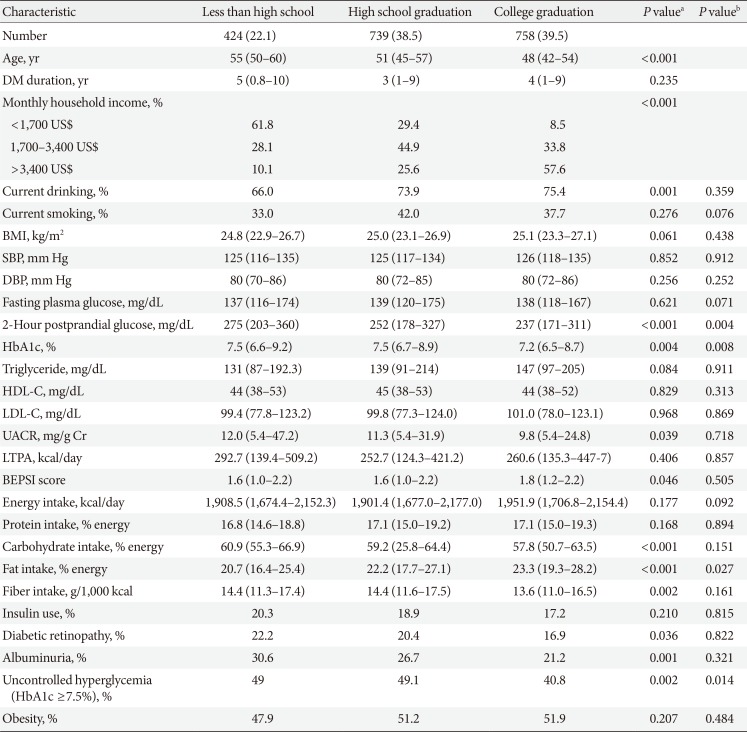
In men, 424 (22.1%) had an education level of less than high school, 739 of high school graduation (38.5%), and 758 of college graduation (39.5%). Higher education level was associated with younger age, higher income, more current drinking, and lower 2-hour postprandial glucose (PPG), HbA1c, and UACR. Patients with higher education level had a higher stress level, higher fat intake, and lower carbohydrate and fiber intake. There was no significant association between education level and leisure time physical activity, current smoking, or medication use in men. Those with higher education level had lower rates of diabetic retinopathy, albuminuria, and uncontrolled hyperglycemia (HbA1c ≥7.5%). After adjustment for age, diabetes duration, and household income level, higher education level was significantly associated with lower 2-hour PPG and HbA1c level and higher fat intake and lower rate of uncontrolled hyperglycemia (Table 1).
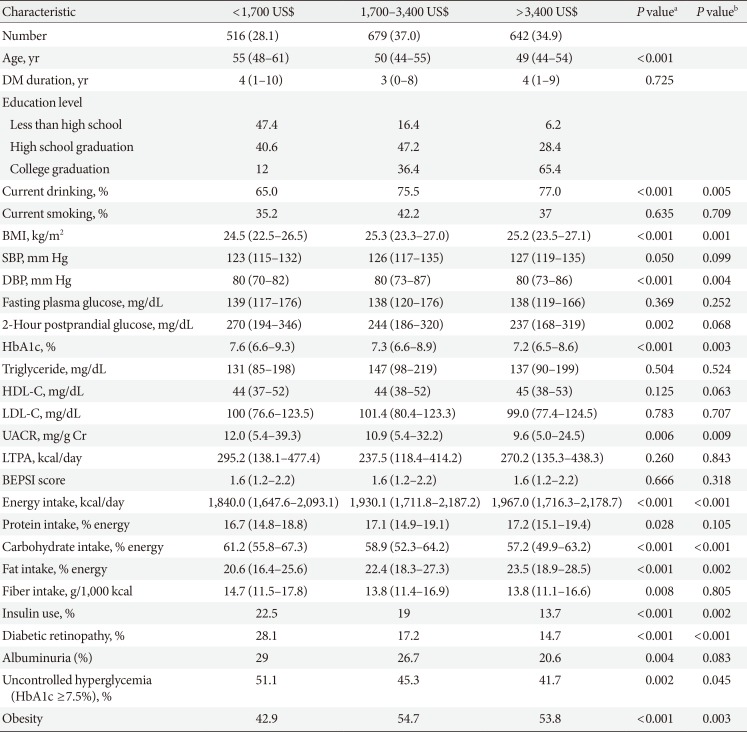
In men, 516 (28.1%) had a household income of <2 million KRW, 679 (37.0%) had an income of 2 million to 4 million KRW, and 642 (34.9%) had a household income of >4 million KRW. Higher income level was associated with younger age, higher education level, more current drinking, higher BMI and diastolic blood pressure, and lower 2-hour PPG, HbA1c, and UACR. Patients with higher household income had higher intake of energy, protein, and fat and a lower intake of carbohydrate and fiber. Patients with higher household income had less use of insulin, while statin use was more prevalent. Higher household income was associated with a higher rate of obesity and lower prevalence of diabetic retinopathy, albuminuria, and uncontrolled hyperglycemia. After adjustment for age, diabetes duration, and education level, higher household income level was significantly associated with higher current drinking rate, higher BMI and diastolic blood pressure, and lower HbA1c and UACR. Associations between income and protein intake, fiber intake, and albuminuria were not significant after adjustment, while associations between income and energy intake, carbohydrate and fat intake, use of insulin and statin, presence of diabetic retinopathy, and uncontrolled hyperglycemia and obesity remained significant (Table 2).
Characteristics according to education and household income level in women
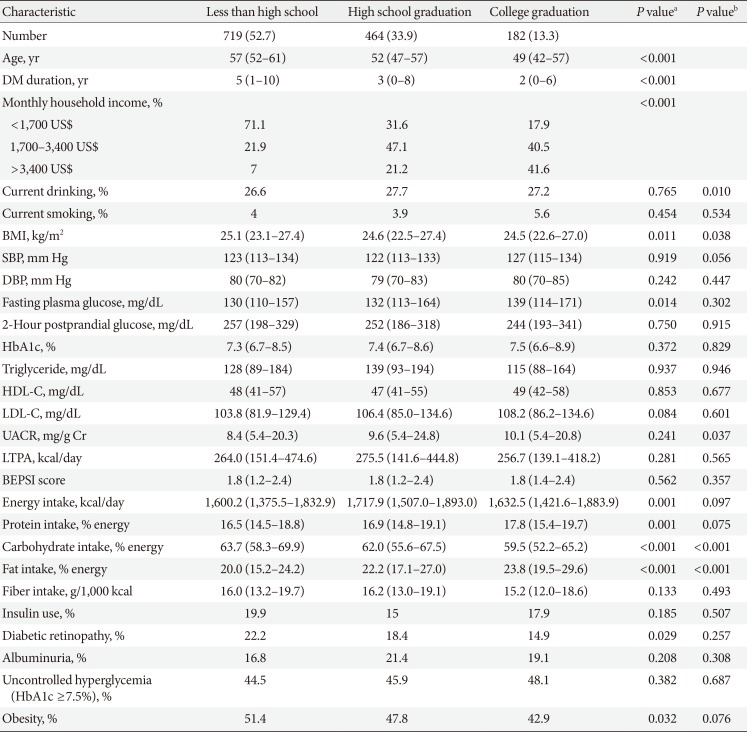
In women, 719 (52.7%) had an education level of less than high school, 464 of high school graduation (33.9%), and 182 of college graduation (13.3%). Those with higher education level had younger age, shorter diabetes duration, higher household income, lower BMI, and higher FPG level. Higher education level was associated with higher energy, protein, and fat intake and lower carbohydrate intake. Higher education level was associated with lower use of sulfonylurea and renin angiotensin aldosterone system inhibitors (angiotensin converting enzyme inhibitors or angiotensin receptor blocker) and lower prevalence of diabetic retinopathy and obesity. After adjustment for age, diabetes duration, and household income level, higher education level was significantly associated with higher rate of current drinking, lower BMI, higher UACR, lower carbohydrate intake, and higher fat intake. The associations between household income and medication use, diabetic retinopathy, and obesity were attenuated after adjustment (Table 3).
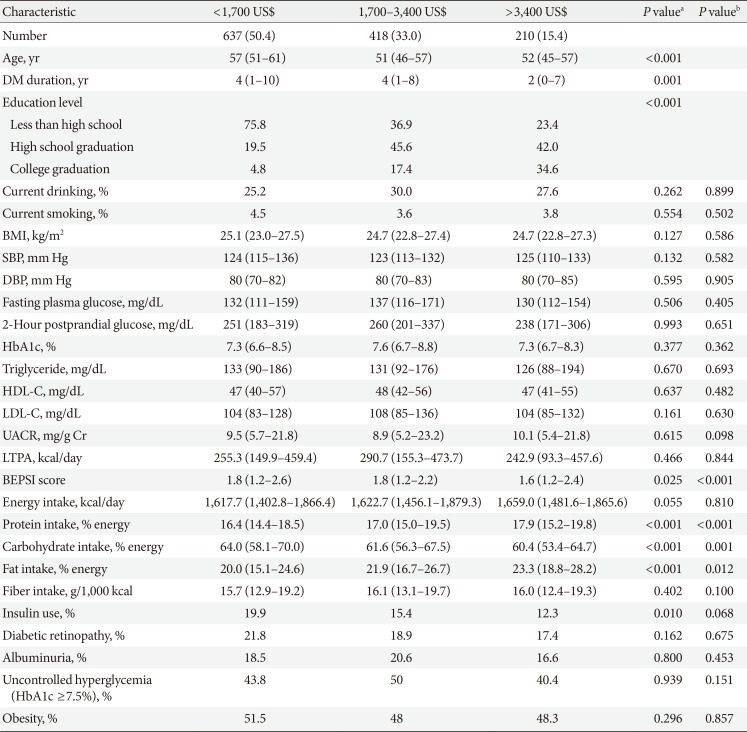
In women, 637 (50.4%) had an income level of <2,000,000 KRW, 418 (33%) had an income level of 2,000,000 to 4,000,000 KRW, and 210 (15.4%) had an income level of >4,000,000 KRW. Higher income level was associated with younger age, shorter diabetes duration, higher education attainment, lower stress level, higher protein and fat intake, lower carbohydrate intake, and less insulin use. After adjustment for age, diabetes duration, and education level, patients with higher household income was significantly associated with lower stress level, higher protein and fat intake, and lower carbohydrate intake (Table 4). The higher stress level in lower-income patients was significant after further adjustment for current drinking, smoking, energy intake, carbohydrate intake, fat intake, and insulin use (ρ=−0.093, P=0.004 by partial spearman correlation analysis).
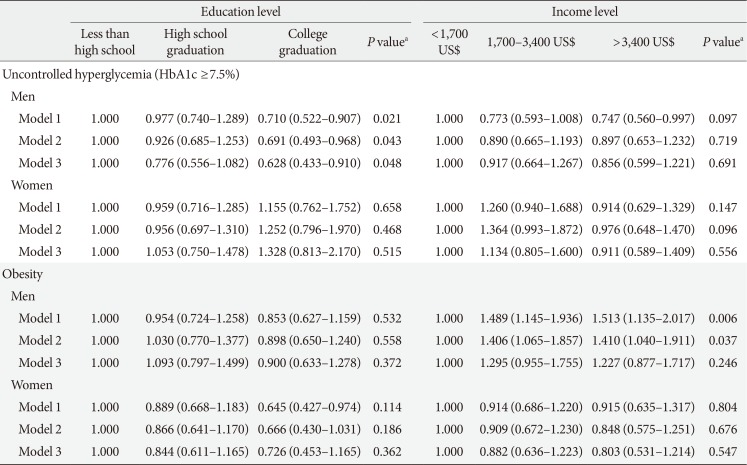
SES and uncontrolled hyperglycemia, obesity, and retinopathy
Since the prevalence of uncontrolled hyperglycemia, obesity, and diabetic retinopathy were significantly associated with SES in men, the association was evaluated with further adjustment for confounding factors. Logistic regression analysis, after adjusting for education or income level, age, diabetes duration, smoking, and drinking (Model 1), showed that lower education level conferred a significant risk of uncontrolled hyperglycemia in men. The highest education level (college graduation) was associated with 29% lower odds of having uncontrolled hyperglycemia compared with the lowest education level (less than high school) (95% confidence interval [CI], 0.52 to 0.97; Ptrend=0.021) (Table 5). After further adjustment for insulin use, energy intake, and carbohydrate and fat intake (Model 3), lower education level maintained its significance as a risk factor of uncontrolled hyperglycemia in men (odds ratio, 0.63; 95% CI, 0.43 to 0.91) for highest education level compared to lowest (Ptrend=0.048) (Table 5). In contrast, there was no significant association between SES and uncontrolled hyperglycemia in women.
Men with higher income level were found to have a greater risk of obesity after adjustment for age, duration, current smoking, current drinking, and education level (Model 1). A household income of >4,000,000 KRW was associated with a 1.51-fold increase in the odds of obesity compared to a household income of <2,000,000 KRW (95% CI, 1.14 to 2.02; Ptrend=0.006). This association was significant after further adjustment for insulin use (Model 2) but was attenuated after further adjustment for dietary factors (Model 3) (Table 5). In women, there were no significant association between SES and obesity.
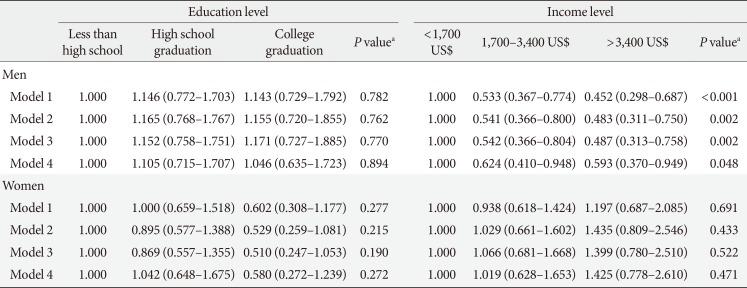
For diabetic retinopathy, men with lower income level showed a higher risk for having diabetic retinopathy after adjustment for age, duration, education level, current smoking, and drinking (Model 1, Ptrend<0.001). After further adjustment for insulin use (Model 2), HbA1c, systolic blood pressure, diastolic blood pressure (Model 3), energy intake, and carbohydrate and fat intake (Model 4), this association remained significant. Compared to an income of <2,000,000 KRW, an income of 2,000,000 to 4,000,000 KRW, and >4,000,000 KRW were associated with a 38% and 41%, respectively, lower odds of having diabetic retinopathy after adjustment (Model 4, Ptrend=0.048) (Table 6). For women, there was no significant association between SES and diabetic retinopathy.
DISCUSSION
The current study evaluated the role of SES on health behaviors, clinical parameters, and diabetic complications in Korean men and women with T2DM. Lower income and lower education were closely related, and older age was associated with low SES in both men and women. In men, lower education level was associated with uncontrolled hyperglycemia, and lower household income was associated with a significantly increased risk of having diabetic retinopathy after adjustment for potential confounding factors. While higher income was associated with higher BMI and obesity in men, this association was attenuated after adjustment for dietary intake. Women and men with lower income and education level had higher carbohydrate and lower fat intake. In women, lower household income was associated with higher stress level.
Good comprehensive management, including glycemic control, blood pressure control, lipid management, and other risk factor management, is crucial for the prevention and management of diabetes-related complications and outcomes [23]. Diabetes is defined by hyperglycemia, and glycemic control is central to diabetes management. Intensive glycemic control significantly decreases rates of microvascular complications in patients with T2DM [24]. Many studies have evaluated whether social deprivation in people with T2DM is linked to poor glycemic control [25]. Some studies have shown that social deprivation is linked to poor glycemic control [102627], while other studies have not shown this association [9122829]. In Korean men with T2DM, social deprivation (lower income and lower education attainment) was associated with a higher HbA1c level. Lower education level played a more significant role than lower income level in men. Korean men with diabetes in the highest education level had 37% lower odds of having uncontrolled hyperglycemia compared to those in the lowest education level after adjustment for multiple possible confounding factors. Among the SES factors, education level can capture the transition from parental SES to adult SES, reflecting material and intellectual resources of family origin. The skill and knowledge attained through education may affect the receptiveness to health information and appropriate communication with healthcare services that will be important for maintaining good glycemic control [530]. On the contrary, there was no significant association between social deprivation and glycemic control in women, showing a different role for SES on glycemic control according to different genders.
Socioeconomic factors differentially affected BMI and obesity in men and women. For men, higher income level was associated with higher BMI, and the odds of being obese were significantly increased by higher income level. The highest income level was associated with 41% increased odds of being obese compared to the lowest income level after adjustment for age, diabetes duration, smoking, drinking, education level, and insulin use. This association was attenuated after further adjustment for dietary intake of energy, carbohydrate, and fat, suggesting a role for dietary factors for this association. In women, higher education was significantly associated with lower BMI after adjustment for age, diabetes duration, and income level. But, although there was a significant association between education level and odds of being obese in women without adjustment, this association was attenuated after adjusting for possible confounding factors. Our finding contrasts with many reports from developed Western countries, showing that in both men and women, low SES is associated with higher BMI and obesity [910]. The different association between SES and obesity in men and women seen in patients with diabetes is similar to that of the general Korean population. Analysis of the Korean National Health and Nutritional Examination Survey data have shown that in Korean men, income but not education showed a slight positive association with BMI, and in Korean women, education, but not income, was inversely associated with both obesity and BMI. These relationships were attenuated after adjusting for health-related behavioral factors [31].
Diabetic retinopathy was associated with lower income in men after adjusting for multiple confounding factors. This association was not seen in women. Previous studies have reported an inverse association between SES and prevalence of microvascular diabetes complications, especially retinopathy from other countries [32], while other studies have reported no association between SES and complications [12]. In Mexican-Americans with T2DM, low income was associated with a higher risk of proliferative retinopathy [32]. There is a possibility that a low income influenced preventive measures for diabetic retinopathy. It is also possible that a low income in men identifies a group with more difficulty managing their diabetes, having a higher rate of insulin use and diabetic retinopathy. There is also a possibility that diabetic retinopathy had a reverse influence that can lead to lower income in men. In a longitudinal study, Klein et al. [33] have shown that severe retinopathy led to unemployment in men in a Caucasian cohort.
Understanding the lifestyle and psychological factors that influence the association between SES and clinical outcomes is important, since interventions targeting these factors might help decrease disparities associated with SES in patients with diabetes. We have evaluated whether SES status is associated with different lifestyle factors and stress level. We have also adjusted for these factors to assess whether they play a role in the association between SES and clinical outcomes such as glycemic control, obesity, and diabetic complications. For dietary nutrient intake, there was a similar pattern seen in those with lower SES in men and women. The most significant difference was a lower fat intake and a higher carbohydrate intake in those with lower SES. There was no significant difference in smoking and leisure time physical activity according to SES in both men and women. Higher income in men and higher education in women were associated with a higher rate of current drinking. Lower income in women was associated with a higher level of stress. The association between obesity and income in men was attenuated by adjusting for dietary intake of fat and carbohydrate, suggesting a role for dietary factors. Since lower SES and its association with uncontrolled hyperglycemia and diabetic retinopathy were still significant after adjusting for these factors, lower SES may play a significant role independent of the factors evaluated in this study.
Previous studies have shown that the influence SES has on diabetes risk is greater in women than in men [534]. But in Korean patients with diabetes, the role of SES on glycemic control or complications is seen only men but not in women. This may be due to the fact that, while SES-related factors play a role in the predisposition to T2DM, once an individual has developed T2DM, its severity may be related to other factors in women.
In Korea since 1989, a mandatory National Health Insurance Program has existed with only relatively few uninsured people. This universal coverage program is thought to minimize health inequalities for people with chronic diseases and economic deprivation [35]. Korea has undergone rapid economic growth and urbanization, and many nearby countries in Asia have also experienced or are currently experiencing this transition. Little data exist on the role of SES on health behaviors, intermediate outcomes such as glycemic control or obesity, and diabetic complications in people with T2DM from Asian countries that have been going through rapid economic growth during the previous decade and having steadily increasing numbers of patients with T2DM. The current results may also give insight about the role of socioeconomic deprivation for these countries.
The current study has some limitations. The current analysis does not provide a clear causal relationship between SES and clinical outcomes because of its cross-sectional design. However, since education level usually is established earlier in life, there is a low possibility of reverse causality for education level being influenced by other current clinical factors. Another limitation is that the population included in the current study is mainly from tertiary hospitals that are academically affiliated. A previous study from Germany has shown that the influence of socioeconomic deprivation on higher HbA1c was attenuated after treatment and education in a tertiary care center [36]. Therefore, there is a possibility that the unfavorable influence of socioeconomic deprivation may have been diluted in our study. However, the findings of our study showing that socioeconomic deprivation is associated with worse glycemic control in men with lower education level and more diabetic retinopathy in men with lower income can give insight to the current influence of SES in Korea and other countries with similar economic growth and health systems. Efforts to diminish inequalities for men with lower education and income should be continuously implemented.
 XML Download