

 PDF
PDF ePub
ePub Citation
 Print
Print


INTRODUCTION
Erythrocytes play a crucial role in the transport of oxygen and carbon dioxide via the blood flow through the circulatory system. One of the unique capabilities of erythrocytes is that they are extremely deformable as they progressively elongate under shear stress and form ellipsoids with their long axis aligned with the flow. Thus erythrocytes are capable of entering and transiting blood capillaries, which are narrower than the diameter of a resting erythrocyte [1]. Hemorheologic abnormalities have been observed in various clinical situations including diabetes, ischemic heart diseases (IHDs), hypertension, etc. [2345], and many physicians have been trying to apply them to various clinical fields. There are many hemorheologic indices including the plasma viscosity, hematocrit, fibrinogen, erythrocyte deformability (ED), and critical shear stress (CSS).
Of those, the CSS is defined as the minimum shear stress required for dispersing the aggregates, and is one of the red blood cell (RBC) aggregation indices. A higher value of the CSS might be associated with increased thrombosis as a trigger for the rupture of a vulnerable atherosclerotic plaque in acute coronary syndrome [36]. Diabetes, meanwhile, affects the RBC function through an interaction with its membrane and intracellular constituents. ED has been demonstrated to be impaired in diabetes, especially in the case of coexisting microvascular complications. Moreover, there is increasing evidence that diabetes is associated with a pathological hemorheologic alteration, which might contribute to an impaired coronary blood flow in coronary artery disease (CAD) [78]. However, little is known about the association to hemorheologic indices and acute myocardial infarctions (AMIs) in the situation of type 2 diabetes mellitus (T2DM). The purpose of this study was to demonstrate the changes of hemorheologic environment inside of blood using hemorheologic parameters, especially the ED and CSS with versus without AMI in patients with T2DM.
METHODS
Study design
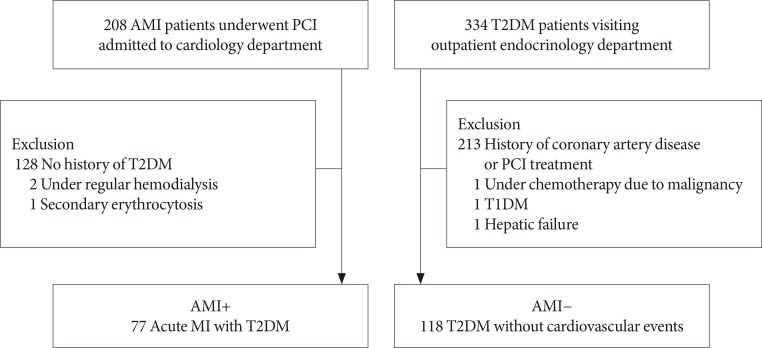
A total 542 patients (study group [AMI+, n=208] from cardiology division and control group [AMI−, n=334] from endocrinology division) were enrolled in this study from March to December 2014. We excluded some patients who were under clinical situations that might directly influence the ED (secondary erythrocytosis [n=1], under chemotherapy due to malignancy [n=1], type 1 diabetes mellitus [T1DM; n=1], under regular hemodialysis [n=2], hepatic failure [n=1]). All patients were classified into two groups according to the presence of an AMI (AMI+) and those without it (AMI−). Of AMI+, subjects without history of T2DM (n=128) were excluded. Of AMI−, if any history of IHD or previous coronary intervention such as coronary balloon angioplasty and/or a coronary stent implantation, was present, they (n=116) were also excluded due to clarify the hemorheologic effect on newly developed IHD (77 patients in AMI+ and 118 patients in AMI−) (Fig. 1). Institutional Review Board (IRB 2014-01-494) approved this study from Yeungnam University Medical Center and written informed consent was acquired from all patients.
Diabetes was diagnosed by demonstrating any one of the following: fasting plasma glucose level ≥126 mg/dL, plasma glucose at 2 hours after oral glucose load ≥200 mg/dL, and random plasma glucose ≥200 mg/dL with classic hyperglycemic symptoms. Classification of T1DM and T2DM was based on integration of clinical symptoms, insulin antibody, absolute insulin deficiency, and family history [9]. An MI was defined as the presence of at least two of the following: anginal pain, elevation of the creatine kinase concentration greater than three times the upper limit of normal, and/or electrocardiographic changes suggesting an MI [10].
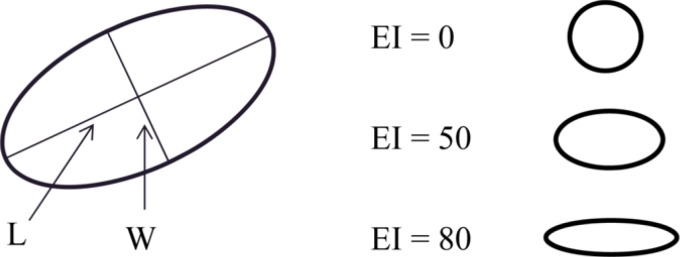
A blood sample was taken during the first visit to the endocrinology outpatient department in the cases of AMI−. In the cases of AMI+, the laboratory examinations of the blood samples were performed anytime within 3 days prior to invasive coronary intervention procedures after being admitted to the intensive care unit or emergency department. In case of individual situation which early coronary intervention was needed to be done, blood sample was taken just before coronary intervention. We implanted second generation drug-eluting stents in all patients classified as being in the AMI+. The hemorheologic parameters were analyzed by routine laboratory assays. The ED, which was quantified by an elongation index (EI; measured at a constant shear stress of 3 pascal [Pa] %), and the CSS were measured by a microfluidic ektacytometer (Rheoscan-D®; Rheo-Meditech, Seoul, Korea) using a disposable kit [11], and the other hemorheologic parameters were compared between the two groups. The EI was calculated from the dimensions of the major (L) and minor (W) axes of an ellipsoid at 3 Pa, EI=[L−W]/[L+W]; this is expressed as a percentage (Fig. 2). The homeostatic model assessment of insulin resistance (HOMA-IR), as a marker of insulin resistance, was calculated using the following formula: HOMA-IR=fasting plasma insulin (µU/mL)×fasting plasma glucose (mg/dL)/405; and the homeostatic model assessment of β-cell function (HOMA-β), which means the function of the β-cells of the pancreas, was calculated as the fasting plasma insulin (µU/mL)×360/(fasting glucose [mg/dL]−63) [12].
The current medications at the time of the blood sampling were also analyzed because some medications, releasing nitric oxide (NO) or modulating the bioactivity of NO, could influence the value of the EI by increasing the NO concentration in the blood [1314]. The structural and functional echocardiographic parameters including the left ventricular ejection fraction (LVEF) were measured by transthoracic echocardiography during hospitalization.
Statistics
The results are reported as the mean±standard deviation for numerical variables and as frequencies and percentages for categorical variables. The independent t-test was used to compare the group continuous variables and the chi-square test or Fisher exact test was used to compare the categorical variables. A multivariate linear regression analysis was used to demonstrate any significant factors determining the EI and CSS (variable were as follows; sex, age, hypertension, history of cerebrovascular accident, smoking, body mass index, systolic blood pressure, pharmacologic status, LVEF, E/E′ ratio, white blood cell, hemoglobin, red cell distribution width, mean corpuscular volume, mean corpuscular hemoglobin concentration, platelet count, high-sensitivity C-reactive protein, total protein, aspartate transaminase, alanine transaminase, estimated glomerular filtration rate [GFR], glycosylated hemoglobin [HbA1c], total cholesterol, cystatin C, and insulin resistance/sensitivity indices). IBM SPSS version 19.0 (IBM Co., Armonk, NY, USA) was used for the statistical analysis and statistical significance was accepted for P<0.05.
RESULTS
Baseline characteristics
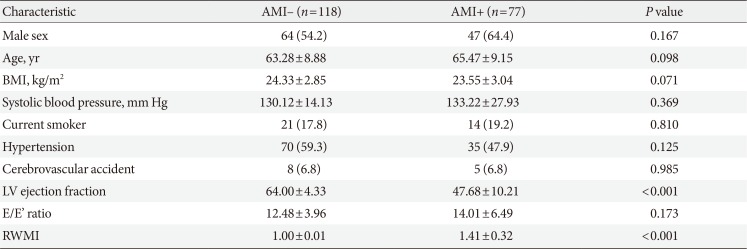
Baseline characteristics were shown in Table 1. Sixty percent of the population was male with the mean age of 64 years old. There were no significant differences between the two groups except echocardiographic parameters which seemed to be natural consequences caused by IHD. The left ventricular systolic function (LVEF: 47.68%±10.21% in AMI+ vs. 64.00%±4.33% in AMI−, P<0.001) was lower and the regional wall motion index (1.41±0.32 in AMI+ vs. 1.00±0.01 in AMI−, P<0.001) was higher in AMI+.
Laboratory findings and medical treatment at baseline
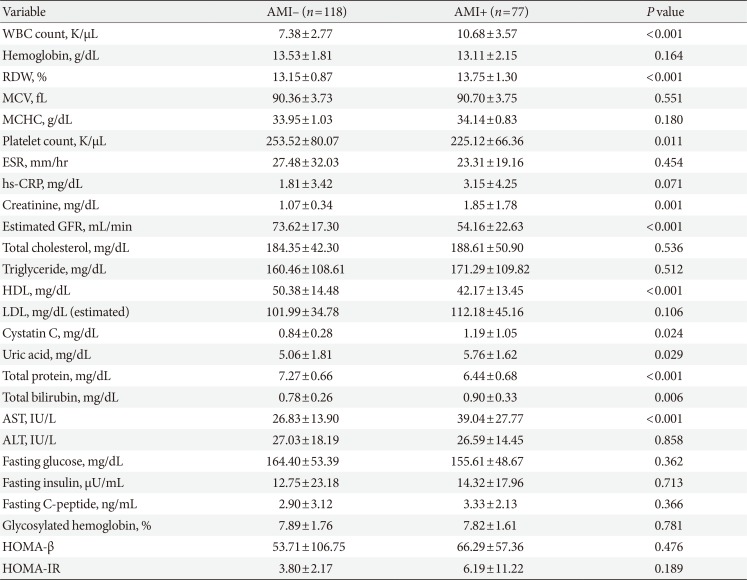
The renal function, represented by the serum creatinine (1.85±1.78 mg/dL in AMI+ vs. 1.07±0.34 mg/dL in AMI−, P<0.001) and estimated GFR (54.16±23.63 mL/min in AMI+ vs. 73.62±17.30 mL/min in AMI−, P<0.001), was decreased in AMI+. The total bilirubin (0.90±0.33 mg/dL in AMI+ vs. 0.78±0.26 mg/dL in AMI−, P=0.006) and aspartate transaminase (39.04±27.77 IU/L in AMI+ vs. 26.83±13.90 IU/L in AMI−, P<0.001) were higher in the AMI+. The blood sugar level, insulin level during a fasting state, and HbA1c level did not significantly differ between the two groups, as well as the parameters related with insulin resistance (HOMA-IR and HOMA-β) (Table 2).
The use of insulin (15.6% of AMI+ and 28.0% of AMI−, P=0.045) and metformin (22.1% of AMI+ and 55.1% of AMI−, P<0.001) were significantly different between two groups. Another detailed medical treatment at baseline was described in Supplementary Table 1.
Hemorheologic findings
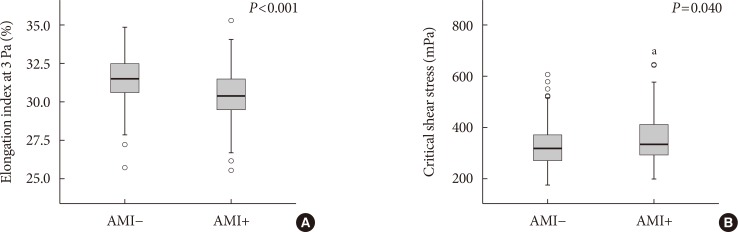
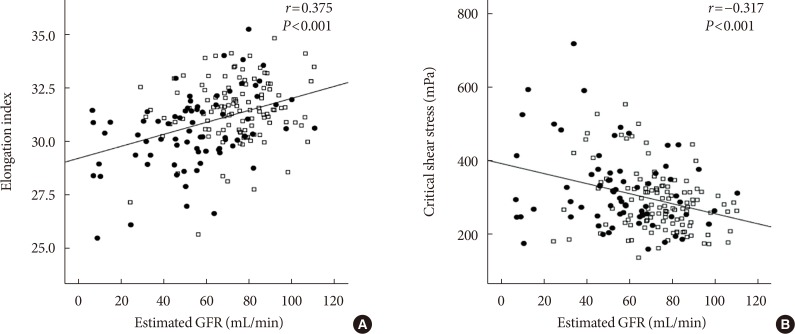
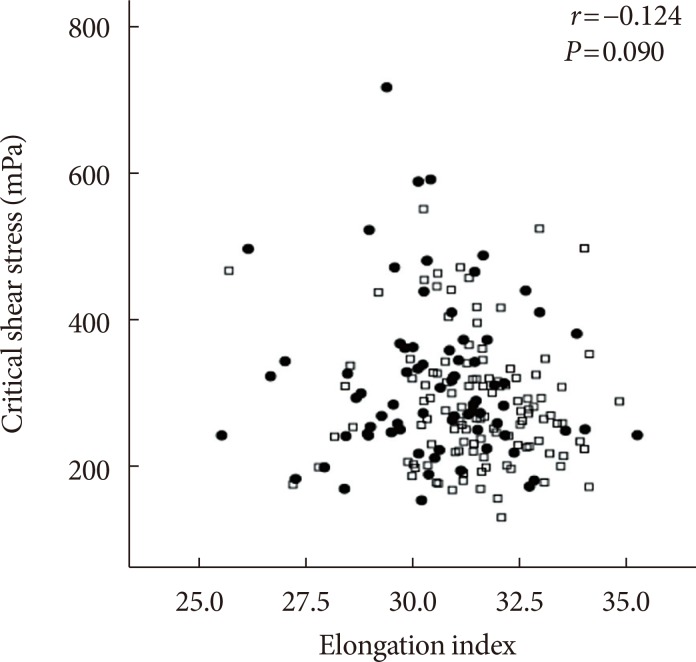
Red cell distribution width (13.75%±1.30% in AMI+ vs. 13.15%± 0.87% in AMI−, P<0.001) was higher in AMI+. The number of platelets was lower in the AMI+ (225.12±66.36 K/µL in AMI+ vs. 253.52±80.07 K/µL in AMI−, P=0.011). The EI at 3 Pa was significantly lower (30.44%±1.77% in AMI+ vs. 31.47%±1.48% in AMI−, P<0.001) (Fig. 3A), while the level of CSS was significantly higher in AMI+ (316.13±108.20 mPa in AMI+ vs. 286.80±85.34 mPa in AMI−, P=0.040) (Fig. 3B). On multiple linear regression analysis, the level of CSS was significantly related to the erythrocyte sedimentation rate (ESR; R2=0.497, P<0.001) and the use of a dipeptidyl peptidase-4 (DPP-4) inhibitor (R2=0.574, P=0.048) (Table 3). Estimated GFR was correlated well with EI (r=0.375, P<0.001) but inversely correlated with the level of CSS (r=−0.317, P<0.001) (Fig. 4). No correlation was observed between EI and the level of CSS (r=−0.124, P=0.090) (Fig. 5).
DISCUSSION
This study demonstrated that diabetic subjects with AMI had worse hemorheologic environment through reduced ED and CSS examined by ektacytometer. Moreover, increased CSS was associated with higher ESR and use of DPP-4 inhibitors might decrease the level of CSS.
It is already well known that progressive worsening of the ED by an impaired glucose tolerance has been found to be an indicator of microangiopathy [81516]. These complications were caused by the composition of various mechanisms as follows: progressive accumulation of HbA1c, inhibition of NO-mediated vasodilation, and endothelial injury due to an increased release of free fatty acids and other adipocytokines [17]. Endothelial dysfunction, vascular inflammation, an impaired vascular function, and the prothrombotic status [1819] provoked by the multiple and complex mechanisms mentioned above might be thought to provoke coronary arterial events.
Moreover, in large vessels like epicardial coronary arteries, the blood behaves as a continuous liquid, and the dominant factor of the blood flow is its viscosity. The blood viscosity in large vessels mainly depends on the hematocrit, plasma viscosity, erythrocyte aggregation, and deformability. In addition, since there is a constant varying of the blood flow, perfusion pressure, and shear rate, depending on the cardiac cycle, the coronary vessel system is regarded as a special part of the circulation [20]. So it can be inferred that hemorheologic factors and hemodynamic factors play an important role in the development of CAD. Especially, an altered EI could serve as a trigger for the rupture of a vulnerable atherosclerotic plaque, which would aggravate a thrombus formation that would lead to a clinical syndrome like an AMI, since several studies have proven a connection between a reduced ED and coronary vascular complications [321]. CSS, one of the erythrocyte aggregation indices, was statistically higher in the AMI group, which meant that a higher power to disperse the RBCs is needed in that situation. It is a major determinant of the blood viscosity along with the ED.
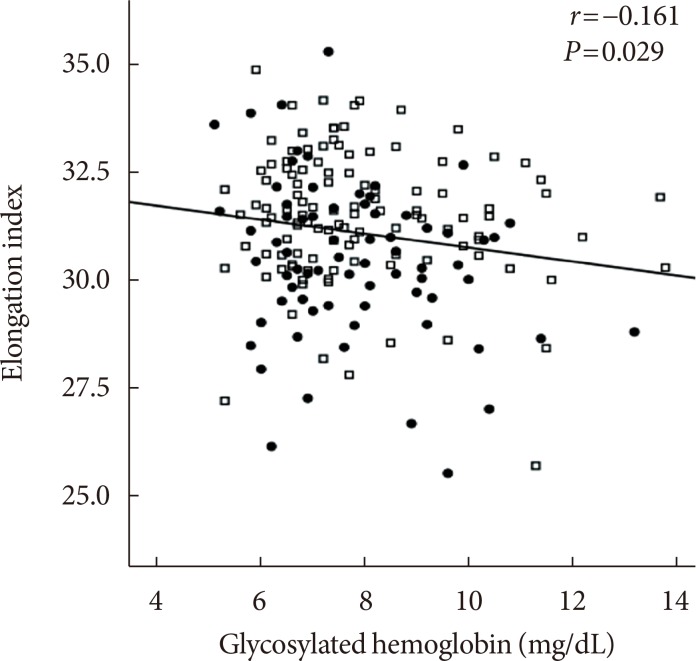
The blood concentration of HbA1c affects the alteration in the erythrocyte structure by oxidative stress, which results in a hemorheologic disturbance like a decrease in the EI even for a relatively short exposure time [1522]. As an indicator of the blood sugar control for the last 3 months, the HbA1c was also inversely correlated with the EI in this study, and was consistent with the previous studies [8]. The link between the EI and renal function already exhibited an agreement with an earlier study [23] in which there was a progressive increase in the EI along with a progression of the renal impairment (Fig. 5).
Diverse factors were related to the CSS. One of them, fibrinogen, has a strong effect on the CSS [24], causing the CSS to increase proportional to the fibrinogen concentration. On the other hand, the CSS is a hematocrit-independent indicator [25]. To date, there have been no data about the relationship between the CSS and HbA1c. On the contrary, regarding the relationship of the above EI and HbA1c, the CSS was presumed to have a positive correlation with the HbA1c in our study. Recently, Xue et al. [24] demonstrated that a reduced ED and increased fibrinogen levels play a synergistic role in an increasing CSS. However, there was no definite positive correlation between the CSS and EI, but there was a tendency observed in our study, which could be overcome if there was a larger population than in this study (Fig. 6).
A higher ESR was associated with higher CSS and use of DPP-4 inhibitors might decrease the level of CSS in our study. Beyond the relationship already known between the ESR and CSS, DPP-4 inhibitors also have a protective effect on cardiovascular diseases through various factors including insulin resistance, oxidative stress, immunity modulation, and anti-apoptotic properties in the cardiovascular system [2627].
There is accumulating evidence of a relationship between HbA1c and microangiopathy; however, we did not consider coexisting diabetic microvascular complications in these patients. We did not analysis the other factors including the hyperviscosity and fibrinogen, which might have played a significant role in the erythrocyte aggregation such as CSS.
In conclusion, the ED was reduced in the patients with an AMI and T2DM, while the CSS was higher in the same group. The ED and CSS might be one of the possible mechanisms of the development of an AMI in patients with T2DM. An evaluation of the hemorheologic parameters, including the EI and CSS, may provide valuable supplementary information for the evaluation and management of IHD in T2DM.

 XML Download