

 PDF
PDF ePub
ePub Citation
 Print
Print


INTRODUCTION
Global rates of diabetes mellitus have reached epidemic proportions and are associated with an ever-growing health and socioeconomic burden. The World Health Organization (WHO) estimates that the number of diabetic individuals rose from 108 million in 1980 to 422 million in 2014, whereas low- and middle-income countries have experienced a particularly high increase in diabetes prevalence [1]. With this enormous increase in global rates of diabetes also rises the economic cost, e.g., US data show that the total economic cost of diagnosed cases of diabetes amounted to USD 174 billion in 2007 and rose to 245 billion in 2012 [2]. A large part of the growing diabetes rates can be explained by the enormous increase in the global burden of obesity [3]. According to data from WHO, more than 1.9 billion adults were overweight in 2014; of these 600 million were obese [4]. Diabetes is associated with a significantly increased risk for all-cause mortality [5]. From the pathological perspective, there are two main types of diabetes: type 1 diabetes mellitus (T1DM), which is characterized by pancreatic β-cell secretion deficiency, and type 2 diabetes mellitus (T2DM), which is preceded by prediabetes in most individuals [6], and is caused by a complex interplay between insulin resistance and β-cell dysfunction [7].
Increased body adiposity leads to a greater risk of developing T2DM even with at normal body mass index (BMI) [8]. Dysfunction at the cellular level within the adipose tissue has been linked to insulin resistance and T2DM [9]. It is now well-established that adipose tissue is a metabolically highly active organ, secreting a plethora of molecules, with more than 600 identified so far [10]. These biologically active molecules, collectively known as adipocytokines, have been suggested to play a significant role in insulin resistance [11], β-cell dysfunction [12], as well as the occurrence of diabetes [13] and associated comorbidities [1415].
Omega-3 fatty acids, a group of polyunsaturated fatty acids, have gained increasing popularity among general population and clinicians for their suggested positive modulatory effects on a variety of physiological function. Eicosapentaenoic acid (EPA) and docosahexaenoic acid (DHA) represent the two major types of omega-3 fatty acids. EPA and DHA are mainly gained from seafood consumption, such as from fatty fish. These fatty acids are essential, as they cannot be produced by the human body, but have to be obtained by consuming marine food, such as fatty fish and fish oil. Supplementing omega- 3 fatty acids was estimated to costs of 34.7 billion USD in 2016 [16]. These supplements have been used in managing a variety of clinical conditions and are believed to have a plethora of health benefits [17].
Regarding the effects of omega-3 fatty acids on the risk of developing diabetes, studies have shown mixed results [1819]. Positive effects have been reported in relation to diabetic complications [20]. Omega-3 fatty acids have also been associated with favourable outcomes on adiponectin and leptin [21] and a range of inflammatory cytokines [22].
Given their ever-increasing popularity and the emerging evidence suggesting positive modulatory effects on signalling molecules, including adypocytokines, it is of high relevance to investigate the influence of omega-3 fatty acid supplementation on adipocytokine plasma concentration in prediabetic and diabetic individuals.
METHODS
Literature search
PubMed, Medline, EMBASE, Scopus, Web of Science, Google Scholar, Cochrane Trial Register, WHO Clinical Trial Registry Platform, and Clinicaltrial.gov Registry were used to systematically search for randomized controlled trials. We did not use any language restriction in the search. The literature was searched from inception to August 1, 2017. Key words included, among others: fatty acids, omega-3, fish oil, EPA, DHA, adipokines, adipocytokines, leptin, adiponectin, and clinical trial. In addition, related articles in electronic databases were also searched. Retrieved articles, systematic reviews and meta-analyses were searched manually in order to identify any overlooked additional potentially relevant trials.
Study selection
We used the following inclusion criteria: (1) intervention involving supplementation with EPA, DHA, both EPA and DHA, and fish oil; (2) randomized controlled trials with parallel or cross-over design; (3) involving adult (≥18 years) human subjects diagnosed with any of the following clinical conditions: insulin resistance, impaired glucose tolerance, impaired fasting glucose, or T2DM; (4) a minimum of 4 weeks intervention period; (5) encompassed the evaluation the outcome of interest to this meta-analysis; and (6) reported post-intervention mean values or change from baseline values with standard deviation (SD).
We applied the following exclusion criteria: (1) non-interventional studies, (2) uncontrolled studies, (3) lack of sufficient information on baseline or follow-up plasma concentration values of the selected adipocytokines, and (4) reviews, conference abstracts, commentaries, case reports, or duplicate publication from the same study.
Risk of bias assessment
We used Cochrane Collaboration's tool for assessing the risk of bias in randomized trials in order to assess the risk of bias of included studies (low, unclear, high) with respect to following study characteristics: random sequence generation (selection bias), allocation concealment (selection bias), blinding of participants and personnel (performance bias), blinding of outcome assessment (detection bias), incomplete outcome data (attrition bias), selective reporting (reporting bias), and others [23].
Data extraction and statistical analysis
From every study included, the two authors independently extracted the following information into a data spread sheet: family name of the first author of the study; publication year; characteristics of trial participants (number, age and gender); duration of the intervention; definition of the intervention and respective control; and assessed outcomes.
We extracted values of group means and corresponding SD. Where medians or interquartile ranges were reported instead of means, we used formulas proposed by Hozo et al. [24] to calculate the means and SD values. Where standard error of the mean (SEM) was only reported, SD was estimated using the following formula: SD=SEM×square root (n), where n is the number of subjects. The primary end point was change in circulating levels of adipocytokines, which were reported as changes between the values of arithmetic means at the end of the study-baseline [25]. SD of mean differences (MDs) were calculated as SD=square root [(SDbaseline)2+(SDend of treatment)2−(2r×SDbaseline×SDend of treatment)] for each group, assuming that r=0.5 [26].
We used the software Review Manager 5.3 as provided by the Cochrane Collaboration [27]. We applied the inverse-variance, random effects model of DerSimonian and Laird [28] to calculate the pooled estimates of the weighted MDs between the intervention and control groups, because this model incorporates between-study variability and provides a more conservative estimate of the average effect size.
The standard chi-square test was used as a statistical measure of heterogeneity between the different studies. The I2 value was applied to determine the magnitude of inconsistency [29], calculated as I2=[(Q−df)]/Q×100%, Q being the χ2 value and df the corresponding degree of freedom. An I2 value of greater than 50.0% was defined as a cut-off to determine considerable heterogeneity between the included studies.
Sensitivity analysis through the leave-one-out method was employed to explore whether the dependency of the results on individual studies when these reported substantially different effect-sizes than the other studies.
We used the funnel-plot method to test for publication bias. In this method, the difference in mean changes were plotted against their standard errors to measure the precision of the studies. Where there was any disagreement between the authors, the data were revisited and agreed on by discussion by the authors.
RESULTS
Literature search and study characteristics
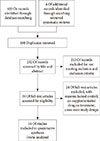
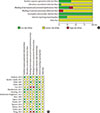
After applying all the selection criteria, 15 studies were included in the systematic review [303132333435363738394041424344]. These studies reported the following outcomes: plasminogen-activator inhibitor 1 (PAI-1), adiponectin, leptin, resistin, tumor necrosis factor α (TNF-α), and interleukin 6 (IL-6). One study [42] had a cross-over design, and could not be included in the quantitative synthesis (meta-analysis) in Review Manager; hence, 14 studies with parallel design were included in the meta-analysis [3031323334353637383940414344]. Fig. 1 shows a detailed overview of the search strategy. Fig. 2A represents the overall risk of bias summary according to the defined characteristics, and Fig. 2B provides an overview across all individual studies included in the systematic review.
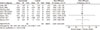
The studies included in the meta-analysis included a total of 29 treatment arms, comprising a total of 685 trial participants (Table 1). Most studies involved subjects with T2DM; Krebs et al. [33], Spencer et al. [41], and Wong et al. [44] enrolled patients with prediabetes. One study [33] was conducted only with female subjects, otherwise both sexes were represented. The trial duration ranged from 6 to 24 weeks. Interventions in most studies consisted of omega-3 supplementation alone, in two studies [3344] intended weight loss was a part of the intervention. Most studies used both EPA and DHA in the intervention, one study [30] used only EPA, and in one study EPA and DHA [38] were two different treatment arms, so that effect sizes were pooled separately.
Influence of omega-3 supplementation on plasma concentrations of adipocytokines
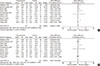
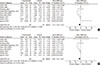
Two studies reported PAI-1 levels. Kabir et al. [32] used IU/mL as unit, and conversion was done to ng/mL [45]. Omega-3 supplementation did not significantly affect PAI-1 levels (MD, −11.47 ng/mL; 95% confidence interval [CI], −23.52 to 0.57; P=0.06, I2=11%) (Fig. 3).
Effect sizes for adiponectin were pooled from a total of 10 studies. Omega-3 supplementation significantly increased plasma adiponectin concentration (MD, 0.48 µg/mL; 95% CI, 0.27 to 0.68; P<0.00001, I2=98%) (Fig. 4A). For the sensitivity analysis, we eliminated Veleba et al. [43], because this study reported an effect which was significantly greater than that of other individual studies. No effects of omega-3 supplementation on adiponectin concentration were observed (MD, 0.00 µg/mL; 95% CI, −0.09 to 0.08; P=0.98, I2=85%) (Fig. 4B) in this sensitivity analysis.
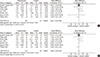
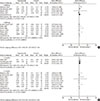
With regards to effects on resistin, omega-3 supplementation did not affect its levels in a statistically significant way (MD, −0.77 ng/mL; 95% CI, −2.44 to 0.97; P=0.4, I2=100%) (Fig. 5).
Supplementing omega-3 fatty acids did not significantly alter leptin levels (MD, −0.03 ng/mL; 95% CI, −0.10 to 0.04; P=0.37, I2=0%) (Fig. 6A). As the effect reported in Spencer et al. [41] was considerably different compared with that of other individual studies, we eliminated it from the analysis, this did result in a significant change in effect size (MD, −0.08 ng/mL; 95% CI, −0.49 to 0.34; P=0.72, I2=11%) (Fig. 6B).
Omega-3 supplementation also exerted an effect on plasma concentrations of inflammatory cytokines IL-6 and TNF-α. The effects on IL-6 did not reach statistical significance (MD, −0.10 pg/mL; 95% CI, −0.25 to 0.05; P=0.2, I2=21%) (Fig. 7), but TNF-α levels significantly reduced (MD, −1.71; 95% CI, −3.38 to −0.14; P=0.03, I2=86%) (Fig. 8A), this effect also remained after removing Spencer et al. [41] for the sensitivity analysis, as this was the only study which reported an increase in TNF-α levels in the primary analysis (MD, −2.01 pg/mL; 95% CI, −3.55 to −0.47; P=0.01, I2=87%) (Fig. 8B).
Subgroup-analysis
As adiponectin and TNF-α were the only two outcomes whose blood levels were significantly affected by omega-3 supplementation in the primary analysis and we found considerable study heterogeneity, we conducted a subgroup analysis by dose (low ≤2,000 mg, high >2,000 mg) and treatment duration (<12, ≥12 weeks) to investigate whether the effect of the intervention in these outcomes varied between the subgroups.
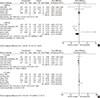
For adiponectin, omega-3 significantly increased its levels when supplemented in high dose (MD, 0.62 µg/mL; 95% CI, 0.40 to 0.85; P<0.00001, I2=99%); low-dose supplementation did not lead to significant changes (MD, 0.48 µg/mL; 95% CI, −0.73 to 1.69; P=0.44, I2=67%; test for subgroup differences: P=0.82, I2=0%) (Fig. 9A). As for treatment duration, we found significant effects in the subgroup ≥12 weeks (MD, 0.47 µg/mL; 95% CI, 0.26 to 0.68; P<0.00001, I2=99%), while shorter treatment duration did not produce statistically significant effects (MD, 0.73 µg/mL; 95% CI, −0.28 to 1.73; P=0.16, I2=0%; test for subgroup differences: P=0.62, I2=0%) (Fig. 9B).
For TNF-α, omega-3 did not significantly change the levels neither in the low-dose (MD, −0.04 pg/mL; 95% CI, −0.10 to 0.02; P=0.17, I2=0%) nor in the high-dose group (MD, −2.31 pg/mL; 95% CI, −5.55 to 0.93; P=0.16, I2=88%; test for subgroup differences: P=0.17, I2=46.9%) (Fig. 10A). Supplementing omega-3 for less than 12 weeks significantly reduced TNF-α levels (MD, −4.71 pg/mL; 95% CI, −6.01 to −3.41; P<0.00001, I2=0%); whilst no statistically significant effects were found with longer supplementation (MD, −0.16 pg/mL; 95% CI, −0.96 to 0.64; P=0.7, I2=46%; test for subgroup differences: P<0.00001, I2=97.1%) (Fig. 10B).
Publication bias
Visual inspection of funnel plots for adiponectin, leptin, IL-6, and TNF-α (Fig. 11) revealed a moderate asymmetry in all of the outcomes, so that a publication bias cannot be excluded and we cannot ascertain that a non-publication of negative or inconclusive data did not influence our meta-analysis.
DISCUSSION
To the best of our knowledge, this is the first meta-analysis to investigate the results of omega-3 supplementation on adipocytokine levels in prediabetic and diabetic individuals. We found that omega-3 supplementation has no statistically significant effects on levels of PAI-1, resistin, leptin, and IL-6. We found that omega-3 can significantly increase adiponectin levels, but study heterogeneity was very high in this analysis (I2=98%). Moreover, this effect was dependent on one individual study, as it completely disappeared once we conducted sensitivity analysis. Regarding TNF-α, omega-3 supplementation reduced its levels both in the primary as well in the sensitivity analysis, but with considerable study heterogeneity in both analyses. We conducted a subgroup analysis based on omega-3 dose and treatment duration for these two outcomes in order to elucidate whether the effects of omega-3 supplementation in the primary outcomes varied between the subgroups via a test of interaction (indicating effect modification). We found that for TNF-α, omega-3 supplementation has different effects in subgroups with different treatment durations while using 12 weeks as the cut-off value, i.e., there was significant effect modification based on treatment duration. Interestingly, lower treatment duration significantly reduced TNF-α levels as compared to longer treatment duration. We found no effect modification in the dose subgroup analysis for TNF-α levels, nor for dose or treatment duration for adiponectin levels.
PAI-1's associations with obesity and diabetes have been established in the 1980s [46], and it is nowadays well established that elevated levels of PAI-1 are associated with the development of T2DM [47] and cardiovascular events and mortality [48]. Intervention to reduce the levels of PAI-1 have therefore been recognized as a priority in this population [49].
Leptin could be righteously called the master hormone of all adipokines, because of the variety of physiological functions that it controls and they are all of great relevance in diabetes [50]. Body fat mass is the single most important determinant of leptin levels in individuals, but insulin resistance that occurs in T2DM was found to be associated with higher leptin levels independently of body fat mass [51]. Hyperleptinaemia is a marker of leptin resistance, a pathophysiological condition where tissues do not respond to leptin signaling, which further potentiates the metabolic and cardiovascular disarrangements that occur in face of diabetes [52]. Consequently, reducing blood leptin levels is suggested to ameliorate leptin sensitivity [53], but a recently conducted meta-analysis, which was not only constrained to prediabetic and diabetic individuals, found that moderate, but significant reduction in leptin levels was achieved with omega-3 fatty acid supplementation in non-obese individuals, whereas smaller and non-significant effects were observed in obese individuals [54], but the grade of reduction was greater than the one revealed in our analysis in both groups.
Adiponectin circulates in relatively high concentrations (µg/mL) as compared to other adipokines, and has unique physiological properties with a profound impact on glucose and fatty acid metabolism as well as the cardiovascular system, which has placed it in the center of interest of the scientific community. Hypoadiponectinaemia paradoxically occurs in obesity and diabetes, and due to its insulin-sensitizing and anti-inflammatory properties, increasing circulating levels of adiponectin is believed to result to improved metabolic and cardiovascular functions [55]. Our results are in line with those previously reported in meta-analysis [56] and narrative reviews [21]. Interestingly, the increase in adiponectin levels we observed was largely dependent on one study and there was unexplained study heterogeneity, as we could not infer effect modification neither to treatment duration nor omega-3 dose used. The unexplained heterogeneity in adiponectin levels was also found in previous meta-analysis [56].
Resistin is a relatively newly discovered adipocytokine which is suggested to exert very important effects that link obesity to insulin resistance and T2DM [57], and evidence also amounts with regards to its role in mechanisms leading to cardiovascular disease, including inflammation, endothelial dysfunction, thrombosis, angiogenesis, and smooth muscle function. Reducing the levels of resistin is therefore seen as a promising strategy [58]. To our knowledge, this is the first meta-analysis that investigated the effects of omega-3 supplementation on resistin, and even though the effect was non-significant with a very high degree of study heterogeneity, our results suggest a potential modulatory role of omega-3 fatty acids on this interesting adipocytokine.
TNF-α and IL-6 are one of the main proinflammatory cytokines that are also secreted to a large part from the adipose tissue which is infiltrated by macrophages and other immune cells and their levels are elevated in diabetic individuals, resulting to inflammation [59]. Inflammation not only contributes to the etiology of diabetes, but once the disease has set on, it aggravates its clinical course and is associated with a range of complications [60]. The reducing effects of omega-3 fatty acids on these two cytokines might be explained by their general anti-inflammatory properties [23]. The reduction in subclinical inflammation by supplementing EPA and DHA along with potential positive modulation of other physiological pathways that are brought about by changes in plasma concentrations of herein investigates cytokines may contribute to improved management of patients suffering from prediabetes or T2DM. Interestingly, our work identified that for TNF-α, treatment duration infers effect modification, where shorter treatment duration is associated with higher reductions in TNF-α levels.
However, our systematic review and meta-analysis has several limitations. In general, most studies which were included did not provide sufficient information to be able to assess the risk of bias across many of the pre-set out criteria. Based on the I2 measure of greater than 50%, substantial study heterogeneity was found across outcome parameters investigated. The population analyzed was also heterogeneous, as the patients enrolled differed in terms of general characteristics, such as age, BMI, male/female ratio, medication use. Omega-3 supplementation also varied across the included studies with regards to the dose, duration, and EPA/DHA ratio. Moreover, intentional weight loss was a part of intervention in two studies, whereas the remaining studies only included omega-3 supplementation as intervention. This is important, as weight loss is known to affect a variety of metabolic parameters. Furthermore, two outcome parameters (PAI-1 and resistin) were inspected on the basis of only two studies with a small sample size. Finally, we could not exclude publication bias in our meta-analysis. These limitations implicate that a cautious interpretation of the results of the present systematic review and meta-analysis is necessary.


 XML Download