Abstract
Objectives
To compare the degeneration of sacroiliac joint (SIJ) following lumbar or lumbosacral fusion.
Summary of Literature Review
The SIJ is adjacent to lumbosacral junction and its degeneration can be the potential cause of pain.
However, the study addressing SIJ degeneration following lumbar or lumbosacral fusion is very limited.
Materials and Methods
From June 2002 to June 2012, 98 patients who underwent posterior decompression and posterolateral fusion were included in this study. The study group was divided into 2 groups according to the range of fusion. Group A had fusion to L5 and included 34 patients. Group B had fusion to S1 and included 64 patients. We evaluated the five years postoperative radiologic and clinical outcomes retrospectively.
Results
There was no statistically significant difference of bilateral preoperative subchondral sclerosis and osteophytes of the SIJ between group A and group B. However, group B revealed statistically significant subchondral sclerosis and osteophyte formation of the SIJ than group A on every radiographs after postoperative 1 year. In group B, the number of fusion segments and age were statistically positively correlated with the degeneration of the SIJ.
Conclusions
Degeneration of the SIJ revealed more rapid and more severe progression in lumbosacral fusion group than in lumbar fusion group. The number of fusion segments and age were positively correlated with the degeneration of the SIJ in lumbosacral fusion group. Therefore, these facts should be taken into account when performing spinal fusion.
Go to : 
REFERENCES
1. Kim YM, Park YS, Ha KY. Operative techniques. SI Suk, editor. eds.Textbook of spinal surgery. 4th ed.Newest medical publishing company;2017. 189-227.
2. Park P, Garton HJ, Gala VC, et al. Adjacent segment disease after lumbar or lumbosacral fusion: Review of the literature. Spine (Phila Pa 1976). 2004 Sep; 29(17):1938–44. DOI: 10.1097/01.brs.0000137069.88904.03.

3. Kumar MN, Baklanov A, Chopin D. Correlation between sagittal plane changes and adjacent segment degeneration following lumbar spine fusion. Eur Spine J. 2001 Aug; 10(4):314–9. DOI: 10.1007/s005860000239.

4. Aota Y, Kumano K, Hirabayashi S. Postfusion instability at the adjacent segments after rigid pedicle screw fixation for degenerative lumbar spinal disorders. J Spinal Disord. 1995 Dec; 8(6):464–73.

5. Etebar S, Cahill DW. Risk factors for adjacent-segment failure following lumbar fixation with rigid instrumentation for degenerative instability. 1999 Apr; 90(2 Suppl):163–9. DOI: 10.3171/spi.1999.90.2.0163.
6. Ivanov AA, Kiapour A, Ebraheim NA, et al. Lumbar fusion leads to increases in angular motion and stress across sacroiliac joint. Spine (Phila Pa 1976). 2009 Mar 1; 34(5):E162–9. DOI: 10.1097/BRS.0b013e3181978ea3.

7. Ha KY, Lee JS, Kim KW. Degeneration of sacroiliac joint after instrumented lumbar or lumbosacral fusion: a prospective cohort study over five-year follow-up. Spine (Phila Pa 1976). 2009 Jul 15; 34(16):1663–8. DOI: 10.1097/BRS.0b013e3181aacab5.
8. Bernard TN, Cassidy JD. The sacroiliac syndrome. Patho-physiology, diagnosis and management. Frymoyer JW, editor. ed.The adult spine: principles and practice. New York: Raven;1991. 2107–30.
9. Frigerio NA, Stowe RR, Howe JW. Movement of the sacroiliac joint. Clin Orthop Relat Res. 1974 May; 100:370–7.

10. Colachis SC Jr, Worden RE, Bechtol CO, Strohm BR. Movement of the sacroiliac joint in the adult male: a preliminary report. Arch Phys Med Rehabil. 1963 Sep; 44:490–8.
11. Sturesson B, Selvik G, Uden A. Movements of the sac-roiliac joints. A roentgen stereophotogrammetric analysis. Spine (Phila Pa 1976). 1989 Feb; 14(2):162–5. DOI: 10.1097/00007632-198902000-00004.
12. Maigne JY, Aivaliklis A, Pfefer E. Results of sacroiliac joint double block and value of sacroiliac pain provocation tests in 54 patients with low back pain. Spine (Phila Pa 1976). 1996 Aug 15; 21(16):1889–92.

13. Schwarzer AC, Aprill CN, Bogduk N. The sacroiliac joint in chronic low back pain. Spine (Phila Pa 1976). 1995 Jan 1; 20(1):31–7. DOI: 10.1097/00007632-199501000-00007.

14. Shibata Y, Shirai Y, Miyamoto M. The aging process in the sacroiliac joint: helical computed tomography analysis. J Orthop Sci. 2002; 7(1):12–8. DOI: 10.1007/s007760200002.

15. Yoshihara H. Sacroiliac joint pain after lumbar/lum-bosacral fusion: current knowledge. Eur Spine J. 2012 Sep; 21(9):1788–96. DOI: 10.1007/s00586-012-2350-8.

16. Dreyfuss P, Dreyer S, Griffin J, et al. Positive sacro-iliac screening tests in asymptomatic adults. Spine (Phila Pa 1976). 1994 May 15; 19(10):1138–43. DOI: 10.1097/00007632-199405001-00007.

17. Resnick D, Niwayama G, Goergen TG. Comparison of radiographic abnormalities of the sacroiliac joint in degenerative disease and ankylosing spondylitis. Am J Roentgenol. 1977 Feb; 128(2):189–96. DOI: 10.2214/ajr.128.2.189.

18. Resnick D, Niwayama G, Goergen TG. Degenerative disease of the sacroiliac joint. Invest Radiol. 975 Nov-Dec; 10(6):608–21. DOI: 10.1097/00004424-197511000-00008.

19. Kozin F, Carrera GF, Ryan LM, Foley D, Lawson T. Computed tomography in the diagnosis of sacroiliitis. Arthritis Rheum. 1981 Dec; 24(12):1479–85. DOI: 10.1002/art.1780241205.

20. Bredella MA, Steinbach LS, Morgan S, Ward M, Davis JC. (2006) MRI of the sacroiliac joints in patients with moder-ate to severe ankylosing spondylitis. AJR Am J Roentgenol. 2006 Dec; 187(6):1420–6. DOI: 10.2214/AJR.05.1423.
21. Puhakka KB, Jurik AG, Egund N, et al. Imaging of sacroiliitis in early seronegative spondylarthropathy. Assessment of abnormalities by MR in comparison with radiography and CT. Acta Radiol. 2003 Mar; 44(2):218–29.

22. Maigne JY, Boulahdour H, Chatellier G. Value of quantitative radionuclide bone scanning in the diagnosis of sacroiliac joint syndrome in 32 patients with low back pain. Eur Spine J. 1998; 7(4):328–31. DOI: 10.1007/s005860050083.

23. Slipman CW, Sterenfeld EB, Chou LH, et al. The value of radionuclide imaging in the diagnosis of sacroiliac joint syndrome. Spine (Phila Pa 1976). 1996 Oct 1; 21(19):2251–4. DOI: 10.1097/00007632-199610010-00013.

24. Lusins JO, Danielski EF, Goldsmith SJ. Bone SPECT in patients with persistent back pain after lumbar spine surgery. 1989 Apr; 30(4):490–6.
25. Geijer G, Gadeholt G¨othlin G, G¨othlin JH. The validity of the New York radiological grading criteria in diagnosing sacroiliitis by computed tomography. Acta Radiologica. 2009 Jul; 50(6):664–73. DOI: 10.1080/02841850902914099.

26. Resnick D, Niwayama G, Goergen TG. Degenerative disease of the sacroiliac joint. Invest Radiol. 1975 Nov-Dec; 10(6):608–21. DOI: 10.1097/00004424-197511000-00008.

27. Dreyfuss P, Michaelsen M, Pauza K, et al. The value of medical history and physical examination in diagnosing sacroiliac joint pain. Spine (Phila Pa 1976). 1996 Nov 15; 21(22):2594–602.

28. Slipman CW, Jackson HB, Lipetz JS, et al. Sacroiliac joint pain referral zones. Arch Phys Med Rehabil. 2000 Mar; 81(3):334–8. DOI: 10.1016/s0003-9993 (00)90080-7.

Go to : 
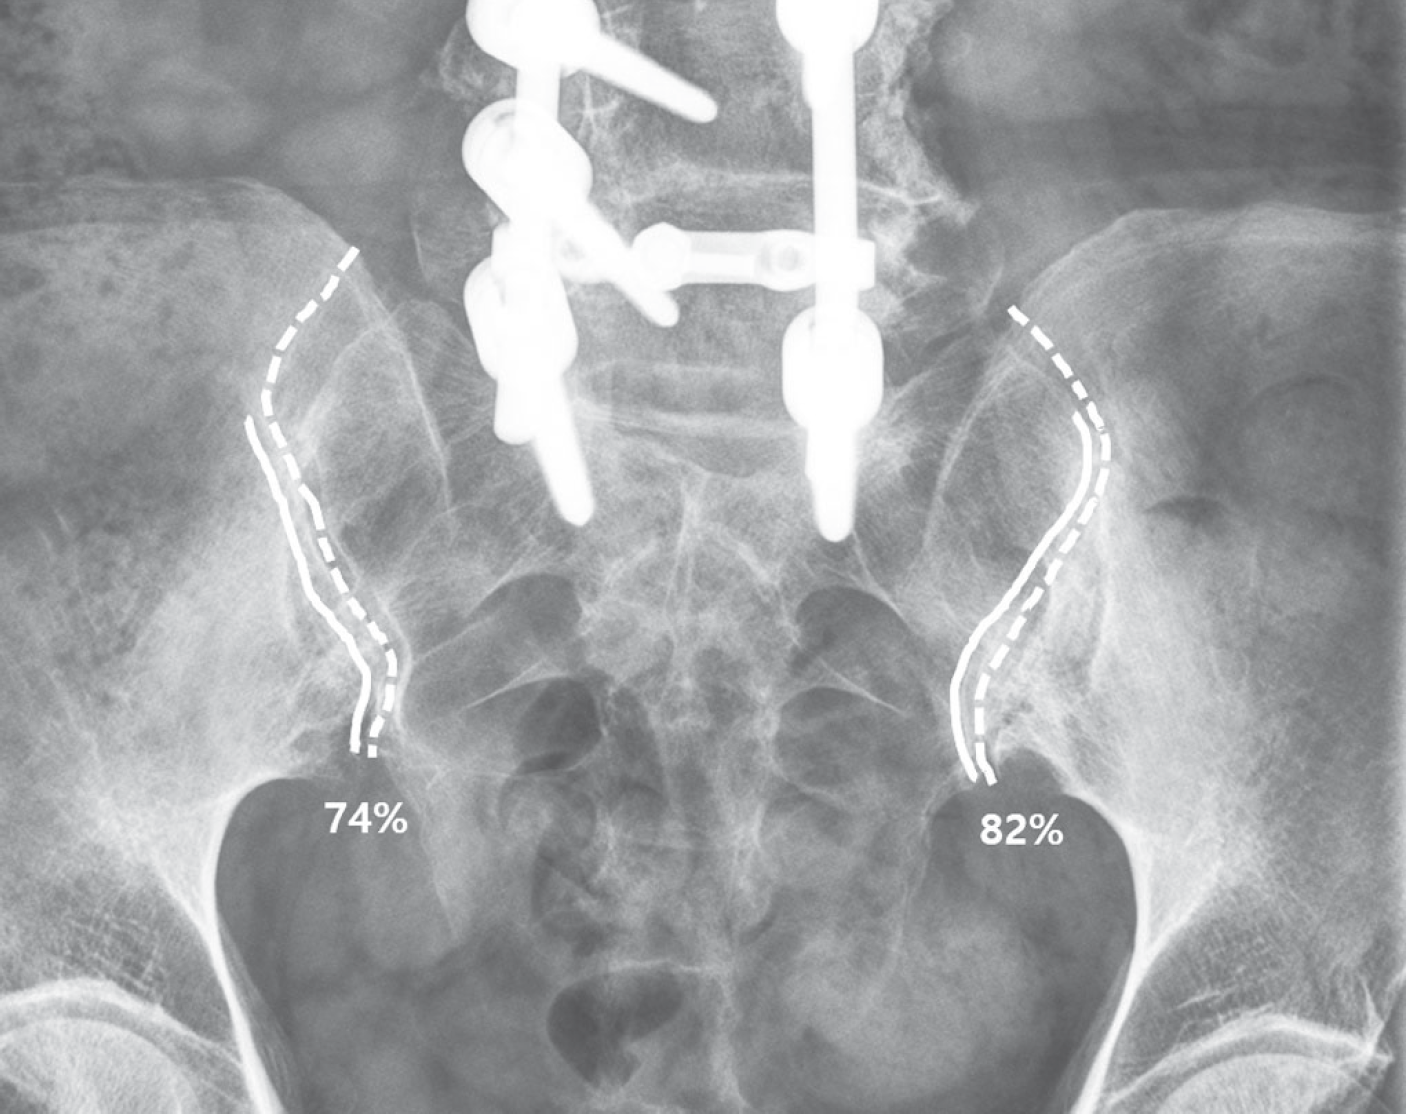
 | Fig. 1.Postoperative radiograph of 64 year-old woman who experienced lumbosacral fusion shows subchondral sclerosis of bilateral sacroiliac joint. Dotted lines show the total sacroiliac joint lines and solid lines note the range of subchondral sclerosis. Subchondral sclerosis of right and left sacroiliac joint was calculated as 74%, 82%, respectively. |
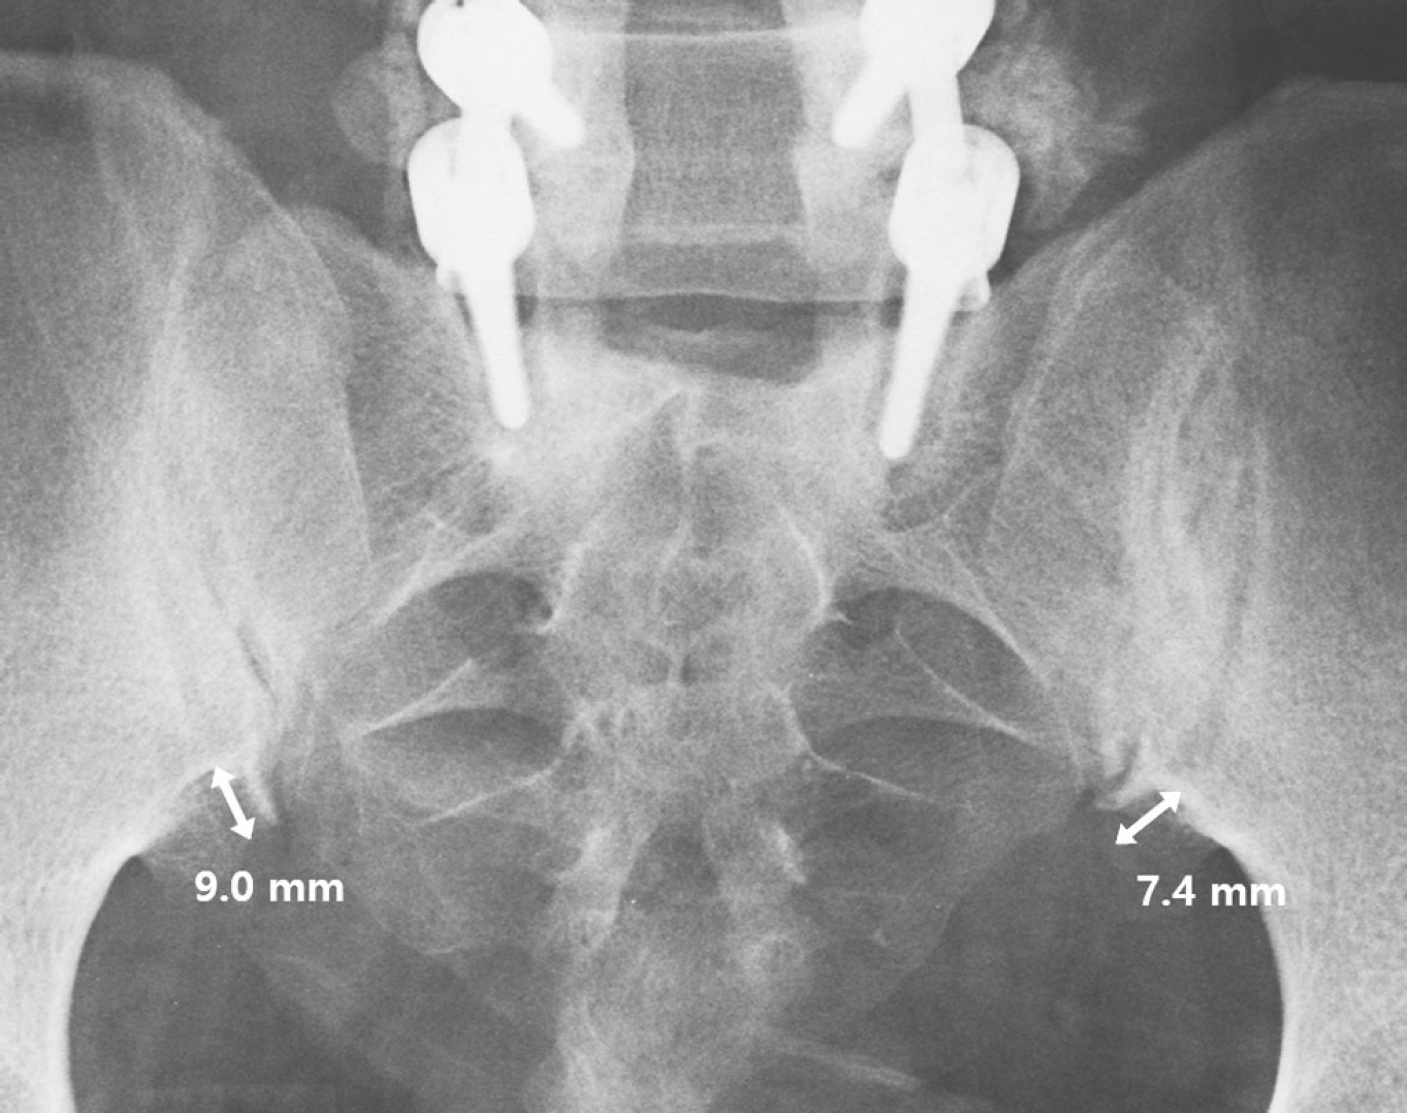
 | Fig. 2.Postoperative radiograph of 49 year-old woman who experienced lumbosacral fusion shows prominent osteophyte of bilateral sacroiliac joint. The right and left osteophytes measured 9.0 mm and 7.4 mm respectively. |
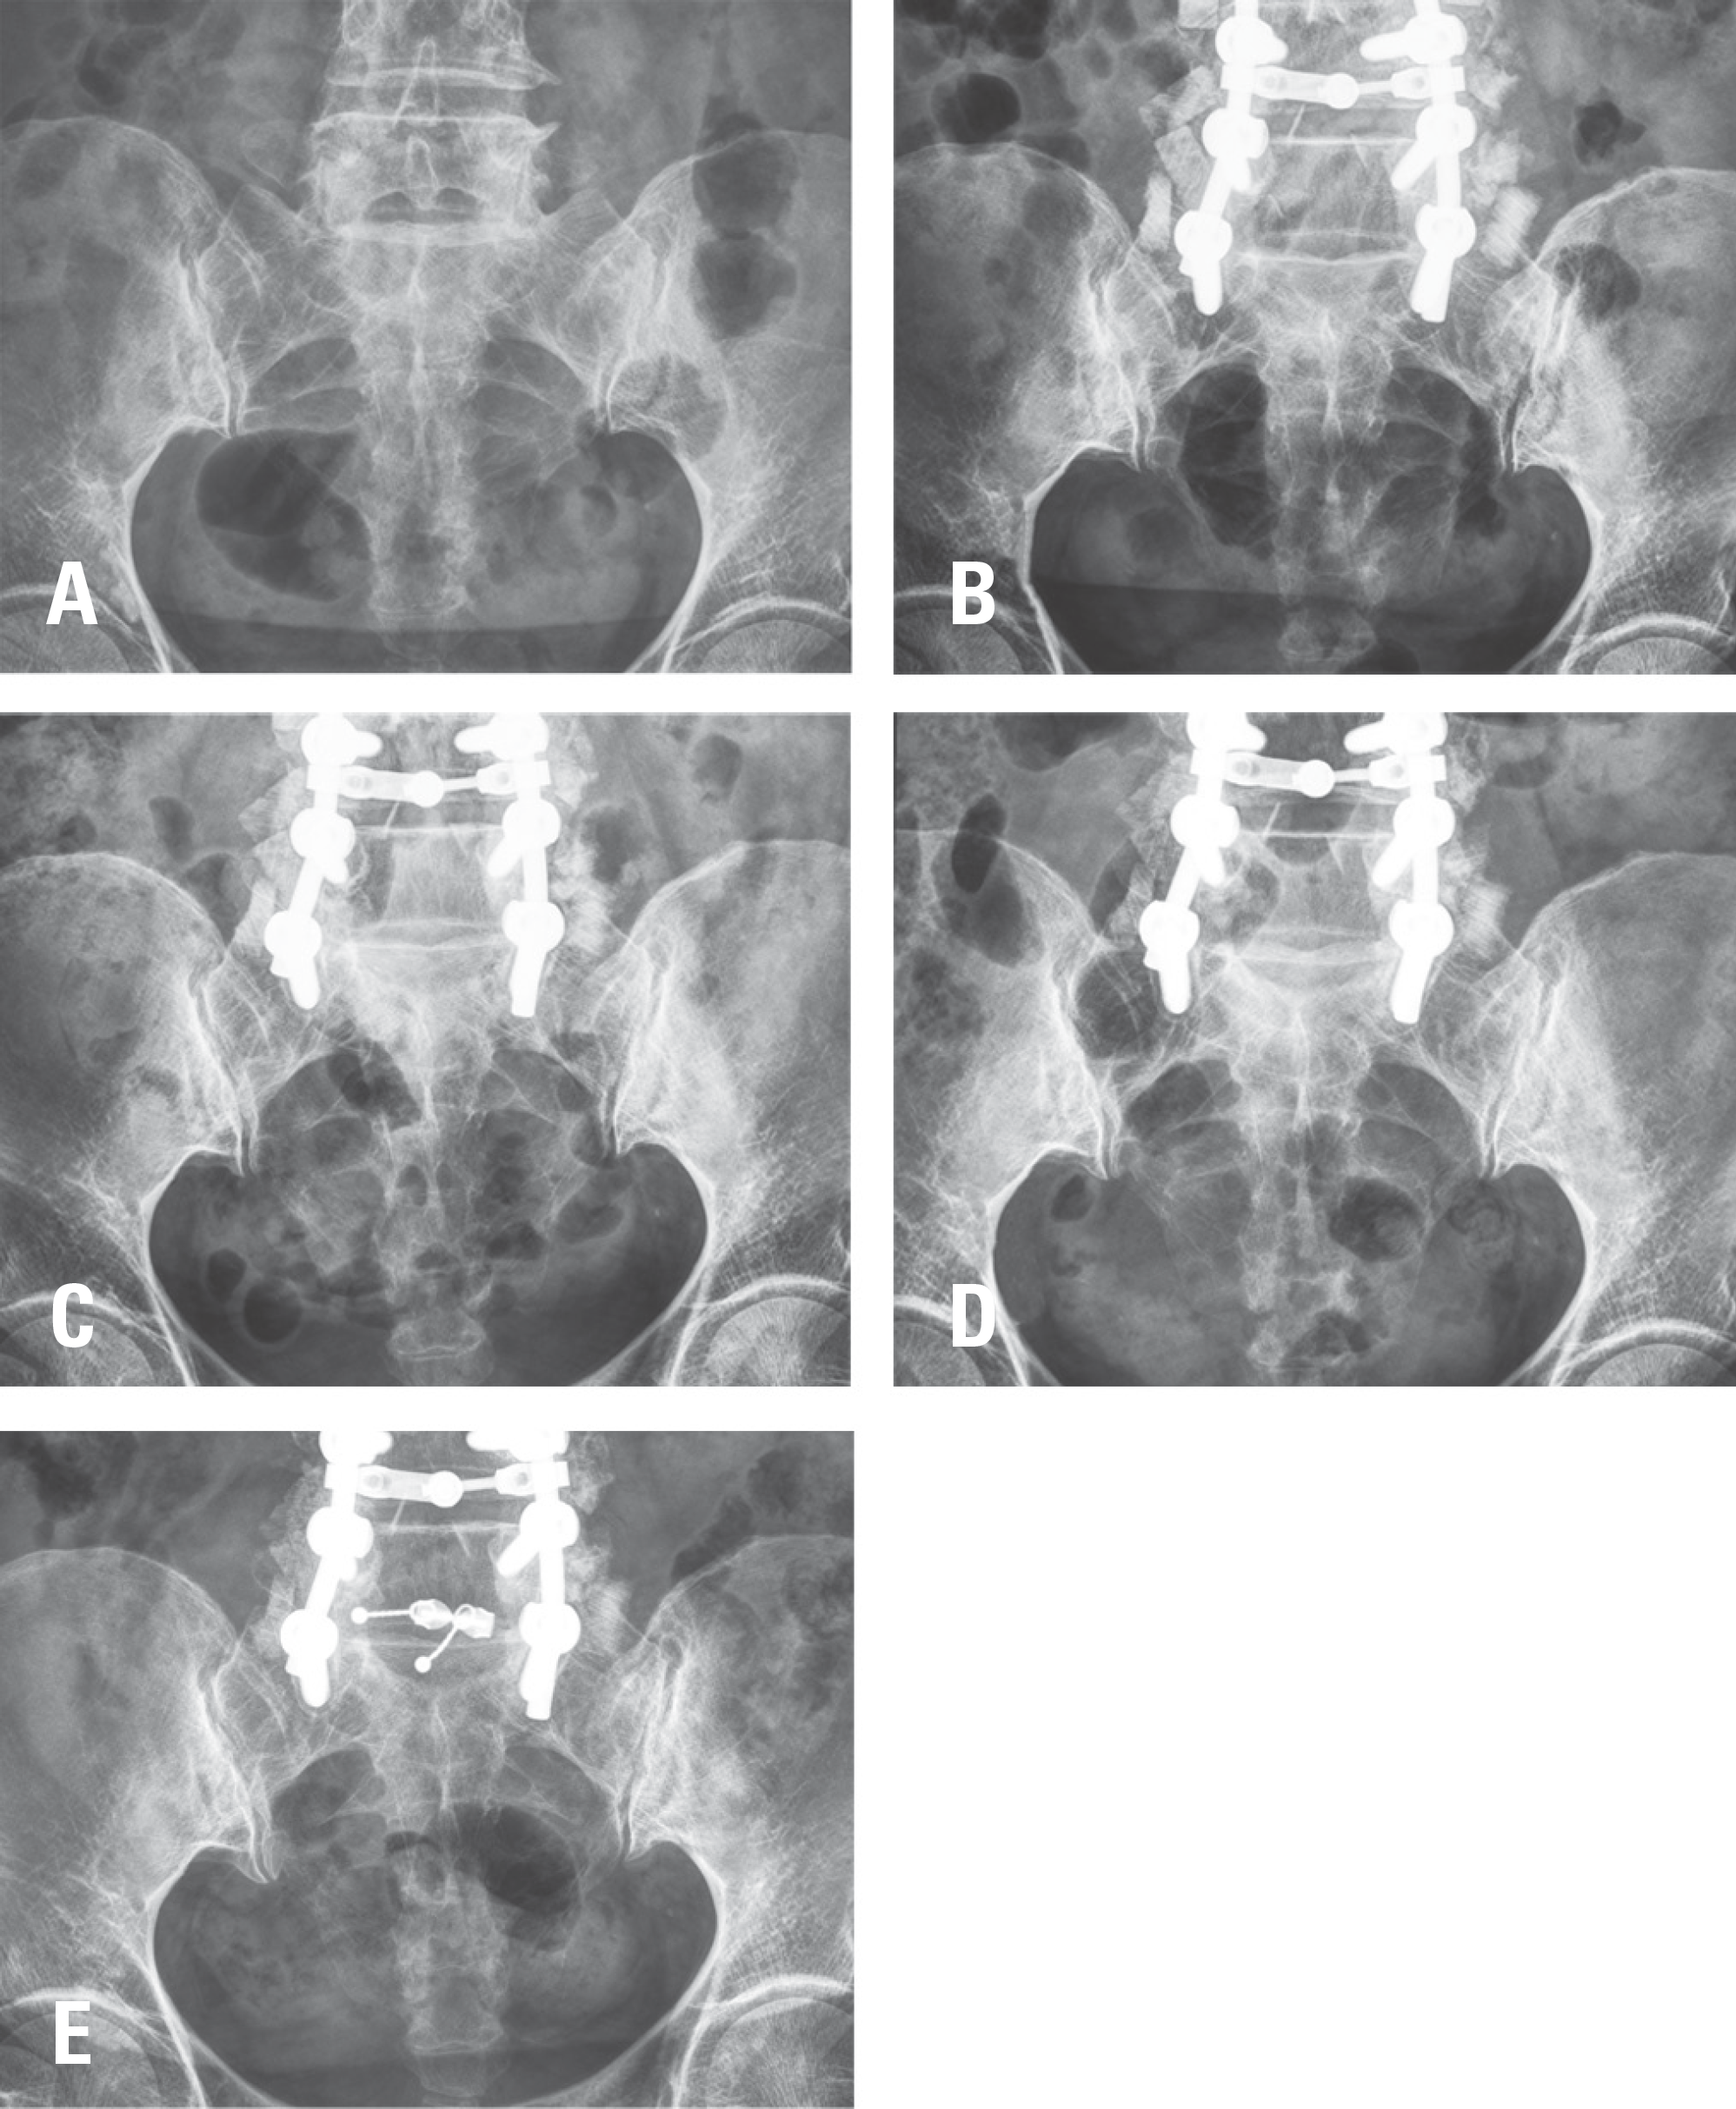
 | Fig. 3.A 69-year-old female patient who underwent L3-S1 posterolateral fusion. Sequential radiographs (A) preoperative, (B) postoperative 6 months, (C) postoperative 1 year, (D) Postoperative 3 years, (E) Postoperative 5 years) show the development of subchondral sclerosis and osteophytes of the sacroiliac joints. |
Table 1.
Demographic data of the patients in group A and B
| Group A (fusion to L5, n=34) | Group B (fusion to S1, n=64) | p-value | |
|---|---|---|---|
| Age (year) | 53.9±13.2∗ | 53.4±14.9∗ | 0.81 |
| Gender (male: female) | 14:20 | 28:36 | 0.83 |
| Height (cm) | 158.1±11.6∗ | 158.5±9.5∗ | 0.86 |
| Weight (kg) | 63.3±12.0∗ | 61.2±11.3∗ | 0.41 |
| BMI (kg/m2)∗ | 25.2±3.2∗ | 24.4±3.9∗ | 0.28 |
| Mean BMD∗ (T-score) | −0.5±2.1∗ | 0.2±1.9∗ | 0.19 |
| Number of Fusion segment | 2.5±0.9∗ | 2.8±0.8∗ | 0.08 |
| 1 | 5(15%) | 2(3%) | |
| 2 | 12(35%) | 21(33%) | |
| 3 | 12(35%) | 28(44%) | |
| 4 | 5(15%) | 13(20%) |
Table 2.
Subchondral sclerosis of sacroiliac joint (%)
| Side of SIJ∗ | Group A (fusion to L5) | Group B (fusion to S1) | p-value | |
|---|---|---|---|---|
| Preoperative | Rt∗ | 8.8±12.6 | 9.6±12.4 | 0.301 |
| Lt∗ | 8.6±13.5 | 9.1±12.6 | 0.880 | |
| 6 months PO∗ | Rt | 9.4±14.1 | 15.4 ±18.2 | 0.027 |
| Lt | 9.5±14.5 | 16.4 ±18.4 | 0.067 | |
| 1 year PO | Rt | 9.9±15.0 | 20.7±21.1 | 0.002 |
| Lt | 10.4±15.5 | 22.7±19.7 | 0.001 | |
| 2 years PO | Rt | 10.8±17.6 | 26.3±23.9 | 0.002 |
| Lt | 11.1±16.3 | 28.7±22.0 | <0.001 | |
| 3 years PO | Rt | 13.5±20.1 | 33.6±26.5 | <0.001 |
| Lt | 12.7±17.5 | 35.9±23.5 | <0.001 | |
| 4 years PO | Rt | 15.7±22.6 | 41.2±29.2 | <0.001 |
| Lt | 16.4±18.9 | 44.1±26.2 | <0.001 | |
| 5 years PO | Rt | 16.6±25.0 | 44.5±30.9 | <0.001 |
| Lt | 17.7±18.7 | 47.2±27.3 | <0.001 |
Table 3.
Osteophyte of sacroiliac joint (mm)
| Side of SIJ∗ | Group A (fusion to L5) | Group B (fusion to S1) | p-value | |
|---|---|---|---|---|
| Preoperative | Rt∗ | 1.4±1.9 | 2.1±2.7 | 0.120 |
| Lt∗ | 1.5±2.0 | 2.2±2.4 | 0.218 | |
| 6 months PO∗ | Rt | 1.5±2.1 | 2.8 ±3.2 | 0.012 |
| Lt | 1.5±2.0 | 2.7 ±2.7 | 0.018 | |
| 1 year PO | Rt | 1.7±2.3 | 3.4±3.4 | 0.004 |
| Lt | 1.6±2.1 | 3.1±2.8 | 0.005 | |
| 2 years PO | Rt | 1.6±2.3 | 4.0±3.8 | <0.001 |
| Lt | 1.8±2.3 | 3.7±3.2 | 0.001 | |
| 3 years PO | Rt | 1.8±2.5 | 4.4±3.8 | <0.001 |
| Lt | 1.8±2.4 | 4.2±3.3 | <0.001 | |
| 4 years PO | Rt | 1.9±2.6 | 4.8±3.9 | <0.001 |
| Lt | 1.8±2.3 | 4.5±3.4 | <0.001 | |
| 5 years PO | Rt | 2.0±2.6 | 5.3±4.3 | <0.001 |
| Lt | 2.0±2.4 | 4.9±3.9 | <0.001 |
Table 4.
SIJ degeneration of group B (fusion to S1) according to the number of fusion segments.
| Subchondral sclerosis | Osteophyte | |||||||
|---|---|---|---|---|---|---|---|---|
| Right SIJ | Left SIJ | Right SIJ | Left SIJ | |||||
| r∗ | p -value | r | p -value | r | p -value | r | p -value | |
| 6 months PO∗ | 0.05 | 0.69 | 0.03 | 0.82 | 0.21 | 0.09 | 0.30 | 0.02∗ |
| 1 year PO | 0.17 | 0.17 | 0.17 | 0.18 | 0.24 | 0.06 | 0.29 | 0.02∗ |
| 2 years PO | 0.26 | 0.04∗ | 0.17 | 0.18 | 0.31 | 0.01∗ | 0.38 | <0.01∗ |
| 3 years PO | 0.30 | 0.02∗ | 0.26 | 0.04∗ | 0.35 | <0.01∗ | 0.39 | <0.01∗ |
| 4 years PO | 0.32 | <0.01∗ | 0.26 | 0.04∗ | 0.35 | <0.01∗ | 0.39 | <0.01∗ |
| 5 years PO | 0.33 | 0.01∗ | 0.29 | 0.03∗ | 0.35 | <0.01∗ | 0.38 | <0.01∗ |
Table 5.
SIJ degeneration of group B (fusion to S1) according to the age.
Table 6.
SIJ degeneration of group B (fusion to S1) according to the body weight.
Table 7.
Pain intensity
| Clinical Parameters | Group A (fusion to L5) | Group B (fusion to S1) | p-value |
|---|---|---|---|
| VAS∗ for back pain | |||
| Pre-operative | 5.8±2.9 | 5.6±2.2 | 0.56 |
| 6 months PO∗ | 3.4±1.9 | 3.2±2.4 | 0.58 |
| 1 year PO | 2.9±2.4 | 3.1±1.3 | 0.31 |
| 2 year PO | 3.2±2.1 | 2.9±1.8 | 0.85 |
| 3 year PO | 2.6±1.9 | 2.5±2.4 | 0.60 |
| 4 year PO | 2.5±2.2 | 2.2±1.9 | 0.32 |
| 5 years PO | 2.6±2.5 | 2.2±2.2 | 0.45 |
| VAS for radiating pain on the lower extremity | |||
| Pre-operative | 7.3±2.1 | 7.6±2.3 | 0.55 |
| 6 months PO | 2.5±2.2 | 2.7±2.1 | 0.42 |
| 1 year PO | 2.2±1.8 | 2.3±2.1 | 0.44 |
| 2 year PO | 2.1±2.3 | 2.1±2.2 | 0.52 |
| 3 year PO | 2.2±1.6 | 2.4±2.2 | 0.60 |
| 4 year PO | 2.4±2.2 | 2.3±1.9 | 0.38 |
| 5 years PO | 2.4±2.3 | 2.5±2.4 | 0.61 |
Table 8.
Oswestry disability index (ODI) score
| Clinical Parameters | Group A (fusion to L5) | Group B (fusion to S1) | p-value |
|---|---|---|---|
| Pre-operative | 62±15 | 58±14 | 0.69 |
| 6 months PO∗ | 36±15 | 32±13 | 0.24 |
| 1 year PO | 31±13 | 28±13 | 0.36 |
| 2 year PO | 26±13 | 16±13 | 0.67 |
| 3 year PO | 22±14 | 21±14 | 0.75 |
| 4 year PO | 23±13 | 22±14 | 0.56 |
| 5 years PO | 21±17 | 19±15 | 0.77 |


 PDF
PDF Citation
 Print
Print


 XML Download