Journal List > Healthc Inform Res > v.26(1) > 1142057

Symum and Zayas-Castro: Prediction of Chronic Disease-Related Inpatient Prolonged Length of Stay Using Machine Learning Algorithms

Abstract

Objectives

The study aimed to develop and compare predictive models based on supervised machine learning algorithms for predicting the prolonged length of stay (LOS) of hospitalized patients diagnosed with five different chronic conditions.

Methods

An administrative claim dataset (2008–2012) of a regional network of nine hospitals in the Tampa Bay area, Florida, USA, was used to develop the prediction models. Features were extracted from the dataset using the International Classification of Diseases, 9th Revision, Clinical Modification (ICD-9-CM) codes. Five learning algorithms, namely, decision tree C5.0, linear support vector machine (LSVM), k-nearest neighbors, random forest, and multi-layered artificial neural networks, were used to build the model with semi-supervised anomaly detection and two feature selection methods. Issues with the unbalanced nature of the dataset were resolved using the Synthetic Minority Over-sampling Technique (SMOTE).

Results

LSVM with wrapper feature selection performed moderately well for all patient cohorts. Using SMOTE to counter data imbalances triggered a tradeoff between the model's sensitivity and specificity, which can be masked under a similar area under the curve. The proposed aggregate rank selection approach resulted in a balanced performing model compared to other criteria. Finally, factors such as comorbidity conditions, source of admission, and payer types were associated with the increased risk of a prolonged LOS.

Conclusions

Prolonged LOS is mostly associated with pre-intraoperative clinical and patient socioeconomic factors. Accurate patient identification with the risk of prolonged LOS using the selected model can provide hospitals a better tool for planning early discharge and resource allocation, thus reducing avoidable hospitalization costs.

I. Introduction

In recent years, congestive heart failure (CHF), acute myocardial infarction (AMI), chronic obstructive pulmonary disease (COPD), pneumonia (PN), and type 2 diabetes (DB) have become the top most costly hospitalized conditions in the United States [1]. The majority of these conditions are characterized by longer than national average length of stay (LOS) of 4.5 days [2]. Moreover, in 2013, the number of hospitalizations for these conditions equaled 3.621 million stays (10.2% of inpatient admissions) [1]. Likewise, the average inpatient treatment costs incurred for these conditions were high, between $7,400 and $18,400 per stay, compared to the national average [3]. Due to the recent substantial increase in medical costs and hospital expenditures, predicting the likelihood of prolonged LOS has become increasingly important to reduce the waste of hospital resources and improve patient satisfaction. Determining influential risk factors for prolonged LOS is useful for planning interventions or care management for patients with multiple chronic conditions. Furthermore, the prediction of prolonged LOS can improve the process of arranging a continuum of care for the patients, thus allowing family members to prepare for the return of their loved one. Additionally, under the government's new inpatient progressive payment system (IPPS), reimbursements are paid in fixed payments based on the patient's diagnosis-related group (DRG) rather than the volume of services [4].
Several studies have explored the use of various predictive models to improve performance in predicting LOS [5]. Multiple variations of artificial neural network (ANN)-based models have been applied in a variety of hospital settings (e.g., emergency department, psychiatric, and intensive care unit) [67]. Several other classification algorithms (e.g., support vector machine, logistic regression, and random forest) have also been applied for predicting LOS, and they have achieved diverse levels of accuracy [89]. However, these models did not use machine learning-based feature selection, anomaly detection, and class imbalance techniques in a framework that might result in overfitting and a weak learner. Only one study attempted to apply a class imbalance technique in predicting prolonged emergency department (ED) LOS [10]. Hence, the use of machine learning algorithms to predict condition-specific prolonged LOS needs further exploration. Therefore, a prolonged LOS prediction model is crucial and indispensable to healthcare providers, especially those with an alternative payment contract (e.g., accountable care organizations) with the Centers for Medicare and Medicaid Services (CMS). Thus, there is a need to develop a predictive decision support system that (1) identifies patients with prolonged LOS risk and (2) helps to develop individual discharge planning to reduce inpatient usage and eventually improve quality of care.
This study constructed and compared predictive models based on supervised machine learning algorithms to identify patients with the risk of prolonged LOS hospitalized with chronic conditions. Condition-specific prolonged LOS prediction represents a significant benchmark in providing healthcare providers a better tool to plan for discharge planning and resource allocation to reduce LOS; therefore, it can lower hospitalization costs. We developed a robust framework for prolonged LOS prediction using data mining algorithms to extract important features, handle missing values, eliminate multicollinearity, detect outlier observations, and balance imbalanced class. Based on previous studies, we chose five algorithms: decision tree C5.0, linear support vector machine (LSVM), k-nearest neighbors (KNN), random forest (RF), and multi-layered ANNs. Twenty different model combinations for each cohort were constructed and compared in terms of several performance metrics.

II. Methods

1. Study Design

Prediction models were constructed using an administrative claim dataset provided by a network of nine hospitals geographically localized within three adjacent counties in the Tampa Bay region, Florida, USA. The types of hospitals in the study included general, teaching, and specialized hospitals. The initial dataset included 594,751 patients accounting for 1,093,177 patient discharges from January 2008 through July 2012. The five disease cohorts included in this study were AMI, CHF, COPD, DB, and PN. These conditions were identified by a primary diagnosis ICD-9 code for the inpatient claims. ICD-9 codes are used to identify hospital admission for AMI (codes 410.*), CHF (codes 428.*, 402.01, 402.91, 404.01, 404.03, 404.11, 404.13, 404.91, 404.93), COPD (codes 491.0, 491.1, 491.2, 491.20, 491.21, 490, 492, 496), DB (codes 250.*2), and PN (codes 480–483, 485–486, 510, 511.0, 511.1, 511.9, 780.6, 786.00, 786.05, 786.06, 786.07, 786.2, 786.3, 786.4, 786.5, 786.51, 786.52, 786.7). The final subsets of AMI, CHF, COPD, DB, and PN cohorts consisted of 10,983, 9,194, 7,189, 3,476, and 21,317 inpatient admissions, respectively.
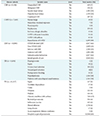
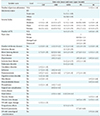
For each discharge claim, we extracted 82 common features (including patient demographics, hospital information, and comorbidity) and several disease-specific features from the inpatient diagnosis and revenue codes based on insights from previous studies [51112]. Descriptive statistics for the data and variables (common and cohort specific) are shown in Tables 1 and 2, respectively. Features were extracted from the diagnosis codes using ICD-9 numeric, E and V codes. For example, one of the features, accidental fall, was identified from 30 diagnoses ICD-9 codes by filtering E88–E89. The severity index was calculated as the severity of illness (from 1 = minor to 4 = extreme) defined by 3M all-patient refined-diagnosis-related groups (APR-DRG) [13].

2. Outcome Variable

We defined prolonged LOS in our study as >7 days by calculating the 85th percentile threshold for the entire study population cohort's LOS [14]. The uniform prolonged LOS criteria (>7 days) for all cohorts were applied to simplify hospital resource allocation in discharge planning and to reduce the hospital-wise risk of post-discharge complications. Hospital stays longer than seven days are associated with a higher risk of post-discharge adverse outcomes and complications than short stay (≤7 days) regardless of admission causes [15].

3. Modeling Framework

The modeling framework comprised three major steps: data preprocessing, model training, and performance evaluation. The data preprocessing comprised missing value handling, zero-variance test, correlation test, novelty detection, and feature selection. Figure 1 illustrates the steps involved in data preprocessing. Using the software RStudio caret packages [16], we performed the data preprocessing steps. First, missing values in the patient records were handled using established strategies. If the feature contained over 15% missing cases, we excluded the attributed feature. If less than 15% of the records were missing, the mean or median value replaced the blanks for the continuous and ordinal feature respectively.
We used the one-class support vector machine (O-SVM) to identify outliers from noisy observations [17]. The O-SVM identified a similar proportion of anomalies (1.92%–2.44%) and excluded them from the dataset. Then we identified correlated features using the Pearson correlation and chi-square test for the continuous and nominal features, respectively, with a 0.05 level of significance. Among the correlated pairs of features, we dropped those with the highest variance inflation factor. Finally, features with in-class imbalances or zero variances were dropped after the zero-variance test with a 1.0% cutoff. Table 3 summarizes the results obtained from the data preprocessing steps.
We separated the records into training (70%), and testing (30%) sets for each cohort. Figure 2 illustrates the process of model building and the evaluation process. Next, using the same training dataset for each patient cohort, two different types of feature selection methods, chi-square filtering, and the SVM-based wrapper algorithm were applied to identify significant variables [18]. In the chi-square filtering method, features were selected at a 0.05 level of significance. For the wrapper algorithm, we limited our algorithm to a maximum of 200 iterations for each training model. The selected features from chi-square filtering and wrapper feature selection methods are shown in Supplementary Tables S1 and S2. After selecting features from both methods, we trained C5.0, LSVM, KNN, RF, and multi-layered ANN models for each cohort.
While training these models, we also explored the issues with the imbalance nature of the data. When training with imbalanced data, the algorithm tends to learn more from the majority class than the minority class, resulting in a weak learner with limited predictability. For the five cohorts, we had a varying imbalance ratio (0.09 to 0.15). To resolve this issue, we over-sampled the training data set using the Synthetic Minority Over-sampling Technique (SMOTE) and created new balanced data [19]. We trained 20 different models for each cohort and compared the performance of the models using the testing dataset under several metrics. Although the area under the curve (AUC) metric was unaffected by imbalances, the AUC tends to mask poor performance [20]. Therefore, we considered two other performance metrics, namely, sensitivity and specificity, with the AUC to minimize imbalance biases.
We propose a new rank average aggregate metric approach for selecting the best performing model to deal with the dilemma of performance tradeoff initiated by data imbalance. In our approach, the performance of each model was ranked separately for the three metrics of AUC, sensitivity, and specificity, and each was assigned a score (between 1 to 20) based on the rank. For example, if the LSVM model was ranked third by the AUC, we assigned a score of 18 out of 20. These three scores were multiplied by the assigned weights and summed to obtain a single aggregate metric where the summation of all weights must be equal to 1. Finally, we selected a single model by comparing the composite weighted sum metrics among the 20 different models, and the steps were repeated for each cohort.

III. Results

1. Assessment of the Prediction Models

We fitted 20 different model combinations comprising two feature selection methods, with or without SMOTE, and five learning algorithms for each cohort. Table 4 summarizes the performance of the learning algorithms for each cohort. As shown, the KNN models did not outperform any of the other algorithms. LSVM outperformed every other algorithm in all cohorts with AUC, while it only outperformed CHF in terms of specificity. RF models outperformed for the AMI and DB cohorts, whereas for CHF and PN, the ANN models worked better according to the specificity metric. However, it is evident that selecting a model solely based on the AUC masked a model's poor specificity. For example, the best model for CHF under AUC is LSVM using the wrapper feature selection, with 0.81 AUC and 0.28 specificity. A specificity of 0.28, meaning only a 28% chance of detecting a true negative, represents poor model performance, which was completely shadowed by the AUC. Between the two feature selection methods, the SVM-based wrapper method yielded better prediction by AUC, whereas chi-square filtering methods achieved better true-negative rates. SMOTE used with feature selection did not improve the model's AUC. However, chi-square feature selection with SMOTE resulted in the highest specificity in all cohorts.
Figure 3 illustrates the changes in sensitivity and specificity with and without using SMOTE for the chi-square feature selection method. As shown, there is a significant tradeoff between the sensitivity and specificity. Furthermore, all the learning algorithms showed a positive tradeoff, specificity increase, and sensitivity decrease, except for the RF models. SMOTE yielded the highest and lowest increment of sensitivity for the C5.0 and KNN algorithms, respectively. The performance of each model depends on the algorithm as well as the feature selection and data balancing technique. Additionally, the tradeoff between the metrics due to the dataset imbalance makes it more challenging to select the best performing model. Table 5 shows the selected models based on AUC, sensitivity, F1 score, proposed aggregate rank, and a custom rule for each cohort. Based on our proposed metric, we selected several variations of LSVM models that showed balanced performance in every metric. In healthcare decision making, administrators or decision makers select the best model either empirically or by custom decision criteria favorable to the budgetary constraints. Therefore, we tested a custom rule comprising a minimum 0.75 specificity and the maximum for the AUC metric. If there was no model associated with more than 0.75 specificity, we selected the final model with the highest specificity. In general, LSVM with the wrapper feature selection was selected based on the AUC criteria, while different algorithms with SMOTE were selected based on the specificity metric. The selected models obtained by custom rules comprised different machine learning algorithms with SMOTE, and the results showed a moderate performance across all metrics.

2. Important Features

Tables 6 and 7 show significant features using the LSVM algorithm and regression analysis, respectively. The most important variable in all disease cohorts except DB for making a prolonged LOS prediction was the disease severity index with varying relative weights. In addition, the presence of different types of comorbidity was a strong predictor of prolonged LOS. For example, in AMI, COPD, and PN, the presence of comorbidities related to blood and blood-forming organ diseases resulted in a longer LOS. In addition, AMI and CHF patients admitted with pneumoconiosis and other lung-related conditions tended to stay longer in hospital inpatient settings. Several non-comorbidity-related features, such as the number of PX, source of admission, and payer class were also associated with a prolonged LOS. The number of tests (PX) required to assess patient condition was highly associated with prolonged inpatient stays in all cohorts expect AMI, and the higher the number of tests, the greater the risk of a prolonged LOS. Specifically, PN patients with non-commercial payers and COPD patients admitted through the ED showed a greater likelihood of prolonged LOS.

IV. Discussion

In this study, we analyzed prolonged inpatient stays using an administrative claim dataset, performed extensive data preprocessing, and then developed and compared several variants of predictive models for the five disease cohorts. We identified several important factors that increase the risk of a prolonged stay for each disease. We found that prolonged LOS is associated with blood-forming and skin-disease-related comorbidities in most of the chronic conditions. The finding of several previous studies also support this result [21]. Some other studies have reported that patient demographics, gender, and hospital locations were contributors to identifying the risk of a prolonged LOS. However, our results do not conform to the findings in those studies [2223]. One possible reason for this discrepancy is that the previous studies have mostly used homogenous data consisting of a single hospital or specific type of operation (e.g., knee replacement, heart surgery). When examining data from nine different hospitals over eight years, other factors had more weight than demographic factors (e.g., race, gender) in terms of the prediction of prolonged LOS.
Significant factors found in our study could be used to formulate individual disease-specific treatment pathways and early discharge planning to decrease inpatient LOS. Identifying patients with risk of prolonged LOS at the time of admission or inpatient care, the hospital can assign a dedicated hospitalist and prepare a plan for the advanced discharged planning process. Studies show that having a dedicated hospitalist after four days of inpatient care and effective early discharged planning with a continuum of care can significantly reduce inpatient LOS [2425]. Additionally, prioritizing laboratory tests and avoiding duplication of tests using hospital information exchange (HIE) can effectively decrease the LOS [26]. Furthermore, implementing improved care management and care coordination for patients with specific comorbidities in accountable care organizations (ACO) could reduce inpatient care utilization [27]. In addition, we found that the type of payer or insurance, which are typically considered to be significant socioeconomic factors, significantly affect the likelihood of a prolonged LOS. This insight agrees with the claims made in previous studies that social deprivation or economic inequality has a negative effect on the expected length of hospital stays of admitted patients [28]. Furthermore, an individual prolonged LOS risk profile can be used as a decision-making aid to the physician's subjective judgment while adjusting a patient's LOS [21]. This study of disease-specific prolonged LOS prediction may also assist in reducing the financial burden of the numerous outlier claims under CMS IPPS resulting from extended hospital stays. [29]. Outlier payments exert tremendous pressure on Medicare expenditures and are responsible for an average of $4.04 billion each year [30].
The prediction model we developed was compared to other published models in terms of predictive power and robustness. The selected cohort-specific models showed a variation of prediction performance depending on the model evaluation criteria. We found that although predictive power (AUC) was similar across certain methods, the range in detecting true-positive and true-negative events varied greatly. Analyzing multiple aspects of models provides the health administrators or decision-makers a stronger understanding of those models and real-time applicability. LSVM models with wrapper feature selection showed overall better performance for all cohorts. Furthermore, integration of O-SVM for outlier detection in data preprocessing also improved model robustness when dealing with noisy observations. Implementation of the SMOTE technique along with feature-selection algorithms showed a significant tradeoff between sensitivity and specificity in all prediction models except RF, which made the final model selection based on a single performance metric difficult. Moreover, our results showed that using only the AUC as a baseline metric may mask a model's poor prediction performance, especially regarding the true-negative rate. Our proposed aggregate rank-based selection approach resolves this tradeoff dilemma by choosing a model with balanced performance, and it can provide a decision support tool to health administrators when comparing predictive models.
In conclusions, the accurate prediction of a prolonged LOS and prognosis of the risks associated with chronic disease are challenging. We adapted five machine-based learning techniques with feature selection, anomaly detection, and SMOTE balancing to predict prolonged LOS. The performance of the methods varies in complex ways, including discrimination and predictive range. We found that LSVM models performed better in terms of AUC and sensitivity. We also found that clinical and socioeconomic factors are the main features driving patient prolonged LOS. Designing predictive models would help to accelerate the stratification of patients according to prolonged LOS risk for improved care. The proposed prolonged LOS prediction model can be used to plan for advanced discharge planning, healthcare personnel allocation, and care coordination programs to reduce the usage of inpatient care. Some limitations of the present study should be addressed because they may restrict generalizability and are indicative of the need for further research. Our research did not include potential pathological (e.g., hemoglobin level) and sociocultural (e.g., education) features due to data availability, which might be useful for improving accuracy.

Figures and Tables

Figure 1

Data preprocessing steps for building predictive model. SVM: support vector machine.

hir-26-20-g001
Figure 2

Flowchart of the predictive model building and best performing model selection. CQ: chi-square feature selection, WR: support vector machinebased wrapper feature selection, AUC: area under the curve, SP: specificity, SN: sensitivity, SMOTE: Synthetic Minority Over-sampling Technique.

hir-26-20-g002
Figure 3

Performance metric changes (%) with and without SMOTE balancing. AMI: acute myocardial infarction, CHF: congestive heart failure, COPD: chronic obstructive pulmonary disease, DB: type 2 diabetes, PN: pneumonia, SP: specificity, SN: sensitivity, KNN: k-nearest neighbor, LSVM: linear support vector machine, RF: random forest, NN: multi-layer neural network, SMOTE: Synthetic Minority Over-sampling Technique.

hir-26-20-g003
Table 1

Descriptive statistics for all common features

hir-26-20-i001

Values are presented as number (%) or mean ± standard deviation. For the binary (Yes or No) type variable, descriptive statistics is shown for “Yes” level only.

CHF: congestive heart failure, AMI: acute myocardial infarction, COPD: chronic obstructive pulmonary disease, PN: pneumonia, DB: type 2 diabetes, LOS: length of stay.

Table 2

Descriptive statistics for disease cohort-specific variables

hir-26-20-i002

For the binary (Yes or No) type variable, descriptive statistics is shown for “Yes” level only.

CHF: congestive heart failure, COPD: chronic obstructive pulmonary disease, AMI: acute myocardial infarction, DB: type 2 diabetes, PN: pneumonia.

Table 3

Summary statistics in data preprocessing steps

hir-26-20-i003

Values are presented as number (%).

CHF: congestive heart failure, AMI: acute myocardial infarction, COPD: chronic obstructive pulmonary disease, PN: pneumonia, DB: type 2 diabetes.

Table 4

Performance comparison of predictive models

hir-26-20-i004

AMI: acute myocardial infarction, CHF: congestive heart failure, COPD: chronic obstructive pulmonary disease, DB: type 2 diabetes, PN: pneumonia, AUC: area under the curve, SP: specificity, KNN: k-nearest neighbor, LSVM: linear support vector machine, RF: random forest, NN: multi-layer neural network, WR: support vector machine-based wrapper method, WR+ST: wrapper method with SMOTE (Synthetic Minority Over-sampling Technique), CQ: chi-square filtering method, CQ+ST: chi-square with SMOTE.

aBest model based on AUC, bbest model based on specificity.

Table 5

Best performing model based on several criteria

hir-26-20-i005

AMI: acute myocardial infarction, CHF: congestive heart failure, COPD: chronic obstructive pulmonary disease, DB: type 2 diabetes, PN: pneumonia, AUC: area under the curve, SP: specificity, SN: sensitivity, LSVM: linear support vector machine, RF: random forest, NN: multi-layer neural network, KNN: k-nearest neighbor, WR: support vector machine-based wrapper method, WR+ST: wrapper method with SMOTE (Synthetic Minority Over-sampling Technique), CQ: chi-square filtering method, CQ+ST: chi-square with SMOTE.

Example, a+b+c; a = machine learning method, b = feature selection technique, c = presence of SMOTE balancing; LSVM+CQ+ST = linear support vector mechanics with chi-square feature selection and SMOTE date balancing technique.

Table 6

Important features extracted by LSVM algorithm

hir-26-20-i006

LSVM: linear support vector machine, AMI: acute myocardial infarction, CHF: congestive heart failure, COPD: chronic obstructive pulmonary disease, DB: type 2 diabetes, PN: pneumonia.

Table 7

Important features extracted using regression analysis

hir-26-20-i007

CHF: congestive heart failure, AMI: acute myocardial infarction, COPD: chronic obstructive pulmonary disease, DB: type 2 diabetes, PN: pneumonia, ED: emergency department.

Notes

Conflict of Interest No potential conflict of interest relevant to this article was reported.

References

1. Torio CM, Moore B. National inpatient hospital costs: the most expensive conditions by payer, 2013 [Internet]. Rockville (MD): Agency for Healthcare Research and Quality;2006. cited at 2020 Jan 10. Available from: https://www.hcup-us.ahrq.gov/reports/statbriefs/sb204-Most-Expensive-Hospital-Conditions.pdf.
2. Weiss AJ, Elixhauser A. Overview of hospital stays in the United States, 2012 [Internet]. Rockville (MD): Agency for Healthcare Research and Quality;2014. cited at 2020 Jan 10. Available from: https://www.hcup-us.ahrq.gov/reports/statbriefs/sb180-Hospitalizations-United-States-2012.pdf.
3. Pfuntner A, Wier LM, Steiner C. Costs for hospital stays in the United States, 2010 [Internet]. Rockville (MD): Agency for Healthcare Research and Quality;2013. cited at 2020 Jan 10. Available from: https://www.hcup-us.ahrq.gov/reports/statbriefs/sb146.pdf.
4. Centers for Medicare & Medicaid Services (CMS), HHS. Medicare Program; Medicare Shared Savings Program; Accountable Care Organizations: pathways to success and extreme and uncontrollable circumstances policies for performance year 2017: final rules. Fed Regist. 2018; 83(249):67816–68082.
5. Lu M, Sajobi T, Lucyk K, Lorenzetti D, Quan H. Systematic review of risk adjustment models of hospital length of stay (LOS). Med Care. 2015; 53(4):355–365.
crossref pmid
6. Rowan M, Ryan T, Hegarty F, O'Hare N. The use of artificial neural networks to stratify the length of stay of cardiac patients based on preoperative and initial postoperative factors. Artif Intell Med. 2007; 40(3):211–221.
crossref pmid
7. Wrenn J, Jones I, Lanaghan K, Congdon CB, Aronsky D. Estimating patient's length of stay in the Emergency Department with an artificial neural network. AMIA Annu Symp Proc. 2005; 1155.
8. Morton A, Marzban E, Giannoulis G, Patel A, Aparasu R, Kakadiaris IA. A comparison of supervised machine learning techniques for predicting short-term in-hospital length of stay among diabetic patients. In : Proceedings of 2014 13th International Conference on Machine Learning and Applications; 2014 Dec 3–6; Detroit, MI. p. 428–431.
9. Jiang X, Qu X, Davis LB. Using data mining to analyze patient discharge data for an urban hospital. In : Proceedings of the 2010 International Conference on Data Mining (DMIN); 2010 Jul 12–15; Las Vegas, NV. p. 139–144.
10. Azari A, Janeja VP, Levin S. Imbalanced learning to predict long stay Emergency Department patients. In : Proceedings of 2015 IEEE International Conference on Bioinformatics and Biomedicine (BIBM); 2015 Nov 9–12; Washington, DC. p. 807–814.
11. Salah H. Predicting inpatient length of stay in western New York health service area using machine learning algorithms [dissertation]. Binghamton (NY): State University of New York at Binghamton;2017.
12. Li JS, Tian Y, Liu YF, Shu T, Liang MH. Applying a BP neural network model to predict the length of hospital stay. In : Huang G, Liu X, He J, Klawonn F, Yao G, editors. Health information science. Heidelberg, Germany: Springer;2013. p. 18–29.
13. Averill RF, Goldfield N, Hughes JS, Bonazelli J, Mc-Cullough EC, Mullin R, et al. 3M APR DRG classification system: methodology overview [Internet]. Wallingford (CT): 3M Health Information Systems;2008. cited at 2020 Jan 10. Available from: https://www.hcup-us.ahrq.gov/db/nation/nis/v261_aprdrg_meth_ovrview.pdf.
14. Thompson B, Elish K, Steele R. Machine learning-based prediction of prolonged length of stay in newborns. In : Proceedings of 2018 17th IEEE International Conference on Machine Learning and Applications (ICMLA); 2018 Dec 17–20; Orlando, FL. p. 1454–1459.
15. Allard JP, Keller H, Jeejeebhoy KN, Laporte M, Duerksen DR, Gramlich L, et al. Decline in nutritional status is associated with prolonged length of stay in hospitalized patients admitted for 7 days or more: a prospective cohort study. Clin Nutr. 2016; 35(1):144–152.
crossref pmid
16. Kuhn M. Building predictive models in R using the caret package. J Stat Softw. 2008; 28(5):1–26.
17. Amer M, Goldstein M, Abdennadher S. Enhancing one-class support vector machines for unsupervised anomaly detection. In : Proceedings of the ACM SIGKDD Workshop on Outlier Detection and Description; 2013 Aug 11; Chicago, IL. p. 8–15.
18. Guyon I, Elisseeff A. An introduction to variable and feature selection. J Mach Learn Res. 2003; 3:1157–1182.
19. Chawla NV, Bowyer KW, Hall LO, Kegelmeyer WP. SMOTE: synthetic minority over-sampling technique. J Artif Intell Res. 2002; 16:321–357.
crossref
20. Jeni LA, Cohn JF, De La Torre F. Facing imbalanced data: recommendations for the use of performance metrics. In : Proceedings of 2013 Humaine Association Conference on Affective Computing and Intelligent Interaction; 2003 Sep 2–5; Geneva, Switzerland. p. 245–251.
21. Chuang MT, Hu YH, Lo CL. Predicting the prolonged length of stay of general surgery patients: a supervised learning approach. Int Trans Oper Res. 2018; 25(1):75–90.
crossref
22. Wang Y, Stavem K, Dahl FA, Humerfelt S, Haugen T. Factors associated with a prolonged length of stay after acute exacerbation of chronic obstructive pulmonary disease (AECOPD). Int J Chron Obstruct Pulmon Dis. 2014; 9:99–105.
crossref pmid pmc
23. Hachesu PR, Ahmadi M, Alizadeh S, Sadoughi F. Use of data mining techniques to determine and predict length of stay of cardiac patients. Healthc Inform Res. 2013; 19(2):121–129.
crossref pmid pmc
24. Gonçalves-Bradley DC, Lannin NA, Clemson LM, Cameron ID, Shepperd S. Discharge planning from hospital. Cochrane Database Syst Rev. 2016; (1):CD000313.
crossref
25. Chandra S, Wright SM, Howell EE. The Creating Incentives and Continuity Leading to Efficiency staffing model: a quality improvement initiative in hospital medicine. Mayo Clin Proc. 2012; 87(4):364–371.
crossref pmid pmc
26. Menachemi N, Rahurkar S, Harle CA, Vest JR. The benefits of health information exchange: an updated systematic review. J Am Med Inform Assoc. 2018; 25(9):1259–1265.
crossref pmid pmc
27. Kaufman BG, Spivack BS, Stearns SC, Song PH, O'Brien EC. Impact of accountable care organizations on utilization, care, and outcomes: a systematic review. Med Care Res Rev. 2019; 76(3):255–290.
crossref pmid
28. Hasan O, Orav EJ, Hicks LS. Insurance status and hospital care for myocardial infarction, stroke, and pneumonia. J Hosp Med. 2010; 5(8):452–459.
crossref pmid
29. Bai G, Anderson GF. US Hospitals are still using chargemaster markups to maximize revenues. Health Aff (Millwood). 2016; 35(9):1658–1664.
crossref pmid
30. Krinsky S, Ryan AM, Mijanovich T, Blustein J. Variation in payment rates under Medicare's inpatient prospective payment system. Health Serv Res. 2017; 52(2):676–696.
crossref pmid

Supplementary Materials

Supplementary materials can be found via https://doi.org/10.4258/hir.2020.26.1.20.

Table S1

Selected features from chi-square filtering feature selection

Table S2

Selected features from SVM-based wrapper feature selection
TOOLS
ORCID iDs

Hasan Symum
https://orcid.org/0000-0002-1525-624X

José L. Zayas-Castro
https://orcid.org/0000-0001-7775-428X

Similar articles