

 PDF
PDF ePub
ePub Citation
 Print
Print


INTRODUCTION
Tuberculosis (TB) is a leading global public health problem. Despite intensive global efforts, 9 million people worldwide are estimated to be affected by TB infection in 2013, and TB-related deaths increased from 1.3 million in 2012 to 1.5 million in 2013 [1].
The host-pathogen interaction between Mycobacterium tuberculosis and humans varies from hypothetical elimination by innate immune response to disseminated infection. Knowledge of the immunological events for the early phase of M. tuberculosis infection in humans is limited [23]. Interferon-γ release assays (IGRAs) are one of immunologic tests that help physicians diagnose TB and latent M. tuberculosis infection (LTBI) by determining the immunologic response to M. tuberculosis antigens [4]. The QuantiFERON-TB Gold In-Tube (QFT-GIT) (Qiagen, Hilden, Germany) is one of the most widely used IGRAs. QFT-GIT is an in vitro diagnostic test using a peptide cocktail of ESAT-6, CFP-10, and TB7.7 proteins to stimulate cells in heparinized whole blood. Interferon-γ (IFN-γ) is then detected by enzyme-linked immunosorbent assay (ELISA) to identify the in vitro responses to these peptide antigens associated with M. tuberculosis infection.
The value of the quantitative interferon-γ response in QFT-GIT for predicting progression from M. tuberculosis infection to active disease has been investigated in several studies. Very high interferon-γ conversion values (>4.0 IU/mL) were associated with substantially increased risk of TB disease compared to non-converters or converters with lower interferon-γ values (0.35–4.0 IU/mL) [5]. Individuals who showed changes in interferon-γ values from less than 0.2 to greater than 0.7 IU/mL had 10-fold higher tuberculosis incidence rates than those who maintained values less than 0.2 IU/mL [6]. The hazard ratios for TB were increased with rising interferon-γ concentrations, indicating that the interferon-γ levels may be used to guide the targeted treatment of LTBI [7]. These may imply that the quantitative interferon-γ values to TB antigens reflect the host immune response.
As a positive control in QFT-GIT, interferon-γ response to the polyclonal T cell stimulus, phytohemagglutinin (PHA) is used to monitor an individual's immune status. A significantly higher discordance in serial QFT-GIT was observed in patients with a low PHA interferon-γ response [8]. The low PHA-stimulated interferon-γ response was associated with poorer clinical outcomes in patients with lung cancer, patients with systemic lupus erythematosus, and in recipients of allogeneic hematopoietic stem cell transplantation [91011].
However, the significance of the quantitative interferon-γ response in active TB is rarely known. We aimed to investigate the variations in quantitative interferon-γ response of active TB patients over time, with serial QFT-GIT from a country with intermediate TB burden. We also assessed the association between the interferon-γ response to PHA, TB antigens, and infection sites in active TB.
MATERIALS AND METHODS
1. Study populations
From April 2011 to February 2015, patients who were consecutively referred to the QFT-GIT for laboratory testing were searched at Dong-A University Hospital. During this period, 3,693 tests were performed and 300 of them were referred for more than 2 tests. Among subjects who underwent the serial test, active TB patients were selected for this study. The medical records of 102 active TB patients were retrospectively reviewed for demographic information, infection sites, tuberculosis treatment, and the quantitative response to nil, mitogen, and TB antigen. The bacillus Calmette—Guérin (BCG) vaccine is mandatory according to the Korean National vaccine schedule and IGRA is preferred [4]; therefore, the tuberculin skin test was not performed. None of the patients was positive for antibodies against human immunodeficiency virus. This study was approved by the Institutional Review Board (18-196).
2. Clinical categories of TB and treatment
The clinical categories of TB were based on the clinical, histological, radiological, and microbiological information collected during the first QFT-GIT performed. Patients classified as having confirmed TB were those who had a positive result in the culture or in a PCR assay for M. tuberculosis. Patients were classified as having probable TB if anti-TB treatment was effective and met one of the following criteria: biopsy revealed caseous necrosis, or a clinical picture of pleural, peritoneal, or synovial disease associated with extrasanguineous fluid changes consistent with TB. For patients with suspected TB meningitis, the proposed consensus case definition of TB meningitis was followed [12]. All patients were administered standardized anti-TB medication consisting of daily isoniazid (INH), rifampicin (RMP), ethambutol (EMB), and pyrazinamide (PZA) for 2 months, followed by daily INH, RMP, and EMB for 4 months.
3. QFT-GIT assay
The QFT-GIT was performed according to the manufacturer's instructions. Whole blood was collected directly into the manufacturer-provided nil, TB antigen, and mitogen tubes and was transported to the laboratory as soon as possible. All tubes were incubated for 16–24 hr at 37℃ according to the manufacturer's instruction. ELISA optical density (OD) was read using a CODA microplate processor (Bio-Rad, Hercules, CA, USA). Four IFN-γ standard calibrators (4, 1, 0.25, and 0 IU/mL) in duplicate were used to create standard curves for each assay. The OD values were then input into the QFT Gold analysis software v 2.50.4. The software reported the test results automatically according to the manufacturer's specifications.
The nil response (Nil) was the concentration of IFN-γ in plasma from unstimulated blood. The mitogen response was the concentration of IFN-γ in plasma from PHA-stimulated blood minus Nil. The TB response was the concentration of IFN-γ in plasma from blood stimulated by a cocktail of peptides representing ESAT-6, CFP-100, and part of TB7.7, minus Nil.
The QFT-GIT results for each patient were interpreted according to the manufacturer's criteria. The conversion of the result was defined as negative QFT-GIT at the baseline and positive QFT-GIT at the follow-up; reversion of QFT-GIT was defined as positive QFT-GIT at the baseline and negative QFT-GIT at the follow-up. Briefly, the QFT-GIT result was defined as positive if the IFN-γ level of Nil was ≤8.0 IU/mL and that of TB antigen minus Nil was ≥0.35 IU/mL and ≥25% of Nil value. Negative results were defined if the IFN-γ level of Nil was ≤8.0 IU/mL, that of mitogen minus Nil was ≥0.5 IU/mL, and that of TB antigen minus Nil was <0.35 IU/mL or <25% of Nil value. The results were reported as indeterminate if the IFN-γ level of Nil was ≤8.0 IU/mL, that of TB antigen minus Nil was <0.35 IU/mL or ≥0.35 IU/mL and <25% of Nil value, and mitogen minus Nil was <0.5 IU/mL (positive control failure) or if the IFN-γ level of Nil was >8.0 IU/mL (negative control failure).
4. Statistical analysis
Data were expressed as medians and ranges or numbers (percentages). Pearson's χ2 test or Fisher's exact test was used to analyze the categorical variables. Differences in the interferon-γ response in infection sites were analyzed using the Kruskal–Wallis test. Spearman's correlation coefficient rho was used as the index of correlation for non-parametric data. All P values <0.05 were considered statistically significant. Data analysis was performed using MedCalc Software (ver. 12.6.1, MedCalc Software, Ostend, Belgium).
RESULTS
1. Demographic and clinical characteristics of patients
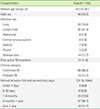
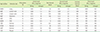
One hundred two active TB patients with serial QFT-GIT were included in this study. The median age of patients was 47 years, and 39% were men. The distribution of infections was examined by the site of infection; 20 (19.6%) were pulmonary, 68 (66.6%) were extrapulmonary, and 14 (13.7%) were multiple sites. Twelve patients (11.8%) had undergone previous treatment for active Tb. Of the 102 patients, 88 (86.3%) were confirmed TB. The median length of the interval between the first and second tests was 231 days (range 0–1044). The characteristics of the population with serial QFT-GIT are summarized in Table 1.
2. Quantitative IFN-gamma response according to the infection site
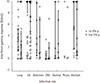
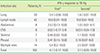
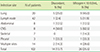
The quantitative interferon-γ response to TB antigens was significantly different according to the infection sites (P=0.0001 for the first interferon-γ response; P=0.0002 for the second interferon-γ response) (Table 2). The distribution plot of the interferon-γ response according to infection sites is shown in Fig. 1. The median of the IFN-γ response was the highest in lymph node infection (10.0 IU/mL) and the lowest in central nervous system (CNS) infection (0.02 IU/mL). Overall, the median value tended to decrease in the second test, but the patients with CNS and skeletal infections showed slightly increased results.
3. Distribution of qualitative results in serial testing
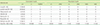
Table 3 shows the summary of the first and second QFT-GIT test results in 102 TB patients. Of the total, 86.3% showed concordant results in serial testing. Seventy-seven (75.5%) patients were concordantly positive in serial tests. The concordantly positive results were observed only in 25% of the CNS infection. Distribution of results in 14 patients with discordant serial QFT-GIT tests showed that 9 patients changed from positive to negative or indeterminate. Six (5.9%) patients showed reversion. Both 50% of patients with persistent negative results and 62.5% of patients with CNS TB had an insufficient IFN-γ response to mitogen (Table 4).
The discordance of QFT-GIT tests and lower mitogen response (<10 IU/mL) did not differ significantly according to the infection sites (P=0.06; P=0.2176). However, Spearman's correlation coefficient between the discordance of QFT-GIT tests and lower mitogen response (<10 IU/mL) was significant (rho=0.796; P=0.0322) (Table 5).
DISCUSSION
Extrapulmonary TB accounts for 20% of all TB cases and over 50% of cases in immunocompromised individuals [1314]. Two thirds of our active TB patients had an extrapulmonary origin, because IGRA plays a supporting role in the diagnosis of extrapulmonary TB [15]. To our knowledge, this is the first study to investigate the quantitative interferon-γ response according to the infection sites in patients with active TB. We found that the quantitative interferon-γ response to TB antigens differed significantly according to the infection sites and that the median IFN-γ response was the highest in lymph node infection and the lowest in CNS infection.
It is accepted that M. tuberculosis can migrate from the primary infection site of the lung to the lymphatic system and bloodstream. CNS infection by M. tuberculosis is one of the most serious complications of TB. We showed the lowest interferon-γ response to TB antigen and that only one-quarter of patients with CNS infection had concordantly positive QFT-GIT results. This finding is similar to a recent study showing that tuberculous meningitis was a risk factor for false-negative results in T-SPOT.TB (Oxford Immunotec, Oxford, UK) [16]. In a prospective study, sensitivities of the T-SPOT test differed according to the site of infection and the blood T-SPOT test was less sensitive in patients with TB meningitis or miliary TB than in patients with lymph node or osteoarticular TB. Additionally, the T-SPOT was more sensitive in immune competent than in immunocompromised patients [17]. Though little is known regarding the immunologic characteristics in patients with CNS TB, it is reported that protein, albumin, CD3, and CD4 counts are low in these patients [18]. In our study, a low interferon-γ response to mitogen was most frequently observed in patients with CNS TB. The low mitogen response is known a cause of indeterminate results; further, it is reported that the discordance in the serial IGRA test was significantly high in patients with a low mitogen response [8]. An indeterminate IGRA result was associated with greater odds of both disseminated TB (miliary or combined pulmonary and extrapulmonary) and death in a study on 24,803 persons with culture-confirmed TB [19]. These reports are consistent with our findings showing a higher frequency of low mitogen response and increased discordant results in patients with CNS TB.
The median of the interferon-γ response to TB antigen in lymph node infection was 500 times higher than that in CNS infection. This variability has also been observed in recent studies on whole-blood transcriptional signatures in active TB patients [2021]. The heterogeneity in TB is apparent and this diversity is suggested to be based on host genetics, inflammation and immune response of the granuloma, and the M. tuberculosis bacterial population [22]. Our findings show that these variable states could also be demonstrated in the interferon-γ response to TB antigen in patients with active TB. The significance of the quantitative interferon-γ response in QFT-GIT for predicting progression from M. tuberculosis infection to active disease has been reported recently [567], and the value of the quantitative interferon-γ response in active TB could be recognized through further study.
In a study on 2302 health care workers in the United States who underwent at least 2 QFT-GIT tests at 1 year intervals, 93.5%, 1.6%, 1.3%, and 3.1% had concordantly negative, concordantly positive, reverted, and converted results, respectively [23]. The reversion rate observed in our study was 5.9%, which was lower than that reported previously when monitoring the response to treatment (8–48%) [24]. This could be explained by the higher proportion of patients with lymph node infection in this study. The median level of quantitative interferon-γ to TB antigen (10 IU/mL) in tuberculous lymphadenitis was the highest among infection sites and could be explained by a previous study showing that elevated frequencies of CD4+ T cells expressing interferon-γ were present in individuals with tuberculous lymphadenitis compared to those with pulmonary TB [25]. The sites of TB infection should thus be considered when interpreting the results of IGRA and it should be noted that the variability of IGRA results would be affected by the infection sites of TB.
In our study, nearly ten percent of patients showed concordantly negative QFT-GIT results. These falsely negative findings in culture-proven active TB have also been observed in other studies [262728]. Approximately 8-19% of patients had a negative IGRA result when presenting active TB [29]. Most previous studies performed a single IGRA test but we conducted a serial test in this study. This makes it evident that some individuals with active TB do not develop M. tuberculosis-specific adaptive immune responses for a period of time. The risk factors for falsely negative IGRA were advanced age, bilateral involvement on chest radiography, malignancy, lymphocytopenia, or HIV co-infection [262728]. We observed a similar finding that the elderly (>60 years) accounted for 70% of patients with repeatedly negative results in QFT-GIT. Interestingly, half of the 10 patients with concordantly negative results showed an insufficient IFN-γ response to mitogen (<10 IU/mL). An inadequate IFN-γ response to PHA has shown prognostic value for poorer clinical events in HIV-1-infected patients and in various disease categories [9101130]. A recent study showed negative IGRA results as a significant predictor for death within 1 year of TB diagnosis among culture-confirmed M. tuberculosis–infected patients [28]. Although the authors did not analyze the immunologic and genetic details in these patients, higher mortality may be associated with an inadequate IFN-γ response to PHA. Therefore, an immunosuppressive state that appears as decreased production of interferon-γ in response to mitogen could be an explanation for the repeatedly negative results of QFT-GIT.
A similar finding was observed in the diagnosis of LTBI as well as active TB. Active TB development in patients treated with tumor necrosis factor antagonists between the IGRA negative and IGRA positive group were not different in a country with intermediate TB burden [31]. In a contact investigation study in 10 European countries, the development of TB was observed in subjects with negative IGRA results without preventive chemotherapy [32]. These results imply that some subjects with negative IGRA result had an elevated risk of active TB and that these could hamper the predictive power of IGRA. Regardless of active TB, some of the population could be presumed to have decreased interferon-γ production by stimulation with the peptide cocktail of TB antigens. It remains unclear why some individuals have an unsuccessful M. tuberculosis-specific immune response. This may be affected by the difference in interferon-γ production based on the human leukocyte antigen (HLA)-DR type [33] or an age-related decline in interferon-γ production after antigen stimuli [34].
Our study has some limitations. First, the data analysis was conducted retrospectively and the test interval was not uniform. Second, number of patients for some infected sites was small. Therefore, the power of our study to determine the impact of quantitative interferon-γ may be weak. Further studies are thus necessary to determine the host genetic background and bacterial heterogeneity that affect the quantitative interferon-γ results [22].
In summary, we showed that the quantitative interferon-γ response to TB antigens differed significantly with the infection sites and that the variability of IGRA results would be affected by the site of TB infection. A considerable number of patients with concordantly false-negative QFT-GIT results or CNS TB infection failed to produce an adequate IFN-γ response to mitogen; thus, it is necessary to study the underlying mechanisms in these unresponsive patients.
 XML Download