

 PDF
PDF ePub
ePub Citation
 Print
Print


INTRODUCTION
Urine albumin-to-creatinine ratio (UACR) and urine protein-to-creatinine ratio (UPCR) have been widely used in clinics because 6338they can be easily analyzed, and correlate well with urine albumin and protein excretory levels; urinary albumin loss of 30 mg/24 hr is equivalent to UACR of 30 mg/g and urinary protein loss of 150 mg/24 hr is equivalent to UPCR of 0.15 g/g [123].
Although the primary intended use of UACR is screening for albuminuria in diabetes patients, UACR is also a useful predictor of cardiovascular events in adults and an early marker of endothelial dysfunction in young individuals under 19 years old [4567]. The 2015 American Diabetes Association guidelines recommend that albuminuria should be screened using a random spot urine sample for UACR in patients with diabetes at least once a year [8]. Moreover, the National Institute for Health and Care Excellence guidelines recommend that UACR should be preferred over UPCR to detect and identify proteinuria because UACR has higher sensitivity than UPCR for low levels of proteinuria [9].
The clinical utility of UPCR has been underestimated. However, a recent study revealed that nonalbumin proteinuria showed sifnificant association with chronic kidney disease (CKD) progression in patients with type 2 diabetes, and thus, UPCR remains an important marker for screening CKD [10]. UPCR is also used for diagnosing pre-eclampsia in patients with hypertension [1112]. Therefore, both UACR and UPCR are useful markers to screen for and diagnose CKD and other aforementioned diseases.
UPCR or UACR is measured via quantitative assay or strip test, with the strip test being the more preferred method while screening for proteinuria or albuminuria because it is cheaper and faster than quantitative assay [13]. Hence, the reliability of the strip test for assessing UPCR and UACR accurately while screening for proteinuria and albuminuria needs to be investigated. In this study, we evaluated the performance of the MEDITAPE UC-11A strips (Sysmex, Kobe, Japan) compared with that of a quantitative assay for detecting both UPCR and UACR.
MATERIALS AND METHODS
1. Specimens
Fresh spot urine samples without preservatives were collected from regular health checkup examinees, inpatients, and outpatients at Haeundae Paik Hospital, Busan, Korea, from February 2017 to July 2017. A total of 870 specimens were collected. After applying the following exclusion criteria which interfere in the analysis of albumin and protein levels: (1) those positive for hemoglobin or myoglobin (≥5 mg/dL), (2) those with gross hematuria, (3) those with a high specific gravity (SG ≥1.030), and (4) pH of ≥8.0, 808 individuals were recruited in the testing and analysis. All the urine specimens were analyzed within four hours after collection. This study was approved by our institutional review board (Approval No: HPIRB 2017-02-007). The need for informed consent was waived because residual urine samples were used.
2. MEDITAPE UC-11A strip test
Urine albumin, protein, and creatinine levels were measured by a laboratory technician using the MEDITAPE UC-11A strips with the automated strip reader UC-3500 (Sysmex).
The principle of measuring protein and albumin levels in urine samples included a reaction between tetrabromophenol blue and protein, and creatinine was measured using the Benedict-Behre method [14]. Protein concentration was measured as 0, 0.15, 0.3, 1, 3, or 10 g/L; albumin concentration was measured as 10, 30, 80, 150, or >150 mg/L; and creatinine concentration was measured as 10, 50, 100, 200, or 300 mg/dL. UACR was calculated automatically according to the settings in the analyzer, and the results were presented as diluted, normal, 1+ (30, 80, and 150 mg/g), ≥1+ (≥80 and ≥150 mg/g), or 2+ (≥300 mg/g). Meanwhile, UPCR was calculated as diluted, normal, 0.15 g/g, 0.3 g/g, or ≥0.5 g/g. The diluted sample indicated that the urine is too diluted for accurate calculation of the UACR and the UPCR. Before starting the analysis, within and between-run precisions and carry-over measurements were evaluated with control materials, UC-Control level 1 and UC-Control level 2 (Sysmex) to ensure internal quality control.
3. Quantitative assay
The concentrations of albumin, protein, and creatinine in urine samples were measured with a Hitachi 7600 (Hitachi, Tokyo, Japan) via pyrogallol red method using AR Series Micro TP-AR 2 (Wako pure chemical industries, Ltd., Osaka, Japan), turbidimetric immunoassay via Autokit Micro Albumin (Wako Pure Chemical Industries, Ltd., Osaka, Japan), and Jaffe method via Clinimate CRE (Sekisui Medical, Ibaraki, Japan). UACR and UPCR were categorized as normal to mildly elevated (<30 mg/g and <0.15 g/g), moderately elevated (30–300 mg/g and 0.15–0.5 g/g), or highly elevated (>300 mg/g and >0.5 g/g) to compare them to those obtained by the MEDITAPE UC-11A strip.
4. Statistical analysis
Statistical analysis was performed using SPSS version 23.0 (IBM Corp., Armonk, NY, USA). Data distributions were evaluated using the Kolmogorov-Smirnov test. The variables that did not show a Gaussian distribution were expressed as the median (range).
Concordance rates and kappa coefficients with 95% confidence intervals (CIs) were calculated to analyze the concordance between the MEDITAPE UC-11A strip and the quantitative assay. A kappa value above 0.75, between 0.40 and 0.75, and below 0.40 represented excellent, fair to good, and poor agreements, respectively. We evaluated the sensitivity, specificity, positive predictive value (PPV), and negative predictive value (NPV) of the UACR and UPCR obtained via MEDITAPE UC-11A strip using a UACR and UPCR cut-off value of 30 mg/g and of 0.15 g/g, respectively, obtained via quantitative assay to predict albuminuria and proteinuria [123].
RESULTS
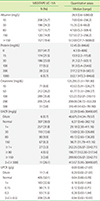
MEDITAPE UC-11A strip test with UC-3500 had satisfactory intra- and inter-assay precisions, and no carry-over was detected while examining the control materials. Table 1 describes the distribution of albumin, protein, creatinine, UACR, and UPCR in the 808 random urine specimens according to MEDITAPE UC-11A assessments. The median values and ranges of albumin, protein, creatinine, UACR, and UPCR increased in both MEDITAPE UC-11A assessment and quantitative assay, except for the diluted specimens.
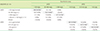
Table 2 shows comparison of the UACR and UPCR in 808 samples analyzed using the MEDITAPE UC-11A strip test with those analyzed using the quantitative assay. On the MEDITAPE UC-11A, a total of 307 (38.0%), 257 (31.8%), and 211 (26.1%) specimens exhibited a UACR of <30 mg/g, 30–300 mg/g, and >300 mg/g, meanwhile, 405 (50.1%), 183 (22.6%), and 209 (25.9%) specimens exhibited a UPCR of <0.15 g/g, 0.15–0.5 g/g, and >0.5 g/g, respectively. On the quantitative assay, a total of 447 (55.3%), 219 (27.1%), and 142 (17.6%) specimens had a UACR of <30 mg/g, 30–300 mg/g, and >300 mg/g, respectively. Meanwhile, 479 (59.3%), 160 (19.8%), and 169 (20.9%) specimens had a UPCR of <0.15 g/g, 0.15–0.5 g/g, and >0.5 g/g, respectively.
The concordance rate between the MEDITAPE UC-11A strip test and quantitative assay for the UACR and UPCR in the same categories were 70.1% (543/775) with 0.533 of kappa coefficient (95% CI, 0.485–0.581) and 78.7% (627/797) with 0.643 of kappa coefficient (95% CI, 0.598–0.688), respectively (Table 2). Using a UACR and UPCR cut-off of 30 mg/g and 0.15 g/g, respectively, the concordance for the UACR and UPCR was 80.5% (646/802) with 0.621 of kappa coefficient (95% CI, 0.570–0.671) and 86.7% (691/797) with 0.733 of kappa coefficient (95% CI, 0.687–0.780), respectively. False-negative and false-positive UACR results were obtained via the MEDITAPE UC-11A strip test in nine cases (1.1%) of 35.16–262.15 (median: 42.37) mg/g and in 147 cases (18.3%) of 2.30–29.85 (median: 13.79) mg/g among 802 samples, respectively. False-negative and false-positive UPCR results were obtained via the MEDITAPE UC-11A strip test in 18 cases (2.3%) of 0.15–0.78 (median: 0.185) g/g and in 88 cases (11.0%) of 0.02–0.14 (median: 0.09) g/g among 797 samples, respectively. The distributions of false-positive UACR and UPCR results were different according to the grade of assessment. False-positive results for UACR were observed in 75 cases (68.2%) among 110 specimens of 30 mg/g, in 56 cases (70%) among 80 specimens of 80 mg/g, in 14 cases (20.9%) among 67 specimens of 150 mg/g, and in 11 cases (5.2%) among 211 specimens of ≥300 mg/g. No false-positive result was obtained among the 27 specimens with UACR of ≥80 and ≥150 mg/g. False-positive results for UPCR were obtained with MEDITAPE UC-11A strips in 57 cases (63.3%) among 90 specimens of 0.15 g/g, 17 cases (18.3%) among 93 specimens of 0.3 g/g, and 14 cases (6.7%) among 209 specimens of >0.5 g/g.
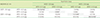
The results of the combination of UACR and UPCR except 11 dilute specimens are shown in Table 3. The concordance rate between the MEDITAPE UC-11A strip test and quantitative assay in the same categories was 74.4% (593/797). A total of 100 specimens were either UACR ≥30 mg/g or UPCR ≥0.15 g/g on the MEDITAPE UC-11A strips, and only one specimen with a UACR of <30 mg/g and with UPCR of ≥0.15 g/g was confirmed to be negative for albuminuria or proteinuria via the quantitative assay. Meanwhile, 73 (73.7%) of the 99 specimens with UACR ≥30 mg/g and with UPCR <0.15 g/g on the MEDITAPE UC-11A strips were confirmed to be negative for albuminuria or proteinuria via the quantitative assay. Specifically in these 74 specimens, the UACR was 2.30–29.84 (median: 10.12) and the UPCR was 0.00–0.13 (median: 0.05) g/g as evaluated by the quantitative assay.
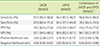
The sensitivity, specificity, PPV, and NPV of UACR and UPCR analyzed using MEDITAPE UC-11A are shown in Table 4. The combination of UACR and UPCR improved the sensitivity and NPV of UPCR and the specificity and PPV of UACR.
DISCUSSION
We evaluated the performance of the MEDITAPE UC-11A strips, for the first time, compared with a quantitative assay for detecting both UACR and UPCR using 808 specimens. In the current study, the sensitivity, specificity, and NPV of the strip test for detecting albuminuria was 97.5%, 67.0%, and 97.1%, and the sensitivity, specificity, and NPV for detecting proteinuria was 94.4%, 81.5%, and 95.6%, respectively. Meanwhile, in previous studies that evaluated other UACR and UPCR strip tests, the sensitivity, specificity, and NPV for detecting albuminuria (UACR >30 mg/g) was 37%–92.0%, 72.2%–98%, and 84.9%–99% respectively [15,16,17,18,19], and the sensitivity, specificity and NPV for detecting proteinuria (UPCR >0.15 g/g) was 36%–75.6%, 95.9%–97%, and 91%–96%, respectively [2021]. Our results showed relatively higher sensitivity and NPV, and lower specificity for detecting both albuminuria and proteinuria compared to those of the previous studies that evaluated other UPCR and UACR strip tests. The lower specificity found in this study is attributed to the high proportion of false-positive results which is preferable to the occurrence of false-negative test results for the screening test, but false-positive UACR and UPCR results showed different distributions according to the grade of assessment in this study. UACR results of 30 mg/g and 80 mg/g exhibited higher rate of false-positive results than those of 150 mg/g in the same semi-quantitative results, and similarly, UPCR results of 0.15 g/g exhibited higher rate of false-positive results than 0.3 g/g. Therefore, numerical assessment appears to be more useful than semi-quantitative results such as 1+. Additional clinical management techniques, such as follow-up or additional tests, should be considered depending on the grade of assessment.
Moreover, we evaluated the results of combination of UACR and UPCR obtained by the MEDITAPE UC-11A strips, and the sensitivity and specificity for detecting either or both UACR ≥30 mg/g and UPCR ≥0.15 g/g was 96.8% and 70.2%, respectively. UACR has been considered superior to UPCR at low protein concentrations, although UPCR has shown a superior performance to UACR in predicting 24-hour proteinuria [22]. In the current study, the combination of UACR and UPCR complemented the clinical performances of UACR and UPCR.
Diluted results were interpreted in various ways in previous studies [1721]. McTaggart et al. [17] classified diluted samples with undetectable creatinine concentration on the strip test as normal, Chang et al. [21] classified 39.2% of diluted samples with creatinine concentration of less than 50 mg/dL as exhibiting significant proteinuria. Diluted results were detected for six of the UACR samples and 11 of the UPCR samples in the current study, and four (66.7%) of these six dilute specimens of UACR exhibited albuminuria and seven (63.6%) of the eleven dilute specimens of UPCR exhibited proteinuria. Therefore, specimens with dilute result are not normal, and additional tests should be performed to confirm albuminuria and proteinuria.
In summary, this study is the first performance evaluation of MEDITAPE UC-11A strip test compared with a quantitative assay for detecting both UACR and UPCR. MEDITAPE UC-11A strip test showed a relatively higher sensitivity and NPV compared to other UPCR and UACR strip tests reported. Therefore, the MEDITAPE UC-11A strip test is an appropriate screening test to rule out albuminuria and proteinuria, especially in a medical setting, such as a primary care facility or an emergency room, since quantitative tests are common in medical institutions of general hospital or higher grade. Follow up positive screening with confirmatory testing to detect false-positive results must be performed. In addition, the specificity of the MEDITAPE UC-11A strip test for detecting albuminuria and proteinuria need to be improved to decrease the false-positive results.
 XML Download