

 PDF
PDF ePub
ePub Citation
 Print
Print


INTRODUCTION
Hepatitis B, a global public health problem, is associated with complications such as cirrhosis and hepatocellular carcinoma, and caused 887,000 deaths in 2015. The availability of a vaccine against hepatitis B has decreased the prevalence of hepatitis B virus (HBV) infection, but the reported prevalence rate is still 3.3% in South-East Asia [1]. The treatment strategies against chronic infections include the suppression of viral replication; however, no absolute cure exists. Serum hepatitis B e-antigen (HBeAg) and HBV DNA levels, the biological markers rejctive of viral replication and infectivity, are well-correlated [23]. However, discrepancies are often observed upon simultaneously tracking of both markers in patients with chronic hepatitis B (CHB) [4].
Some patients with CHB show HBeAg negativity but HBV DNA positivity; such an infection is termed as HBeAg-negative chronic (inactive) or HBeAg-negative CHB depending on the levels of HBV DNA and/or alanine aminotransferase (ALT) [56]. There are cases wherein HBeAg result is positive but HBV DNA is undetected (less than the limit of quantitation [LOQ], i.e., HBV DNA [−]); there is no corresponding typical clinical phase in the natural course of CHB, and the prediction of disease activity and histopathological liver damage is difficult. This phenomenon is observed when the concentration of serum HBV DNA is lower than the limit of detection, but covalently closed circular DNA may be latent as the template of virus protein synthesis in the liver [7].
The present study was conducted to understand the different clinical phases in patients with CHB and identify new analytical parameters to improve the management of patients with CHB that are HBeAg-positive and have undetectable levels of HBV DNA.
MATERIALS AND METHODS
1. Data and sample collection
We collected pairs of HBeAg and HBV DNA samples from a medical foundation in Seoul, Korea, throughout 2016 and analyzed the resultant patterns for these markers in patients with CHB. We also collected follow-up laboratory results from a hospital from April 2015 to July 2018 to investigate the characteristics of patients with CHB according to the clinical phase. CHB was defined as the persistence of hepatitis B surface antigen (HBsAg) for more than 6 months. The patient data were grouped based on the five clinical phases of disease (immune-tolerant [IT], immune-active [IA], immune-inactive [II], immune-escape [IE], and HBeAg reversion [ER]). The definition of each phase is shown in Table 1 [56]. Among the pairs of samples collected in 2016, some HBeAg (+) and HBV DNA (−) samples were simultaneously collected and evaluated for ALT level to investigate the association between ALT and HBV DNA levels.
A total of 111 samples were obtained from patients with CHB, including 104 serum samples with HBeAg (+) and HBV DNA (−), five serum samples with HBeAg (+) and HBV DNA (+), and two serum samples with HBeAg (−) and HBV DNA (−). The HBeAg (+) sample was limited to at least a 10.0 signal to cutoff (S/CO) value, considering the variability near the cut-off value of 1.00. All cryopreserved (−20℃) samples were used for the comparative evaluation of the semi-quantitative and quantitative HBeAg assays. The institutional review board of Jangwon Medical Foundation (IRB_2017006), Seoul, Korea, approved this study.
2. Measurement assays
The serum HBeAg status was assessed with the Architect i2000SR analyzer (Abbott Laboratories, Abbott Park, IL, USA) using a semi-quantitative HBeAg assay (Abbott Laboratories, Diagnostics Division, Wiesbaden, Germany). The HBV DNA viral load was determined using Roche COBAS AmpliPrep/COBAS TaqMan HBV assay (Roche Molecular Diagnostics, Basel, Switzerland). This is an automated real-time PCR assay that targets the precore and core regions of HBV genome. The LOQ is 20.0 IU/mL and the assay offers a dynamic range of 20.0 to 1.7×10⁸ IU/mL for HBV DNA. The level of ALT was measured with Beckman Coulter AU5800 (Beckman Coulter, Brea CA, USA). The reference range for ALT, as claimed by the manufacturer, is 4–43 IU/L.
The quantitative HBeAg assay (Abbott Laboratories, Sligo, Ireland) was conducted with Architect i2000SR analyzer (Abbott Laboratories) using 6-point calibrators (0.00–700.00 Paul Ehrlich Institute units per milliliter [PEI U/mL]). HBeAg concentration of 1 PEI U/mL corresponds to 1 IU/mL (multiplying by a conversion factor of 1). The lower limit of detection claimed by the manufacturer is 0.09 IU/mL, and the linear range of quantification is 0.59–700.00 IU/mL. According to the manufacturer's instructions, the results that are below the measuring interval (<59 IU/mL) should be confirmed in a semi-quantitative HBeAg assay (Abbott Diagnostics).
3. Statistical analysis
Data were analyzed with the online GraphPad Prism software version 5.0 (GraphPad Software Inc., San Diego, CA, USA) and R version 3.5.1 software (2018 R Foundation for Statistical Computing). Continuous variables were presented as mean±standard deviation or median (interquartile range), while categorical variables were expressed as N (%). Wilcoxon rank sum test and Kruskal-Wallis rank sum test were used to compare continuous variables between the two groups. To compare categorical variables, Fisher's and chi-square tests were performed by creating a contingency table. The methods were compared by the kappa test for qualitative results and linear regression for quantitative results. P values (two-tailed) <0.05 were considered significant.
RESULTS
1. Patterns of serum HBeAg and HBV DNA levels in patients with CHB
A total of 15,911 paired results for HBeAg and HBV DNA levels were collected in 2016. Based on previous medical histories, only 2,291 pairs were identified as patients with CHB. All sets for patients with CHB were divided into four groups according to the combination of the two test results as follows: Group I (HBeAg [+] and HBV DNA [+], N=268), Group II (HBeAg [+] and HBV DNA [−], N=561), Group III (HBeAg [−] and HBV DNA [+], N=468), and Group IV (HBeAg [−] and HBV DNA [−], N=994). Only the last result of one patient from each group was included to prevent redundancy.
The strength of agreement was considered ‘poor’ between HBeAg and HBV DNA qualitative results (κ=0.003). In particular, two qualitative results were identical in approximately half of the cases (1,262 pairs, 55.1%) and discordance was reported in the remaining cases during the follow-up of patients with CHB. The mean age (±standard deviation) of patients from HBeAg (−) group (47.6±11.0 years, N=1,462) was approximately 5 years higher than that of the patients from HBeAg (+) group (42.7±10.7 years, N=829) (P<0.0001), and the mean age of the patients from HBV DNA (−) group (46.4±10.9 years, N=1,555) was approximately 2 years higher than that of the patients from HBV DNA (+) group (44.5±11.5 years, N=736) (P=0.0002). Among the groups showing discordance between two assays, most cases from groups II and III (>90%) showed relatively low HBeAg levels (<100.0 S/CO) and low HBV DNA levels (<20,000 IU/mL), respectively. HBV DNA levels were above each medical decision point (20,000 and 2,000 IU/mL) in 107 (12.9%) of 829 HBeAg (+) patients (sum of groups I and II) and 130 (8.9%) of 1,462 HBeAg (−) patients (sum of groups III and IV).
2. Comparison of the characteristics among different clinical phases
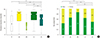
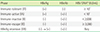
We obtained data from 1,146 patients with CHB from a specific hospital over the past 3 years, with an average follow-up of 34 months. For 10,192 datasets of HBeAg and HBV DNA levels, the positivity rate of HBeAg alone was 23.7% (2,402 results), while the detection rate of HBV DNA alone was 18.3% (1,868 results). Patients with CHB included 72, 336, 669, 190, and 23 subjects in the IT, IA, II, IE, and ER phase, respectively. HBeAg-negative CHB was reported in 16.5% of all patients with CHB (190 out of 1,146) and 22.6% of patients that experienced HBeAg seroconversion (190 out of 839). Clinical and laboratory data from the patients with persistent HBsAg positivity are summarized in Table 2. The disease duration and gender composition were significantly different among groups, but no significant difference was observed in patient age (Fig. 1).
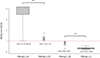
The median semi-quantitative level of HBsAg was significantly lower during the IT phase than in other phases (P<0.0001). Annually, HBsAg loss occurred in 0.18% of patients with CHB and 0.34% of patients in II phase (6 out of 1,146 patients for 34 months and 6 out of 669 patients for 32 months, respectively). Furthermore, the patients that lost HBsAg showed a gradual decrease in the semi-quantitative levels of HBsAg before elimination. Reversion of HBeAg occurred in 2.74% of patients (23 of 839) that experienced HBeAg seroconversion. Most patients (19 of 23) experienced seroconversion recurrence after just one reversion, while half of them experienced simultaneous hepatitis B e-antibody (HBeAb) reversion. In particular, the semi-quantitative values of HBeAg (+) or HBeAg (−) in ER phase were significantly different from those in IA and II phases (Fig. 2). The positive rates of HBeAb increased in the order of IT (0.0%), IA (9.3%), ER (34.8%), II (78.5%), and IE (81.0%) phase. A total of 39.0% of all patients with CHB acquired HBeAb.
3. Additional analysis of clinical serum samples from patients with CHB
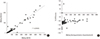
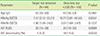
We divided the undetectable HBV DNA (HBV DNA [−]) status into ‘Target not detected’ and ‘Detected, but below the LOQ (20 IU/mL)’ for group II (HBeAg [+] and HBV DNA [−]), and observed statistically significant differences in both the levels and percentage abnormality of ALT (≥43 IU/L) between the two groups (Table 3). In addition, the results of semi-quantitative and quantitative HBeAg assays showed a concordance rate of 100.0%. A strong agreement (κ=1.000) in the qualitative results and a strong correlation (r2=0.9435, Y=0.4045X–8.5751, P<0.0001) in quantitative results were observed (Fig. 3).
DISCUSSION
Serum HBV DNA and HBeAg levels were initially evaluated at diagnosis and regularly monitored in patients with CHB. These markers are important indicators to evaluate the response of a patient to an antiviral therapy as well as to predict treatment outcomes and the emergence of antiviral resistance [589]. A significant (44.9%) discordant probability in the results of the two replicative markers was reported during the follow-up period of patients with chronic HBV infection. In particular, subjects with HBeAg (+) and HBV DNA (−) accounted for approximately one-quarter of the total data (23.7%). Consistent with the results of a previous report [3], we observed that the correlation between semi-quantitative HBeAg and HBV DNA levels was relatively poorer at low HBeAg level than at high HBeAg level. Single HBeAg (+) may be related to the mechanism of HBeAg protein production, which is independent of HBV DNA replication. Entecavir, a first-line monotherapeutic drug, inhibits HBV reverse transcriptase and consequently suppresses HBV DNA replication and reduces the HBV DNA level [10]. However, it may not directly inhibit the transcription and translation of the viral mRNA. Thus, HBeAg protein may be continuously produced regardless of HBV DNA synthesis, and HBeAg level may be reflective of the degree of transcription and translation of HBV mRNA or production of HBV DNA-negative virions in the liver [7]. Moreover, HBV DNA may disappear earlier (6 months) than HBeAg [1112].
We applied the definition of the clinical phase, and found that HBeAg (−) CHB showed a proportion (22.6%) similar to that previously reported (approximately 20%), including the patients that experienced HBeAg seroconversion [1314]. However, two findings from the present study may differ from those reported in previous studies [15]. First, the age difference between HBeAg (+) CHB (IA) and HBeAg (−) CHB (IE) groups was not significant. Our study was performed over a shorter duration than the duration of the natural course of CHB infection. The age range considered in this study reflects the initial time of diagnosis of patients with CHB at each clinical phase. Second, HBsAg levels were the lowest during the IT phase and no significant difference was observed between the other phases until the loss of HBsAg. According to previous studies, HBsAg level is the highest during the IT phase and gradually decreases after the progression of the clinical phase until the development of HBeAg (−) CHB [16]. The difference in the methodology (semi-quantitative [S/CO] versus quantitative [IU/mL]) may be the underlying reason for the observed discrepancy. A recent study revealed the good correlation between two HBsAg assays (r2>0.93), and our results of semi-quantitative HBsAg levels were similar to the previously known patterns (plateau after an initial increase) during the natural course of chronic infection [1718]. Other factors contributing to these differences may be the different definitions of phases (HBV DNA thresholds in IT and IA phases) and the characteristics of the study population (number and gender ratio).
In line with the results observed by Hsu et al (2.47%, 7/283) [11], we found that 23 (2.74%) of 839 patients that experienced HBeAg seroconversion showed HBeAg reversion. HBeAg reversion may occur mainly in the period between phase IA and phase II, considering the gradual increase in HBeAb positivity (%) over the entire course. Furthermore, the ER phase sustained for a relatively short period and showed distinct HBeAg level near the cut-off value (1.00 S/CO) as compared to that observed in other phases. Therefore, to inform the clinician of the transient nature of this phase in patients, we suggest the use of an intermediate range between positive and negative or the inclusion of a relevant description while reporting HBeAg level.
In the present study, the level and percentage abnormality of ALT (based on the claimed upper limit) were statistically different between the ‘Target not detected’ group and the ‘Detected, but less than LOQ’ group, including the cases with unqualified HBV DNA level. Data from clinical studies have shown that the true normal level of ALT was significantly lower than the previously established limits, i.e., 40 IU/L for males and 30 IU/L for females [19]. Based on the recent guidelines for antiviral therapy of patients with CHB, the serum HBV DNA and ALT thresholds are gradually decreasing and, thus, the ALT threshold is 30 IU/L for males and 19 IU/L for females, while the level is 2,000 IU/mL for HBV DNA (10,000 copies/mL) [2021]. We applied these recent thresholds of ALT to the dataset presented in Table 3, and found a statistically significant difference in ALT abnormality (%) between the two groups (25.5% vs. 45.7%, P=0.0038). We suggest that the clinical laboratories report the additional detail of ‘undetectable HBV DNA’ to improve the management of CHB. As the infectious material is not precisely detectable in the healthy population and that HBV is an important pathogen, it is essential to report the quantitative level of HBV DNA including the ‘gray zone’ to confirm the detection of an inaccurate value. In particular, all patients with HBV DNA between the limit of blank and LOQ should not be considered the same as the ‘Not detected’ group.
The qualitative HBeAg assay could help determine the relative infectivity of the patient and may be useful to monitor HBeAg seroconversion in acute HBV infection. HBeAg quantification may be useful to predict HBeAg seroconversion and therapy response in chronic HBV infection [1222]. In comparison with HBV DNA result, HBeAg quantitation showed a good concordance rate (78.7%) and similar change pattern in patients with CHB [12]. Our results showed that the semi-quantitative level (S/CO) of HBeAg was significantly different among clinical phases of CHB and strongly correlated (r2=0.9435) with quantitative HBeAg levels (IU/L) (Table 2 and Fig. 3). The quantitative HBeAg assay may provide reliable and comparable data for the follow-up of patients with CHB, particularly at the time of HBeAg seroconversion.
This study has several limitations in terms of design and conclusions. The clinical course of patients with CHB was characterized through a short follow-up period and included relatively small number of patients at each clinical phase. Future studies with larger patient number and longer follow-up period are warranted to verify the significant differences among the clinical phases. Moreover, a statistically significant difference was found in ALT between the ‘Target not detected’ group and ‘Detected and <LOQ’ group of HBV DNA; however, its clinical significance was not verified. For quantitative HBeAg assay, we performed only the comparative test and did not investigate its clinical usefulness in the management of CHB as compared with the semi-quantitative HBeAg assay.
In conclusion, this study reveals the clinical characteristics and detailed patterns of serum HBeAg and HBV DNA during different phases of CHB, which may help laboratory staffs to verify the related results in patients with CHB and provide information to physicians or patients. To improve patient care, we suggest the use of the intermediate range to interpret HBeAg results, separate reporting of HBV DNA results for ‘Target not detected’ and ‘Less than LOQ,’ and re-evaluation of the current reference range for ALT.

 XML Download