Journal List > J Korean Soc Radiol > v.81(1) > 1142004

윤 and Yoon: 척추의 확산강조 자기공명영상

Abstract

척추영상에 사용되는 확산강조영상의 기술적 측면, 양성과 악성 척추체 압박골절의 구분, 다발성골수종이나 전이암의 발견과 감별진단, 그리고 항암화학요법이나 방사선치료 후 반응 평가에 대해 기술하고자 한다.

초록

In this study, we evaluated the technical characteristics and usefulness of diffusion-weighted magnetic resonance imaging for discrimination between benign and malignant vertebral fractures, for detection and differentiation of multiple myeloma or metastases, and for response monitoring in malignant vertebral lesions after anticancer drug therapy or radiation therapy.

서론

척추의 신생물이나 골수의 상태를 평가하기 위한 자기공명영상(magnetic resonance imaging; 이하 MRI)의 기본적 펄스 시퀀스(pulse sequence)는 고속 스핀에코(fast spin echo, FSE) T1-강조영상(T1-weighted image; 이하 T1WI), T2-강조영상(T2-weighted image; 이하 T2WI), 지방억제 T2WI 혹은 short tau inversion recovery (이하 STIR) 영상, 그리고 조영증강 지방억제 T1WI 등이다. 이러한 영상기법으로 평가할 수 있는 척추골수의 이상 소견은 적색골수증식 등의 양성변화로부터 전이암 등 악성질환에 이르기까지 다양하다. 하지만, 각 질환 또는 상태의 영상 소견은 국소병소로부터 미만성 신호강도 변화, 때로는 골외병소형성(extra-osseous mass formation)까지 매우 다양하며, 나이에 따른 골수 조성의 정상 변화나 퇴행성 질환에 대한 골수의 반응도 신호강도에 영향을 주어 판독에 어려움을 겪는 경우가 드물지 않다(1).
확산강조영상(diffusion weighted imaging; 이하 DWI)은 체내에 존재하는 물 분자의 확산현상을 이용한 기법의 하나이다. 이 확산현상은 생체조직 내에서는 세포막과 세포 주변의 거대분자, 그리고 세포 구조물들에 의해 제한된다. 따라서, 조직 내의 물 분자 확산은 세포 외 공간에서 좀 더 쉽게 일어나 악성종양 등 세포 밀도가 높은 조직의 확산 정도가 염증성 병변 등 세포 외 공간이 넓은 조직보다 상대적으로 낮다(2). 주로 뇌신경 병변의 평가를 위해 개발되었으나, 점차 적용 분야가 확대되어 척추의 골수병변의 발견과 평가에도 널리 사용된다(34). 이 논문에서는 척추에 적용하는 DWI의 기술적 측면, 양성과 악성 척추체 압박골절의 구분, 다발성골수종(multiple myeloma, MM)이나 전이암의 발견과 감별진단, 그리고 항암화학요법이나 방사선치료 후 반응 평가에 대해 기술하고자 한다.

기술적 측면

DWI는 물 분자의 브라운운동을 신호강도로 표현하는 기술에 기반한다. 이는 선택한 펄스 열에 확산강조(diffusion-weighting; 이하 b value) 경사(gradient) 펄스의 쌍을 삽입함으로써 획득한다. 이 경사펄스의 강도, 지속시간, 그리고 간격 등이 b value에 영향을 주는 요소들이다. 낮은 b value에서는 물 분자의 양이 신호강도에 큰 영향을 주고, b value가 증가하면 거대분자 등에 의해 운동이 제한된 물 분자의 양이 신호강도를 결정하게 된다. 하지만 높은 b value 일지라도 낭종 증 등 물 분자의 양이 충분히 많은 경우에는 신호강도가 높게 나타난다. 이를 T2 shine through 효과라 한다. 두 개 이상의 다른 b value로 영상을 얻으면 해당 픽셀의 겉보기 확산계수(apparent diffusion coefficient; 이하 ADC)를 지수함수를 이용하여 계산할 수 있으며, 각 b value에서의 신호강도 차이가 클수록 ADC 또한 높은 값을 보인다. 생체조직에서 ADC는 10−3 mm2/s의 단위로 표현하며, 자유수(free water)는 20℃ 환경에서 약 2.0 × 10⁻³ mm2/s, 37℃ 환경에서는 약 3.1 × 10⁻³ mm2/s이며, 생체조직의 ADC는 대략 0.5~2.5 × 10⁻³ mm2/s의 범위를 가지며, T2 shine through 효과를 보이는 낭종과 같은 경우에도 ADC가 높아 운동이 제한된 물 분자의 양이 상대적으로 많아 ADC가 낮은 조직과 구분할 수 있다. 인체조직에서 ADC에 주된 영향을 주는 요소는 세포 밀도이다. 대부분의 악성 신생물은 세포 밀도가 높아 일반적인 조직보다 ADC가 낮아 병변을 발견하고 악성도를 예측하는 데 도움을 준다(456). DWI를 위한 b value의 선택은 병변 발견과 특성분석에 상당한 영향을 준다. 여러 개의 b value를 사용하면 진단에 도움이 되지만 검사 시간이 길어진다. 또한 높은 b value를 사용하면 세포 밀도가 높은 부위를 좀 더 선택적으로 나타낼 수 있으나, 한편 전반적인 영상의 신호가 낮아진다. 일반적으로 0~100 mm2/s 정도의 낮은 b value 영상과 600~1500 mm2/s의 높은 b value 영상을 얻고 이들을 이용하여 ADC 지도(map)를 얻는다. 매우 낮은 b value에서 픽셀의 신호강도는 조직의 확산도 외에 관류 정도에도 영향을 받아 ADC 측정에 교란변수로서 작용할 수 있다. 이러한 점도 b value 선택에 고려해야 할 요소이다. 1.5 테슬라 장비의 ADC 차이를 이용한 악성과 양성병변의 감별진단능력도 3 테슬라 장비와 비교하여 차이가 없다고 알려져 있어 폭넓은 장비의 이용이 가능하다(7).
척추의 DWI를 위한 최적의 기법의 선택은 쉽지 않은 경우가 많다. 대부분의 의료기관에서 임상 목적으로 시행하는 척추 DWI는 single-shot spin-echo EPI sequences (이하 SSEPI)를 사용하는데, 이는 검사 시간이 짧고 움직임에 덜 민감한 장점이 있다. 하지만 공간분해능이 낮고 자기장 균일도와 맴돌이 전류(eddy current)에 민감하다(89). 비교적 최근에 맴돌이 경사자장 장비의 성능 향상과 parallel-imaging acceleration, reduced-field-of-view acquisition techniques (101112), 그리고 dynamic slice-dependent shimming 등 펄스 열 최적화기법의 발전에 힘입어 SSEPI 기법의 영상 질(image quality)이 개선되고 있다(1011121314). 한편으로는 SSEPI의 한계를 극복하기 위해, 자기장 균일도에 영향을 적게 받는 multi-shot EPI, 자기감수성 차이에 덜 민감한 고속스핀에 코 펄스 열, 환자 움직임에 영향을 적게 받는 reverse fast imaging with steady-state precession sequence (SSFP) 등 다양한 대체 기법들이 사용되고 있다(15).

척추압박골절의 감별진단

인구 고령화에 따라 골다공증과 그로 인한 척추압박골절(osteoporotic vertebral compression fracture; 이하 OVCF)의 발생빈도가 증가하고 있다. 한편 전이암과 골수암 등에 의한 척추체의 압박골절(malignant vertebral compression fracture; 이하 MVCF) 또한 노령인구의 증가에 따라 이환율이 증가하고 있다. 두 질환의 예후와 치료방침이 크게 다르므로 이들의 정확한 감별진단은 임상적으로 매우 중요하다(16). 이들은 호발 연령이 유사하며, 뚜렷한 손상병력이 없이도 발생할 수 있어 구분이 쉽지 않다(17). 한 가지 고려해야 할 점은, 암 병력이 있는 환자는 질병 자체의 특성이나 치료 과정으로 인해 골다공증과 그에 따른 OVCF의 발생빈도가 상대적으로 증가할 수 있다는 것이다. 이러한 문제들은 OVCF와 MVCF의 구분을 더욱 어렵게 한다(1819).
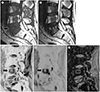
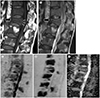
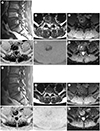
이 두 병변은 T1WI에서 저신호강도로 보이며 T2WI에서는 고신호강도로 보이고, 조영증강 정도와 형태는 다양하다(420). OVCF의 경우(Fig. 1) 이러한 전반적 신호강도의 변화는 골절에 동반된 골수부종과 출혈에 의하며, 골절선은 종판(endplate)과 가까운 골수에 이와 평행한 선형 저신호강도로 보인다(21). 골수부종이 없는 부위는 정상골수의 신호강도를 보이며, 후방구조물(posterior element)은 정상인 경우가 대부분이다(2021). MVCF는(Fig. 2) T2WI에서 골절선이 잘 안보이며 척추체 전체에 종양과 부종으로 인한 신호강도의 변화가 나타나는 경우가 많다(2021). 후방구조물의 이환, 볼록한 척추체 후방 경계, 척추 외 연부조직이나 경막외공간 침범 등은 MVCF를 시사하는 소견이다(2122). 이러한 MRI 소견이 두 질환의 감별진단에 상당한 도움을 주지만 쉽지 않은 경우도 종종 만나게 된다(22).
정상골수에 비해 양성과 악성 VCF는 모두 ADC가 증가하는데, 이는 부종, 출혈, 그리고 종양세포증식 등에 의한 골수 내 지방함량의 감소에 기인한다(23). MCVF는 상대적으로 높은 세포 밀도와 작은 세포 외 공간으로 인한 확산제한에 의해 높은 b value를 사용한 정성적 영상에서도 고신호강도를 보이며 ADC는 낮다(1724). 반면 OVCF는 세포 외 공간의 부피 증가로 인해 ADC가 높다(2526). 많은 연구자들이 VCF의 감별진단에 대한 DWI의 유용성을 입증하였는데 정성적 기법과 더불어 ADC 지도를 이용한 정량적 기법을 더하는 것이 좀 더 진단 정확도를 높인다고 보고하였다(1522272829). 한 메타분석 연구에서 전형적인 MVCF의 ADC의 범위는 0.7~1.3 × 103 mm2/s, 개별 연구 결과들의 평균값은 0.913 ± 0.354 × 103 mm2/s, 전형적인 OVCF의 ADC의 범위는 1.2~2.0 × 103 mm2/s, 평균값은 1.679 ± 0.531 × 103 mm2/s, 그리고 DWI의 MVCF 진단 민감도와 특이도는 약 89%와 87%로 보고하였다(22).

전이암과 골수암 병소 발견

양자밀도가 낮아 T2 이완시간이 매우 짧은 피질 골과 달리, 골수는 상대적으로 많은 양의 지방과 물을 포함하고 있어 MR로 평가하기 적절한 조직이다. 정상골수는 혈액세포를 생성하는 적색골수와 지방세포가 주성분인 황색골수로 구성되는데, 이들의 구성비, 즉 물과 지방의 분포와 함량에 따라 신호강도가 결정된다(430). 척추의 골수는 연령이 증가함에 따라 황색골수가 주된 성분이 되며 체내 환경의 변화나 스트레스에 민감하게 반응한다. 빈혈, 항암화학치료, 만성 저산소증, 과립구집락자극인자(granulocyte colony stimulating factor) 치료 등 병적 상태나 치료 과정뿐 아니라 장거리 달리기에 의한 물리적 혈구용해증이나 임신 중 엽상 결핍 등도 적색골수증식을 유도할 수 있다(313233).
척추를 침범하는 전이암은 만성, 국소 병변, 혹은 이들이 복합된 형태 등, 다양한 모습으로 나타날 수 있다. 골수종, 림프종, 그리고 백혈병 등 혈액 종양은 주로 미만성으로 척추를 침범하며 피질골 파괴 빈도가 전이암에 비해 상대적으로 낮은 경향을 보인다(34). 피질 골이나 골소주 등의 파괴 등 CT에서 발견할 수 있는 병변이 아닌 골수에만 종양이 침범된 경우에는 MRI가 이를 직접 영상화할 수 있는 유일한 검사방법이다. 신호강도 변화와 조영증강 정도 및 형태 등을 분석하여 척추전이암과 골수종의 골 침범 병변을 발견하고 분류할 수 있으며, 병변의 범위와 주변 조직 침범 유무와 척수압박 정도 등을 정확히 평가할 수 있다(17). 정상 성인의 골수는 T1WI에서 고신호강도이므로 상대적으로 신호강도가 낮은 종양조직과의 대조도가 우수하여 병변 발견에 유리하다. T2WI와 조영증강 후 지방억제 T1WI 등의 기법으로 병변의 범위와 주변 조직 침범 유무, 그리고 성분 등에 대한 정보를 분석할 수 있다. STIR이나 지방억제 T2WI 기법으로 골수 내 병변의 발견에 도움이 되며, 특히 병변 주위 골수나 주변 조직의 부종 등을 민감하게 발견할 수 있다(35). 최근의 한 메타분석 연구에 의하면 MRI의 전이암 진단에 대한 민감도와 특이도는 80%~90%와 90%~95%에 달한다(36). 그럼에도 불구하고 골수 내 적색골수성분이 증가하거나, 그 분포가 불균질할 경우, 또는 골수 내 지방성분의 고갈이나 퇴행성질환이 동반된 경우, 악성 병변의 발견과 감별진단이 쉽지 않은 경우를 종종 경험하게 된다.
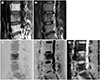
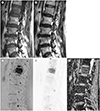
DWI는 종양의 세포 밀도에 대한 정보를 제공함으로써 악성 병변과 비종양성 변화를 구분하는데 도움이 된다(3738). DWI는 골수암 병변 발견에 대해 PET 검사보다 더욱 민감하다고 알려지며, 특히 미만성 질환의 발견에 우수하다(39). 하지만 골수 부종 등 조직 내 물 성분이 증가된 비종양성 변화 때에도 확산제한과 유사한 고신호강도가 높은 b value 영상에서 보이므로(Fig. 3) ADC 값을 이용한 정량적 분석을 반드시 병행하여야 한다(2940). 골수조직의 ADC는 0.2~0.6 × 103 mm2/s로 알려져 있는데, 이는 인체 내 다른 기관과 조직의 ADC 범위인 0.7에서 2.4 × 103 mm2/s보다 상대적으로 낮다(4). 악성종양의 ADC는 0.7~1.3 × 103 mm2/s로 알려져 있어 정상골수와 종양의 구분에 도움이 된다(Fig. 4). 하지만 지방함량이 매우 낮은 국소 적색골수증식, 감염성 척추염, 일부 양성 종양성 병변과 구분이 어려울 경우도 있으므로, 고식적 MR 기법의 영상 소견을 고려하여 종합적으로 판단하여야 한다(40).

치료 효과 판정

항암화학요법이나 방사선치료 후 치료 효과 판정을 위한 영상검사방법 중 T1WI를 중심으로 한 고식적 MRI가 중요한 역할을 한다(41). 이는 골수 내 병변의 크기와 부피를 정확하게 측정할 수 있는 재현성 높은 방법이다. 척추 종양의 치료 반응 평가를 연구하는 해외단체인 The SPine response assessment In Neuro-Oncology (SPINO) 그룹은 치료 전, 치료 후 1년 이내 매 2~3개월 마다, 1년 이후에는 매 3~6 개월마다 MRI로 치료 반응을 평가할 것을 권고하였다(36). 하지만, 고식적 MRI는 해부학적 변화에 기반한 정보이므로 종양의 병태생리적 변화나 생존력(viability) 등, 치료 후 초기에 나타나는 변화를 감지하지 못하는 단점이 있다. 최근의 연구들은 DWI의 정성적 그리고 정량적 분석을 더함으로써 고식적 MRI의 이러한 한계를 완화시킬 수 있음을 보고하였다(42). 치료에 잘 반응한 병변은 세포막이 파괴되어 자유수가 증가한다. 이러한 변화가 DWI에서 높은 신호강도와 ADC의 상승으로 표현되어, 고식적 MRI에서 구분할 수 있는 형태 변화가 시작되기 전에 치료에 대한 반응 정도를 예측하는 데 도움을 준다(Fig. 5) (23642). 하지만, 병변 내 출혈, 석회화, 그리고 골 증식 소견 등은 DWI의 정성적 신호강도와 ADC에 영향을 주어 진단에 어려움을 초래할 수 있다. 따라서 여러 종류의 전이암 또는 골수암을 대상으로 한 대규모 연구가 필요하다(43).
결론적으로, 척추는 전이암의 빈도가 매우 높은 부위이며, 이를 평가하기 위한 영상검사로 DWI를 포함한 MRI가 중요한 역할을 한다. 이는 압박골절의 원인감별, 골수 내 병변의 발견과 침범범위 평가, 그리고 치료 후 반응평가 등에서 우수한 성적을 보여, 그 유용성을 인정받고 있다.

Figures and Tables

Fig. 1

Benign vertebral fracture in a 62-year-old man with hepatocellular carcinoma with coexisting bone metastasis in the adjacent vertebra.

A. T1-weighted sagittal image showing decreased height of the L5 vertebral body (arrow) and low signal intensity lesions in the L3, L4, and L5 vertebral bodies.
B. T2-weighted sagittal image showing a band-like low signal (arrowheads) parallel with the upper endplate of the L5 vertebral body.
C, D. Diffusion-weighted images of b = 0 (C) and b = 800 (D) showing consistently increased signal in the L4 vertebral body (arrows) and seemingly decreased extent of the high signal area in the L5 vertebral body (arrowheads).
E. ADC map showing a low ADC value (0.8 × 10⁻³ mm2/s) of the L4 lesion, indicating a viable metastasis, and a relatively high ADC value (1.5 × 10⁻³ mm2/s) of the L5 lesion, indicating a benign compression fracture.
ADC = apparent diffusion coefficient
jksr-81-58-g001
Fig. 2

Pathologic fracture in a 71-year-old man with non-small cell lung cancer.

A, B. T1-weighted (A) and T2-weighted (B) images showing areas with heterogeneous low signal in the vertebral bodies and anterior wedging deformity (arrows) with posterior convexity of the T11 vertebral body (arrowheads).
C, D. Diffusion-weighted images with b = 0 (C) and b = 800 (D) showing diffusion restriction in multiple thoracolumbar vertebral bodies and spinous processes.
E. ADC map showing a low ADC value (0.9 × 10⁻³ mm2/s) of the T11 lesion, indicating a pathologic compression fracture.
ADC = apparent diffusion coefficient
jksr-81-58-g002
Fig. 3

Bone marrow edema adjacent to a Schmorl's node in a 24-year-old man with low back pain.

A, B. T1-weighted image (A) showing poorly defined slightly low signal area in the bone marrow of the L4 vertebral body (arrowheads); T2-weighted image (B) showing poorly defined fluid-like high signal area (arrow) with adjacent intermediate-to-low signal area in the bone marrow of the L4 vertebral body (arrowheads).
C, D. Diffusion-weighted images of b = 0 (C), showing increased signal area in the upper portion of the L4 vertebral body, and b = 800 (D), showing increased signal intensity (T2 shine-through effect) in the upper portion of the L4 vertebral body.
E. ADC map showing a high ADC value (2.3 × 10⁻³ mm2/s) of the L4 lesion, indicating a benign process.
ADC = apparent diffusion coefficient
jksr-81-58-g003
Fig. 4

Bone metastasis in the L1 vertebral body of a 56-year-old woman with advanced gastric cancer.

A. T1-weighted image showing an ovoid area with low signal intensity in the L1 vertebral body.
B. T2-weighted image showing iso- to slightly low signal intensity in the same area of the L1 vertebral body.
C, D. Diffusion-weighted images with b = 0 (C) and b = 800 (D) showing high signal intensity in the area of the L1 vertebral body, indicating diffusion restriction.
E. ADC map showing a low ADC value (0.8 × 10⁻³mm2/s) of the L1 lesion, indicating a viable bone metastasis.
ADC = apparent diffusion coefficient
jksr-81-58-g004
Fig. 5

MRI at baseline (A–F) and at 3 months follow-up (G–L) after radiation therapy for metastatic bone tumor in a 50-year-old woman with hepatocellular carcinoma.

A–C. T1-weighted sagittal (A), T2-weighted axial (B), and post-contrast T1-weighted axial (C) images showing a metastatic bone lesion with enhancement and central necrosis in the L5 vertebral body.
D, E. Diffusion-weighted images of b = 0 (D) and b = 1000 (E) showing diffusion restriction in the periphery of the bone lesion.
F. ADC map showing a relatively low ADC value (0.7 × 10⁻³mm2/s) in the non-necrotic enhancing portion, indicating a viable tumor with high cellularity.
G–I. T1-weighted sagittal (G), T2-weighted axial (H) and post-contrast T1-weighted axial (I) images showing decreased extent of the metastatic bone lesion with enhancement and central necrosis in the L5 vertebral body.
J–L. Diffusion-weighted images of b = 0 (J) and b = 1000 (K) showing decreased extent of diffusion restriction in the periphery of the bone lesion; ADC map (L) showing an increased ADC value (1.2 × 10⁻³mm2/s) in the non-necrotic enhancing portion, indicating decreased viable tumor burden.
ADC = apparent diffusion coefficient
jksr-81-58-g005

Notes

Conflicts of Interest The authors have no potential conflicts of interest to disclose.

References

1. Chokshi FH, Law M, Gibbs WN. Conventional and advanced imaging of spine oncologic disease, nonoperative post-treatment effects, and unique spinal conditions. Neurosurgery. 2018; 82:1–23.
crossref pmid
2. Gibbs WN, Nael K, Doshi AH, Tanenbaum LN. Spine oncology: imaging and intervention. Radiol Clin North Am. 2019; 57:377–395.
3. Tanenbaum LN. Clinical applications of diffusion imaging in the spine. Magn Reson Imaging Clin N Am. 2013; 21:299–320.
crossref pmid
4. Dietrich O, Geith T, Reiser MF, Baur-Melnyk A. Diffusion imaging of the vertebral bone marrow. NMR Biomed. 2017; 30:e3333.
crossref
5. Moore WA, Khatri G, Madhuranthakam AJ, Sims RD, Pedrosa I. Added value of diffusion-weighted acquisitions in MRI of the abdomen and pelvis. AJR Am J Roentgenol. 2014; 202:995–1006.
crossref pmid pmc
6. Maier SE, Sun Y, Mulkern RV. Diffusion imaging of brain tumors. NMR Biomed. 2010; 23:849–864.
crossref pmid pmc
7. Park HJ, Lee SY, Rho MH, Chung EC, Kim MS, Kwon HJ, et al. Single-shot echo-planar diffusion-weighted MR imaging at 3T and 1.5T for differentiation of benign vertebral fracture edema and tumor infiltration. Korean J Radiol. 2016; 17:590–597.
crossref pmid pmc
8. Turner R, Le Bihan D, Maier J, Vavrek R, Hedges LK, Pekar J. Echo-planar imaging of intravoxel incoherent motion. Radiology. 1990; 177:407–414.
crossref pmid
9. Stehling MK, Turner R, Mansfield P. Echo-planar imaging: magnetic resonance imaging in a fraction of a second. Science. 1991; 254:43–50.
crossref pmid
10. Jeong EK, Kim SE, Guo J, Kholmovski EG, Parker DL. High-resolution DTI with 2D interleaved multislice reduced FOV single-shot diffusion-weighted EPI (2D ss-rFOV-DWEPI). Magn Reson Med. 2005; 54:1575–1579.
crossref pmid
11. Saritas EU, Cunningham CH, Lee JH, Han ET, Nishimura DG. DWI of the spinal cord with reduced FOV single-shot EPI. Magn Reson Med. 2008; 60:468–473.
crossref pmid
12. Riffel P, Michaely HJ, Morelli JN, Pfeuffer J, Attenberger UI, Schoenberg SO, et al. Zoomed EPI-DWI of the head and neck with two-dimensional, spatially-selective radiofrequency excitation pulses. Eur Radiol. 2014; 24:2507–2512.
crossref pmid
13. Lee SK, Tan ET, Govenkar A, Hancu I. Dynamic slice-dependent shim and center frequency update in 3 T breast diffusion weighted imaging. Magn Reson Med. 2014; 71:1813–1818.
crossref pmid
14. Griswold MA, Jakob PM, Heidemann RM, Nittka M, Jellus V, Wang J, et al. Generalized autocalibrating partially parallel acquisitions (GRAPPA). Magn Reson Med. 2002; 47:1202–1210.
crossref pmid
15. Castillo M, Arbelaez A, Smith JK, Fisher LL. Diffusion-weighted MR imaging offers no advantage over routine noncontrast MR imaging in the detection of vertebral metastases. AJNR Am J Neuroradiol. 2000; 21:948–953.
pmid
16. Ortiz Gómez JA. The incidence of vertebral body metastases. Int Orthop. 1995; 19:309–311.
crossref pmid
17. Schwaiger BJ, Gersing AS, Baum T, Krestan CR, Kirschke JS. Distinguishing benign and malignant vertebral fractures using CT and MRI. Semin Musculoskelet Radiol. 2016; 20:345–352.
crossref pmid
18. Rizzoli R, Body JJ, Brandi ML, Cannata-Andia J, Chappard D, El Maghraoui A, et al. Cancer-associated bone disease. Osteoporos Int. 2013; 24:2929–2953.
crossref pmid pmc
19. Roodman GD. Mechanisms of bone metastasis. Discov Med. 2004; 4:144–148.
crossref pmid
20. Smith JK, Lury K, Castillo M. Imaging of spinal and spinal cord tumors. Semin Roentgenol. 2006; 41:274–293.
crossref pmid
21. Jung HS, Jee WH, McCauley TR, Ha KY, Choi KH. Discrimination of metastatic from acute osteoporotic compression spinal fractures with MR imaging. Radiographics. 2003; 23:179–187.
pmid
22. Suh CH, Yun SJ, Jin W, Lee SH, Park SY, Ryu CW. ADC as a useful diagnostic tool for differentiating benign and malignant vertebral bone marrow lesions and compression fractures: a systematic review and metaanalysis. Eur Radiol. 2018; 28:2890–2902.
crossref pmid
23. Biffar A, Baur-Melnyk A, Schmidt GP, Reiser MF, Dietrich O. Quantitative analysis of the diffusion-weighted steady-state free precession signal in vertebral bone marrow lesions. Invest Radiol. 2011; 46:601–609.
crossref pmid
24. Baur A, Stäbler A, Brüning R, Bartl R, Krödel A, Reiser M, et al. Diffusion-weighted MR imaging of bone marrow: differentiation of benign versus pathologic compression fractures. Radiology. 1998; 207:349–356.
crossref pmid
25. Koh DM, Collins DJ. Diffusion-weighted MRI in the body: applications and challenges in oncology. AJR Am J Roentgenol. 2007; 188:1622–1635.
crossref pmid
26. Kwee TC, Takahara T, Ochiai R, Nievelstein RA, Luijten PR. Diffusion-weighted whole-body imaging with background body signal suppression (DWIBS): features and potential applications in oncology. Eur Radiol. 2008; 18:1937–1952.
crossref
27. Herneth AM, Philipp MO, Naude J, Funovics M, Beichel RR, Bammer R, et al. Vertebral metastases: assessment with apparent diffusion coefficient. Radiology. 2002; 225:889–894.
crossref pmid
28. Castillo M. Diffusion-weighted imaging of the spine: is it reliable? AJNR Am J Neuroradiol. 2003; 24:1251–1253.
pmid
29. Tang G, Liu Y, Li W, Yao J, Li B, Li P. Optimization of b value in diffusion-weighted MRI for the differential diagnosis of benign and malignant vertebral fractures. Skeletal Radiol. 2007; 36:1035–1041.
crossref pmid
30. Kugel H, Jung C, Schulte O, Heindel W. Age- and sex-specific differences in the 1H-spectrum of vertebral bone marrow. J Magn Reson Imaging. 2001; 13:263–268.
pmid
31. Kricun ME. Red-yellow marrow conversion: its effect on the location of some solitary bone lesions. Skeletal Radiol. 1985; 14:10–19.
crossref pmid
32. Shellock FG, Morris E, Deutsch AL, Mink JH, Kerr R, Boden SD. Hematopoietic bone marrow hyperplasia: high prevalence on MR images of the knee in asymptomatic marathon runners. AJR Am J Roentgenol. 1992; 158:335–338.
crossref pmid
33. Hoffbrand V, Provan D. ABC of clinical haematology. Macrocytic anaemias. BMJ. 1997; 314:430–433.
crossref pmid pmc
34. Kim HJ, Ryu KN, Choi WS, Choi BK, Choi JM, Yoon Y. Spinal involvement of hematopoietic malignancies and metastasis: differentiation using MR imaging. Clin Imaging. 1999; 23:125–133.
pmid
35. Zhadanov SI, Doshi AH, Pawha PS, Corcuera-Solano I, Tanenbaum LN. Contrast-enhanced dixon fat-water separation imaging of the spine: added value of fat, in-phase and opposed-phase imaging in marrow lesion detection. J Comput Assist Tomogr. 2016; 40:985–990.
pmid
36. Soliman M, Taunk NK, Simons RE, Osborne JR, Kim MM, Szerlip NJ, et al. Anatomic and functional imaging in the diagnosis of spine metastases and response assessment after spine radiosurgery. Neurosurg Focus. 2017; 42:E5.
crossref
37. Terpos E, Dimopoulos MA, Moulopoulos LA. The role of imaging in the treatment of patients with multiple myeloma in 2016. Am Soc Clin Oncol Educ Book. 2016; 35:e407–e417.
crossref
38. Dutoit JC, Verstraete KL. MRI in multiple myeloma: a pictorial review of diagnostic and post-treatment findings. Insights Imaging. 2016; 7:553–569.
crossref
39. Sachpekidis C, Mosebach J, Freitag MT, Wilhelm T, Mai EK, Goldschmidt H, et al. Application of 18F-FDG PET and diffusion weighted imaging (DWI) in multiple myeloma: comparison of functional imaging modalities. Am J Nucl Med Mol Imaging. 2015; 5:479–492.
pmid pmc
40. Balliu E, Vilanova JC, Peláez I, Puig J, Remollo S, Barceló C, et al. Diagnostic value of apparent diffusion coefficients to differentiate benign from malignant vertebral bone marrow lesions. Eur J Radiol. 2009; 69:560–566.
crossref pmid
41. Switlyk MD. Magnetic resonance imaging for assessing treatment response in bone marrow metastases. Acta Radiol. 2019; 06. 01. DOI: 10.1177/0284185119851234. [Epub ahead of print].
crossref
42. Byun WM, Shin SO, Chang Y, Lee SJ, Finsterbusch J, Frahm J. Diffusion-weighted MR imaging of metastatic disease of the spine: assessment of response to therapy. AJNR Am J Neuroradiol. 2002; 23:906–912.
pmid
43. Messiou C, Giles S, Collins DJ, West S, Davies FE, Morgan GJ, et al. Assessing response of myeloma bone disease with diffusion-weighted MRI. Br J Radiol. 2012; 85:e1198–e1203.
crossref
TOOLS
ORCID iDs

Young Cheol Yoon
https://orcid.org/0000-0002-7822-5344

Similar articles