Abstract
Purpose
To describe magnetic resonance imaging (MRI) findings in 10 cases of Toxocara canis myelitis and to analyze these findings to aid in the diagnosis of this condition.
Materials and Methods
From June 2015 to March 2018, we retrospectively analyzed the elec-tronic medical records and MR images of patients who were diagnosed withToxocara canis myelitis. The analysis of the MR images was based on a discussion between an experienced spinal radiologist and a radiology resident.
Results
This study classified MRI findings into the following two types. Type 1 was defined as central and diffuse T2 high signal intensity on the axial plane, which was observed in 50% of all cases. All lesions showed avid enhancement, mostly in the posterolateral or posterior region (4 cases, 80%). Type 2 was defined as wedge-shaped or focal T2 high signal intensity in the posterolateral or posterior region and corresponded to the remaining 50% of the cases. In this case, the extent of the lesion was relatively small and contrast enhancement was observed in only one case.
Index terms
Toxocara Canis, Myelitis, Magnetic Resonance Imaging, SpineREFERENCES
2. Eberhardt O, Bialek R, Nägele T, Dichgans J. Eosinophilic meningomyelitis in toxocariasis: case report and review of the literature. Clin Neurol Neurosurg. 2005; 107:432–438.

3. Jabbour RA, Kanj SS, Sawaya RA, Awar GN, Hourani MH, Atweh SF. Toxocara canis myelitis: clinical features, magnetic resonance imaging (MRI) findings, and treatment outcome in 17 patients. Medicine (Baltimore). 2011; 90:337–343.
4. Lee IH, Kim ST, Oh DK, Kim HJ, Kim KH, Jeon P, et al. MRI findings of spinal visceral larva migrans of Toxocara canis. Eur J Radiol. 2010; 75:236–240.

5. Hiramatsu Y, Yoshimura M, Saigo R, Arata H, Okamoto Y, Matsuura E, et al. Toxocara canis myelitis involving the lumbosacral region: a case report. J Spinal Cord Med. 2017; 40:241–245.

6. Goffette S, Jeanjean AP, Duprez TP, Bigaignon G, Sindic CJ. Eosinophilic pleocytosis and myelitis related to Toxocara canis infection. Eur J Neurol. 2000; 7:703–706.
7. Umehara F, Ookatsu H, Hayashi D, Uchida A, Douchi Y, Kawabata H, et al. MRI studies of spinal visceral larva migrans syndrome. J Neurol Sci. 2006; 249:7–12.

8. Xinou E, Lefkopoulos A, Gelagoti M, Drevelegas A, Diakou A, Milonas I, et al. CT and MR imaging findings in cerebral toxocaral disease. AJNR Am J Neuroradiol. 2003; 24:714–718.
9. Ma G, Holland CV, Wang T, Hofmann A, Fan CK, Maizels RM, et al. Human toxocariasis. Lancet Infect Dis. 2018; 18:e14–e24.

10. Sheerin F, Collison K, Quaghebeur G. Magnetic resonance imaging of acute intramedullary myelopathy: ra-diological differential diagnosis for the on-call radiologist. Clin Radiol. 2009; 64:84–94.

11. Wingerchuk DM, Banwell B, Bennett JL, Cabre P, Carroll W, Chitnis T, et al. International consensus diagnos-tic criteria for neuromyelitis optica spectrum disorders. Neurology. 2015; 85:177–189.

12. Jacob A, Weinshenker BG. An approach to the diagnosis of acute transverse myelitis. Semin Neurol. 2008; 28:105–120.

13. Kumar J, Kimm J. MR in Toxocara canis myelopathy. AJNR Am J Neuroradiol. 1994; 15:1918–1920.
Fig. 1.
Typical MR imaging features (type 1) of Toxocara canis myelitis in a 31-year-old male. A, B. Sagittal T2-weighted image (A) shows diffuse signal change in the spinal cord at the T8–10 level (arrows). The signal change is observed in the central portion of the cord on an axial T2-weighted image (B). C, D. Contrast enhanced T1-weighted sagittal and axial images show nodular enhancement in the posterior region at the T9/10 level (arrows).

Fig. 2.
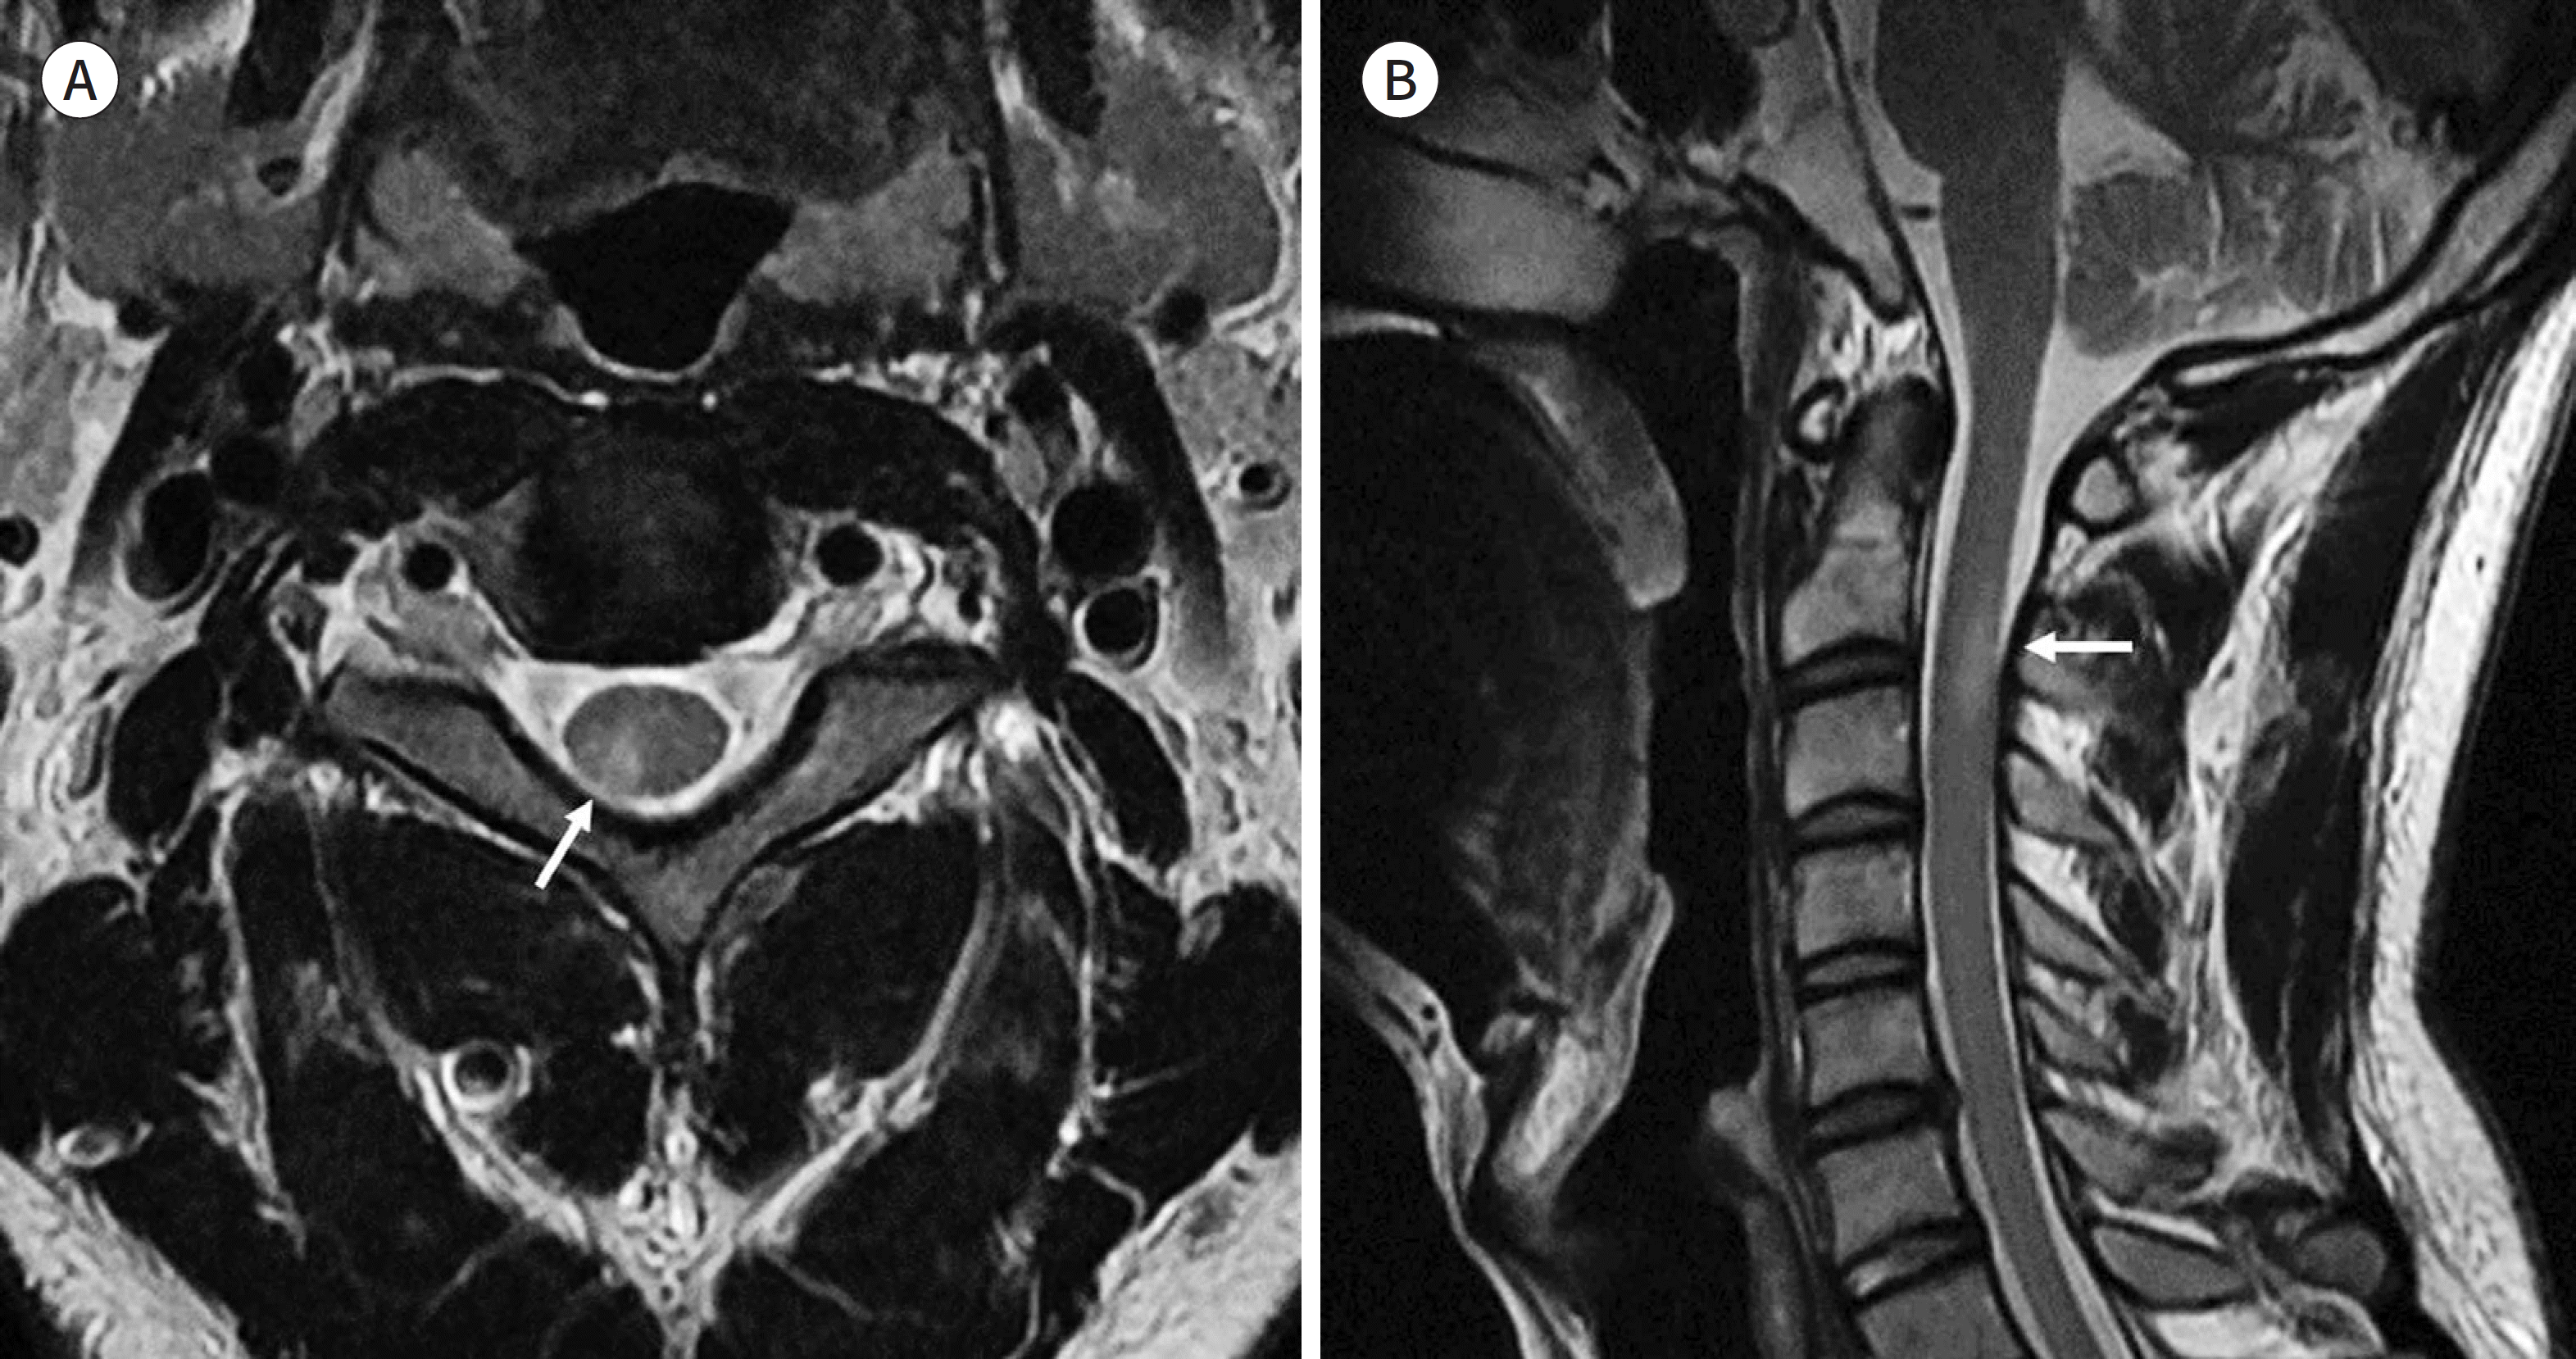
MR imaging features (type 2) of Toxocara canis myelitis in a 29-year-old male. A. Axial T2-weighted image shows a wedge-shaped hyperintense lesion (arrow) in the right posterolateral spinal cord at the C2–3 level. B. Sagittal T2-weighted image shows a short-segment patchy hyperintense lesion (arrow) on the posterior aspect of the spinal cord.

Fig. 3.
Atypical imaging features of Toxocara canis myelitis in a 47-year-old male. terior aspect of the spinal cord with focal patchy signal change and mild swelling at the T4/5 level. B. Axial T2-weighted image shows diffuse centrally located signal change in the spinal cord. C. Contrast enhanced T1-weighted axial image shows rim-like peripheral enhancement. A. Sagittal T2-weighted image shows cord signal change at the T3–4–5 level (arrows). The lesion shows thin pencil-like appearance on the anterior aspect of the spinal cord with focal patchy signal change and mild swelling at the T4/5 level. B. Axial T2-weighted image shows diffuse centrally located signal change in the spinal cord. C. Contrast enhanced T1-weighted axial image shows rim-like peripheral enhancement.

Fig. 4.
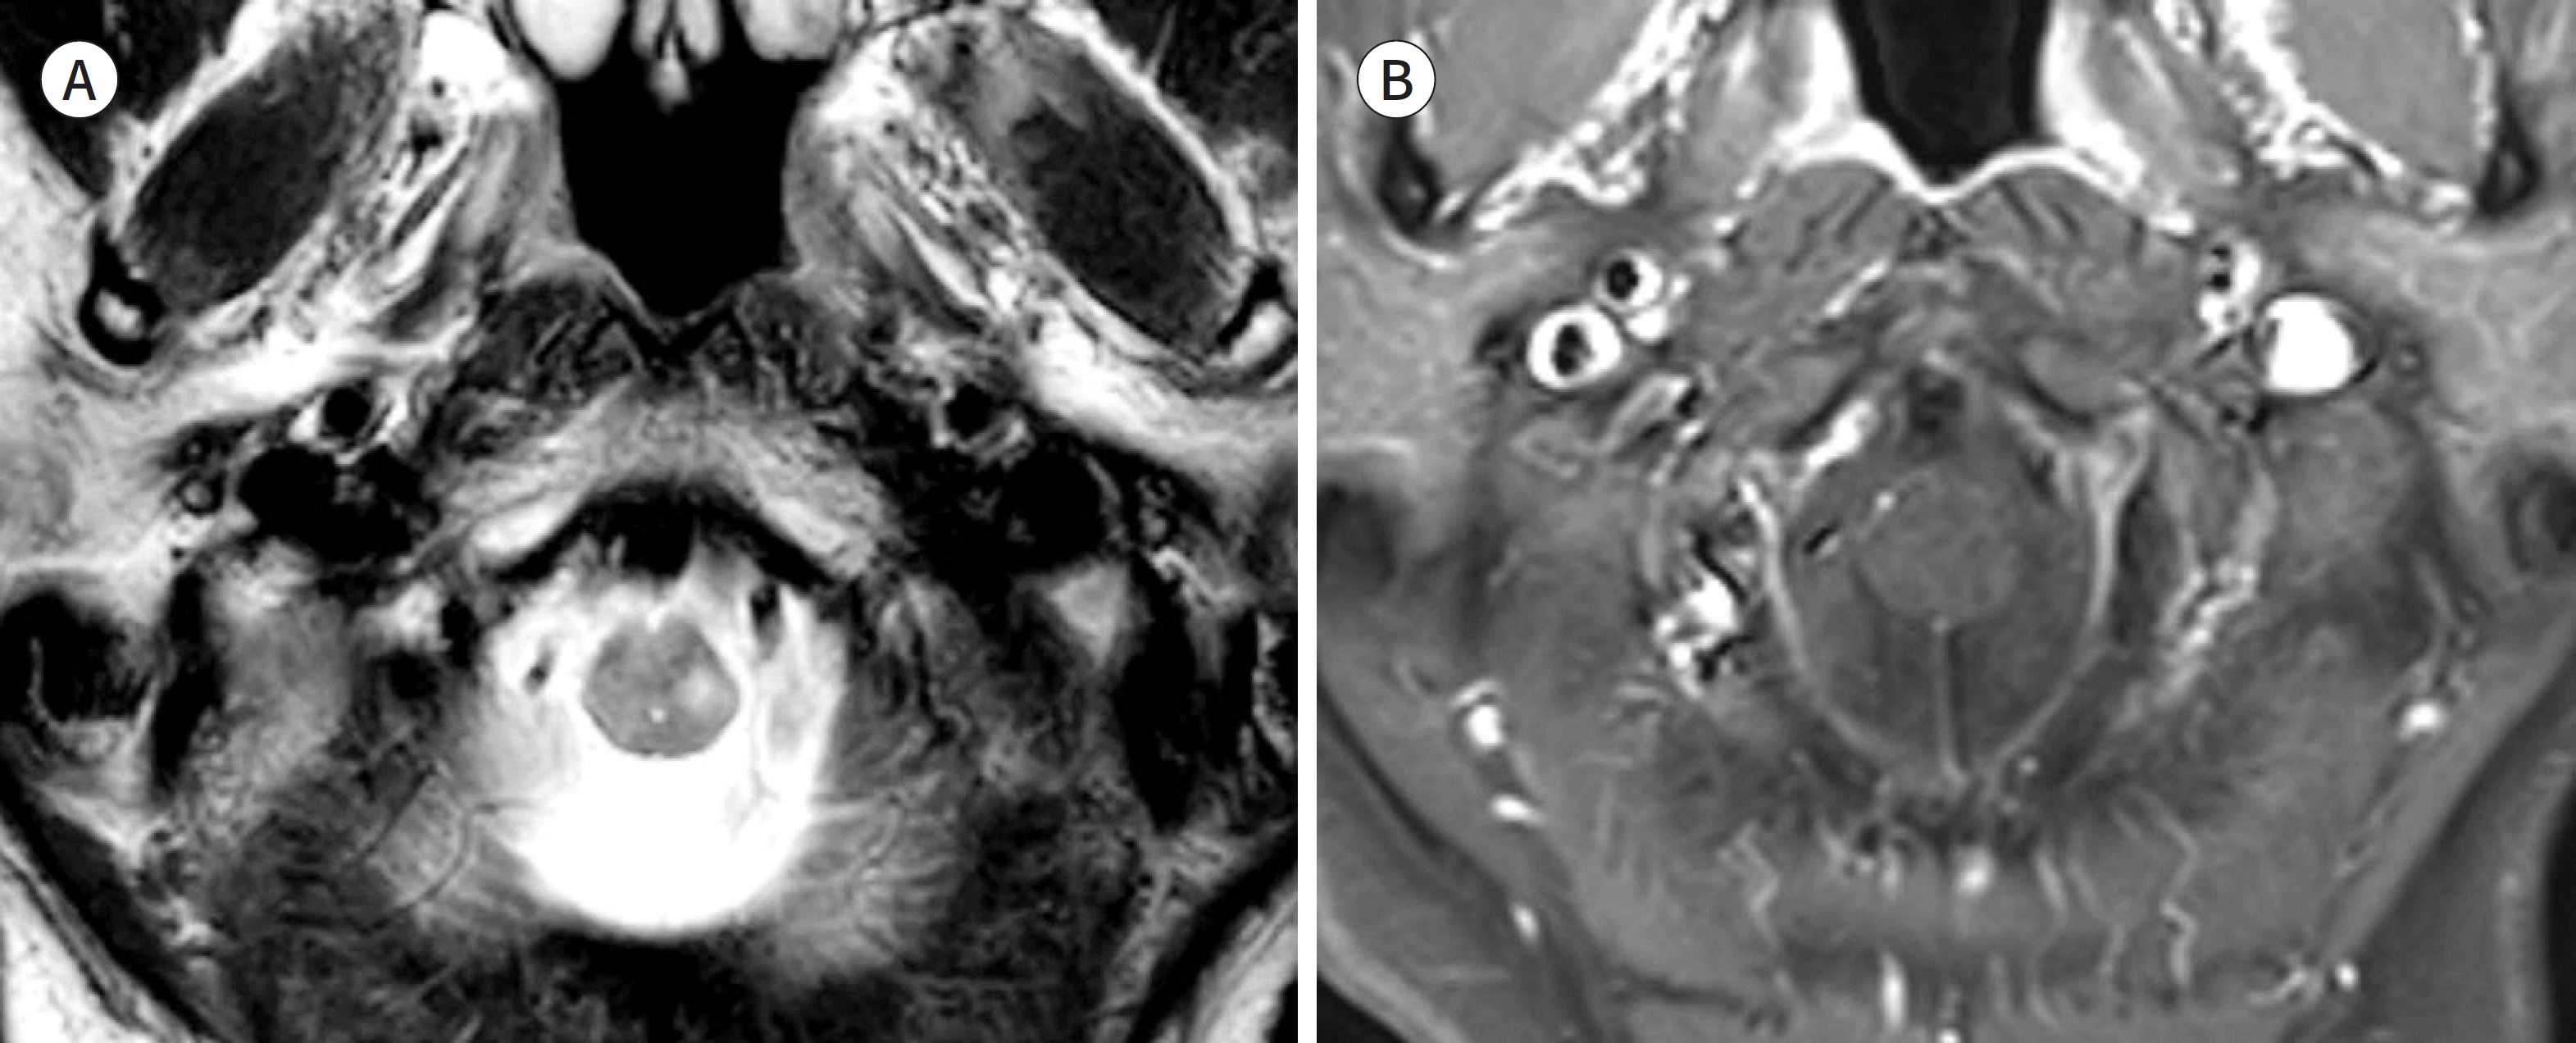
Non-enhancing Toxocara canis myelitis in a 61-year-old female. A. Axial T2-weighted image shows focal hyperintense lesion on the left posterolateral aspect at the cervico-medullary junction. B. Contrast enhanced T1-weighted axial image on brain MRI shows no contrast enhancement.

Table 1.
Demographics and Clinical Findings of 10 Patients withToxocara canis Myelitis
| Patient | Age (years) | Sex | Symptom | Duration | Exposure to Pets | Ingestion Hx | Spine MR F/U Period | Treatment | Disease Course |
|---|---|---|---|---|---|---|---|---|---|
| 1 | 30 | M | Both L/Ex paresthesia, weakness erectile dysfunction | 1 YA | Dogs | Uncooked cow or cattle omasum∗ | 7 mon A | Albendazole, | Partial recovery but improved |
| 2 | 58 | M | Progressing both L/Ex paresthesia | a 1 MA | No | Uncooked cow or cattle liver and meat | A N/A | Albendazole, steroids | Complete recovery |
| 3 | 29 | M | Left U/Ex paresthesia | 1 MA | No | cattle liver and meat N/A | A 12 mon | steroids Albendazole, steroids | Complete recovery |
| 4 | 42 | M | Left L/Ex paresthesia, erectile and urinary dysfunction | 1 YA | No | Uncooked cow or cattle meat | A 6 mon | Albendazole, steroids | Persistent |
| 5 | 65 | M | Both L/Ex paresthesia | 1 YA | N/A | N/A | A 16 mon | Albendazole, steroids | Persistent |
| 6 | 62 | M | Both L/Ex paresthesia, weakness | 2 WA | Cats | N/A | A N/A | Albendazole, steroids | Partial recovery but improved |
| 7 | 61 | F | Headache | 5 MA | Dogs | N/A | N/A S | Steroids | Complete recovery |
| 8 | 55 | M | Both L/Ex paresthesia | 5 YA | Dogs | N/A | A N/A | Albendazole, steroids | Partial recovery but improved |
| 9 | 48 | M | Both L/Ex paresthesia, erectile dysfunction | 3 WA | No | N/A | 3 mon S | Steroids | Partial recovery but improved |
| 10 | 47 | M | erectile dysfunction Progressing both L/Ex paresthesia | 1 MA | N/A | N/A | N/A | Steroids | Partial recovery but improved |
Table 2.
Blood and CSF Characteristics of the 10 Patients
Table 3.
MRI Findings in 10 Patients


 PDF
PDF ePub
ePub Citation
 Print
Print


 XML Download