

 PDF
PDF Citation
 Print
Print


INTRODUCTION
Influenza is an acute respiratory illness that causes a sudden onset of fever, headache, myalgia, cough, and sore throat.12 Influenza viruses have antigenic variations that occur almost every year, causing seasonal influenza outbreaks.2 In the northern hemisphere, which includes Korea, the influenza epidemic is from November to April of the following year.3
Annual vaccination is the principal way to reduce the mortality and morbidity associated with influenza.24 Because a novel influenza virus is prevalent every year due to antigenic drift, the composition of the influenza vaccine must also change every year in order to prevent influenza. According to the World Health Organization (WHO) prediction, the Korea Center for Disease Control and Prevention (KCDC) recommends influenza vaccination every October to December, considering the influenza epidemic and the time of antibody response. The composition of the vaccine for the 2016-2017 northern hemisphere influenza season recommended by the WHO included an A/California/7/2009 (H1N1)pdm09-like virus, an A/Hong Kong/4801/2014 (H3N2)-like virus, and a B/Brisbane/60/2008-like virus.5
In the past, influenza was considered a serious disease only for the elderly or children under 5 years of age because of the high-risk complications.67 Moreover, it is well known that children are the main route of transmission of influenza viruses to household contacts.8 For this reason, KCDC suggests that all children younger than 5 years should be given the influenza vaccine first. However, several recent reports suggested that school-age children may have an impact on influenza epidemics,910 and as a result, children and adolescents aged 6 to 18 years have been included in the influenza vaccine recommendation by the KCDC.3
In the 2016–2017 influenza seasons, the influenza epidemic appeared to exhibit a different pattern than in previous years in Korea. The influenza epidemic onset began a month earlier than the previous year, with a peak in mid-December. The percentage of influenza-like illness patients at the peak of the influenza season was higher than before, but the percentage of patients during the spring was lower than before.
Because of this unusual trend, the incidence of influenza-like patients among school-aged children had increased, causing doubts about the effectiveness of the influenza vaccine. Therefore, this study aimed to evaluate the effectiveness of the influenza vaccine among elementary school students in Korea.
METHODS
The study was conducted in elementary schools in each province of Korea in cooperation with the Student Health Policy Division of the Ministry of Education. Each Provincial Office of Education of Korea, except for Jeju, randomly selected 1 or 2 elementary schools for each District Office of Education. Each elementary school was composed of grades of 1–6 (age 8–13 years), and 1 class was selected for each grade level. Consequently, 2,739 elementary school students were enrolled and data were collected from the subjects' parents through questionnaires, from February 13th to 21st, 2017. Before the survey, all participants were provided a statement that the information they submitted was to be used for public purposes.
The questionnaire was developed from February 1 to 7, 2017, and the following data were collected from the subjects' parents in the survey: sex, age, city of residence, whether they were vaccinated with the influenza vaccine, date of influenza vaccination, component of influenza vaccine, manufacturing method of the influenza vaccine, whether they had the influenza infection since October 2016, date of influenza infection, how influenza was diagnosed, signs and symptoms of influenza, how influenza was treated (oseltamivir, hospitalization), whether they had common cold since October 2016 (not influenza), and signs and symptoms of the common cold. Although no investigation was conducted on the number of influenza vaccinations in this study, most subjects were thought to have received a single dose.
Vaccine effectiveness (VE) was defined by calculating the infection rate of influenza among the vaccinated and unvaccinated groups and determining the percent reduction in the infection rate of the influenza vaccinated group relative to the unvaccinated group. The formula is as follows:

We defined the subjects who answered “yes” to the question “Have you ever had influenza since October 2016?” as an influenza positive (case), and the subjects who answered “no” as an influenza negative (control). Because this study defined influenza positive cases entirely through questionnaires by the subjects' parents, there is a risk that the influenza diagnosis would be underestimated. In this study, there were quite a few participants who caught common cold, not influenza, but had high fever or chills. Therefore, to test the robustness of VE estimates, we calculated an additional VE for influenza positive including those who said they had high fever symptoms, but no influenza.
In addition, we included further analyses using a different definition of vaccination that included the time of influenza vaccination and infection because it takes time for proper immunogenicity to appear after influenza vaccination.111213 We calculated the VEs for each case and redefined those who were vaccinated within 2, 3, and 4 weeks before the influenza outbreak as the “unvaccinated group.”
Statistical analysis
The clinical data of subjects' influenza vaccination and infection were analyzed using descriptive statistics. Categorical variables were reported as frequency counts, while continuous variables were reported as mean and standard deviation (SD). To compare the difference between vaccinated and unvaccinated groups, categorical data were analyzed using the χ2 test, while continuous data were analyzed using the t-test. A 95% confidence interval (CI) was calculated for each relative risk and vaccine effectiveness. All statistical analyses were performed by using SPSS 21.0 for Windows (SPSS Inc., Chicago, IL, USA). P values < 0.05 were considered significant.
RESULTS
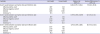
Of the 2,739 enrolled participants during the 2016–2017 seasons, 1,696 (61.9%) were vaccinated and 998 were unvaccinated. Among the vaccinated group, 815 (48%) were male and 881 (52%) were female. The mean age of vaccinated participants was 10.2 years and the SD was 1.634. Among the unvaccinated group, 494 (49.5%) were male and 504 (50.5%) were female. The mean age of unvaccinated participants was 10.7 years and the SD was 1.674 (Table 1).
Table 1
Demographic characteristics of enrolled participants, by influenza vaccination

| Characteristics | Vaccinated (n = 1,696) | Unvaccinated (n = 998) | P value | |
|---|---|---|---|---|
| Sex | 0.769a | |||
| Male | 815 (48) | 494 (49.5) | ||
| Female | 881 (52) | 504 (50.5) | ||
| Age, yr | 10.2 ± 1.634 | 10.7 ± 1.674 | 0.000b | |
The characteristics of the participants' influenza vaccination and infection are summarized in Table 2. Of the 1,696 vaccinated participants, 432 (25.5%) were vaccinated with trivalent vaccines, 932 (55.0%) were vaccinated with quadrivalent vaccines, and 332 (19.5%) were not aware of the number of components. More than half of the enrolled participants did not know how the influenza vaccine was manufactured (1,307/1,696; 77.1%), and only 190 and 199 participants knew that they received egg-based culture and cell-based culture vaccines, respectively.
Table 2
Characteristics of participant's influenza vaccination and influenza infection
From October 2016 to the survey date, 578 (21.1%) participants had been infected with influenza and 2,161 (78.9%) had never been infected. Of the 578 influenza infection group, 518 (89.6%) were diagnosed using the influenza rapid antigen test, 11 (1.9%) were diagnosed using a polymerase chain reaction (PCR) assay, and 44 were diagnosed by a doctor's clinical examination without a laboratory test. For influenza treatment, most of the patients took oseltamivir (530/578; 91.7%) and most were not hospitalized (465/578; 80.4%).
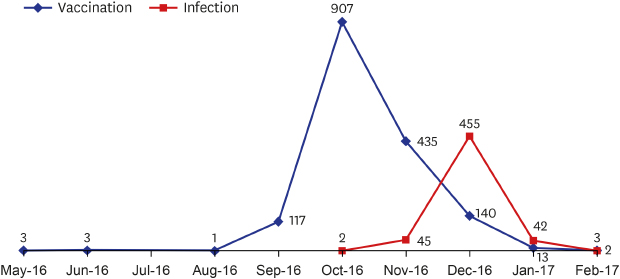
Fig. 1 shows the trend of influenza vaccination and infection by month. According to the KCDC recommendations, most of the participants were vaccinated between October and December of 2016 (1,482/1,696; 87.4%), with most vaccines received in October of 2016 (907/1,696; 53.5%). On the other hand, the outbreak of influenza infection was concentrated in December 2016 (455/578; 78.7%), which is similar to the trend of influenza-like illness patients during the 2016-2017 season reported by the KCDC.
We summarized the signs and symptoms of influenza and common cold (up to 3 times) from October 2016 to the survey date (Table 3). For all 3 episodes, the most common symptoms of the common cold were rhinorrhea (1,164/1,584, 73.5%; 416/530, 78.5%; 106/132, 80.3%), whereas the most common symptoms of influenza were high fever or chills (521/578; 90.1%). The number of participants with high fever or chills in the common cold was 312 during the first episode, 67 during the second episode, and 16 during the third episode. Among them, there were 239 participants who said they did not have influenza since October 2016, and of them, 156 were vaccinated and 81 were unvaccinated. We defined the influenza infection group and measured an additional VE after adjusting for those who indicated they had a common cold with a high fever.
Table 3
Signs and symptoms of influenza and the common cold
The VE estimates are shown in Tables 4 and 5. The VE without any confounders was 3.6% (95% CI, −12.1% to 17%), and the VE after adjusting for common colds with high fever was −1% (95% CI, −13.9% to 10.4%) during the 2016–2017 seasons. Adjusting for the interval between vaccination and infection, the VE was 17.6% (95% CI, 4.6% to 28.9%) at 2 or more weeks after vaccination, 22.5% (95% CI, 10.3% to 33%) at 3 or more weeks after vaccination, and 28.7% (95% CI, 17.5% to 38.3%) at 4 or more weeks after vaccination.
Table 4
Influenza vaccine effectiveness, 2016–2017 seasons, elementary school students in Korea

aanswered “yes” to the question “Have you ever had influenza since October 2016?”; banswered “no” to the question “Have you ever had influenza since October 2016?”; canswered “yes” to the question “Have you ever had influenza since October 2016?” or answered “no” but had common cold with high fever; danswered “no” to the question “Have you ever had influenza since October 2016?” without a cold accompanied by high fever.
Table 5
Influenza vaccine effectiveness, adjusted for the influenza vaccination and infection time in the 2016–2017 season in Korean elementary school students
aanswered “yes” to the question “Have you ever had influenza since October 2016?”; bvaccinated at least 2 weeks prior to the influenza infection; canswered “no” to the question “Have you ever had influenza since October 2016?”; dvaccinated at least 3 weeks prior to the influenza infection; evaccinated at least 4 weeks prior to the influenza infection.
We also analyzed the vaccination rate and vaccine effectiveness according to age (grade). The influenza vaccination rate by age was 70.3% (322/468) for eight year olds, 70.0% (347/491) for nine year olds, 65.7% (332/505) for ten year olds, 60.0% (257/428) for eleven year olds, 54.2% (249/459) for twelve year olds, and 49.3% (189/383) for thirteen year olds: the younger the subjects, the higher the vaccination rate of the subjects. Table 6 shows the effectiveness of influenza vaccine according to the age.
Table 6
Influenza vaccine effectiveness by age, 2016–2017 seasons, elementary school students in Korea

DISCUSSION
This study is an analysis of data collected until February 2017 and is an interim report as it does not reflect the influenza prevalence since then. Overall, without considering any variables, estimates from this study indicated that influenza vaccination reduced influenza-like illness among elementary school students in Korea by 3.6% during the 2016–2017 influenza seasons. Furthermore, adjusting for the time required to develop appropriate immunogenicity to influenza after vaccination, we roughly estimated that influenza-like illness decreased by 17.6%, 22.5%, and 28.7% in children who were vaccinated 2, 3, or 4 weeks prior to influenza infection, respectively. Several studies have shown that it takes approximately 2 to 4 weeks for protective antibodies to appear after influenza vaccination.111213 Therefore, it suggests that some vaccinations failed to prevent influenza because patients were not vaccinated at the proper time.
The vaccine effectiveness analyzed by the age of participants was the highest at 10 years old to 25%, and there was no vaccine effectiveness at 8, 12, and 13 years old. This may be due to a combination of vaccination rate by the age of participants and the maturity of the immune system according to the age of the child,14 and further study is needed to explain these causal relationships.
Our 2016–2017 VE estimates for influenza were lower than that reported from North America and Europe for the same season but were similar to rates reported from China. In the US, VE was 40% (95% CI, 32% to 46%) for all ages, 57% (95% CI, 43% to 68%) in the 6 months to 8-year-old group, and 36% (95% CI, 15% to 52%) in the 9 to 17-year-old group.15 In Canada, the VE was 42% (95% CI, 18% to 59%).16 In Europe, the VE was 38% (95% CI, 21.3% to 51.2%) for all ages, and 44.1% (95% CI, −12.3% to 72.2%) in the zero to fourteen-year-old group.17 In Beijing, China, the VE was 25% (95% CI, 0% to 43%) for all ages, and 29% (95% CI, 0% to 49%) in the three to seventeen-year-old group.18
According to the KCDC, during the 2016–2017 seasons, the type of influenza in Korea was confirmed in 1,210 cases, with 6 cases (0.5%) of type A(H1N1), 882 cases (72.9%) of type A(H3N2), and 322 cases (22.6%) of type B.3 A(H3N2) was the predominant type, and studies in other countries suggested that the vaccine against the A(H3N2) virus tended to be less effective than the vaccine against other types, such as A(H1N1) and B viruses. In the US, the VE against A(H3N2) viruses was 33% (95% CI, 23% to 41%) and 53% (95% CI, 43% to 61%) against overall B viruses during the 2016–2017 seasons.15 In Beijing, China, the VE against A(H1N1)pdm09 viruses was 54% (95% CI, 22% to 73%) and 2% (95% CI, −35% to 29%) against A(H3N2) viruses.18 Through these data, we can suggest several reasons why our study showed low vaccine effectiveness. Although all influenza viruses appear to undergo frequent genetic changes, it is well known that the influenza A(H3N2) viruses have more changes than influenza A(H1N1) and B viruses.19 This antigenic change causes a difference between the components of the influenza vaccine and circulating influenza viruses, meaning that such a difference is more likely to occur in influenza A(H3N2) than in influenza A(H1N1) and B viruses. In another study in Korea, Noh et al.20 reported that circulating A(H3N2) viruses during the 2016–2017 seasons were related to the 3 phylogenetic subclades of 3C.2a, different from the vaccine strain (A/Hong Kong/4801/2014). This mismatch between the influenza vaccine and the circulating viruses would have contributed to the low vaccine effectiveness.
The egg-based production process is one of the pathways to make influenza vaccines. When influenza viruses are cultured by growth in eggs, a change takes place and is referred to as “egg-adapted changes.”21 These changes may reduce the effectiveness of potential influenza vaccines,2223 especially in the A(H3N2) virus when compared to other viruses.2324 To compensate for this shortcoming of egg-based candidate vaccines, cell-based processing methods capable of rapid production have been developed and are commonly used. In our study, most participants were unaware of the vaccine manufacturing process, and further collection of this information could clarify the causal relationship to low vaccine effectiveness.
The major strength of this study is that it is a large-scale study that is representative of the Korean nation, as elementary school students from each region of Korea, with cooperation with the Ministry of Education, were included. However, this study did have some limitations. First, the data were analyzed based on the memory of the subjects' parents. For this reason, the possibility of a recall bias should be considered, and moreover, the diagnosis of influenza may have been underestimated depending on the parents' preference. However, to adjust for this, we included subjects with high fever in the influenza infection group and calculated an additional VE. Second, no data were collected on influenza type, which prevented the assessment of the vaccine effectiveness for each influenza type from being confirmed. Third, because the data collection of this study was conducted from February 13th to February 21st, 2017, it is highly likely that the results did not reflect the analysis of influenza B. Finally, influenza vaccines not only reduce the incidence of influenza but also reduce the symptoms of influenza infection. We could not elaborate on the course of the illness in the influenza infection group, which may be a limitation and a reason for the low vaccine effectiveness demonstrated in our study.
In conclusion, considering the time required for adequate immunogenicity, the influenza vaccine effectiveness was 17.6%–28.7% in Korean elementary school students during the 2016–2017 influenza seasons. This is less effective than that seen previously. Thus, further research and development for a vaccine strain prediction system are necessary for improving outcomes.
 XML Download