

 PDF
PDF Citation
 Print
Print


INTRODUCTION
Clear cell renal cell carcinoma (ccRCC) is the most common malignant tumor of the kidney, representing 80% of all renal cell carcinomas.1 Although the 5-year survival rate of renal cell carcinoma is about 75%,2 the prognosis for advanced ccRCC is devastating, with a 5-year survival rate of 11.2%.3
Various tyrosine kinase inhibitors (TKIs) targeting vascular endothelial growth factor (VEGF) signaling pathways are currently widely used as a first-line treatment of advanced ccRCC, but their effect on survival outcome is not dramatic.4 This occurs via the intrinsic and acquired resistance to TKI treatment by the tumor, which is one of the major obstacles in the management of this disease.5 Therefore, understanding the TKI resistance mechanism and predicting responses to TKI treatment are important to the establishment of an optimal treatment strategy for ccRCC. Several cellular mechanisms conferring TKI resistance in renal cell carcinomas has been proposed,6 but the mechanism has not been fully established yet. Furthermore, the clinical significance of the proposed cellular mechanisms in renal cell carcinoma remains to be elucidated.
Tumor necrosis factor (TNF)-α signaling functions in various physiologic processes such as organ development, immune response, and hematopoiesis, but it also has a role in many pathogenic conditions including tumorigenesis.7 Binding of TNF receptor 1 (TNFR1) in epithelial cells induces activation of the nuclear factor-κB (NF-κB) pathway and a subsequent epithelial-to-mesenchymal transition (EMT).8 Two recent publications have suggested that TNF-α signaling is associated with the development of drug resistance of non-small cell lung and breast cancer cells.910 However, its role in TKI resistance and its clinical utility as a predictive biomarker for TKI response remains to be elucidated in ccRCC.
In the present study, we investigated the implications of TNFR1 expression and TNF-α signaling pathway in acquired and intrinsic TKI resistances of ccRCC. Also, we evaluated the prognostic significance of TNFR1 expression in TKI-treated ccRCC.
METHODS
Patients
To identify an acquired resistance cohort, we retrospectively retrieved cases from which pre- and post-TKI treatment tumor samples were available among 553 ccRCC cases of recurrent or metastatic ccRCC treated with VEGF receptor-TKI at the Asan Medical Center, Seoul, Korea between 1997 and 2013. We further selected cases where the post-treatment tumor samples were obtained within a month of the recognition of clinical signs of tumor progression. Ultimately, 10 patients fulfilled the selection criteria and were used as the acquired resistance cohort.11
A separate group of 101 advanced ccRCC cases that had been treated with TKI at the Asan Medical Center between 2006 and 2011 and whose response to the TKI had been assessed was used as an intrinsic resistance cohort.12 Response to TKI treatment was assessed according to the Revised Response Evaluation Criteria in Solid Tumors guideline version 1.1.13 Complete or partial remission or stable disease lasting 24 weeks or more, following TKI treatment was defined as a clinically favorable response, whereas non-stable disease over 24 weeks or disease progression was defined as a clinically unfavorable response. The TKI responses of all submitted patients were classified by an oncologist at this institution.
Differential gene expression analysis of acquired resistance cohort
Tissue from the acquired resistance cohort was used for gene expression profiling experiments to define differently expressed genes (DEGs) between the matched pairs of pre- and post-treatment tumor samples. Briefly, an area of viable tumor tissue, confirmed by two uropathologists, was macroscopically dissected from a formalin-fixed paraffin-embedded tissue block. After deparaffinization, RNA was extracted using an Ambion Recover All Total Nucleic Acid Isolation kit (Thermo Fisher Scientific, Waltham, MA, USA) according to the manufacturer's protocol. Total RNA expression profiling was performed using an Affymetrix Human Genome® Human Transcriptome Array 2.0 (HTA 2.0) platform (Affymetrix, Santa Clara, CA, USA) with 50 ng of extracted RNA. The probes were annotated using a .chip file for HTA 2.0 provided by the Broad Institute (http://software.broadinstitute.org/gsea/index.jsp) (Broad Institute, Cambridge, MA, USA). After normalization of the raw signals using Transcriptome Analysis Center version 3.0 (Affymetrix), DEGs between the pre- and the post-treatment tumor samples were assessed by an empirical Bayes-moderated paired t-test using the R package limma.14 Gene expression level differences were considered significant when the unadjusted P value was less than 0.05. Gene set enrichment analysis (GSEA) was performed using GSEA java software provided by the Broad Institute (http://software.broadinstitute.org/gsea/index.jsp).15 The GSEAPreranked tool was used for the analysis because the general GSEA method did not support pairwise comparison. The t-statistics output from the DEG analysis was used as an input for GSEAPreranked analysis. A false discovery rate of less than 0.25 was considered significant.
Integrated DEG analysis
In order to overcome the limitation of the small number of cases in our acquired resistance cohort and to identify TKI resistance-associated DEGs across various datasets, we searched for similar experiments on ccRCC in the NCBI Gene Expression Omnibus (GEO) repository (https://www.ncbi.nlm.nih.gov/geo/) and identified an experimental dataset of a xenograft model with continuous exposure to sunitinib. Diaz-Montero et al.16 (GSE76068) generated biologic replicates of patient-derived xenograft (PDX) models and performed gene expression profiling of tumors harvested during pre-TKI treatment, response, and resistance phases. We downloaded the normalized signal intensity file of the experiment from the GEO repository and performed DEG and GSEA analyses between the pre-TKI treatment and TKI-resistant samples in the same manner as for the acquired resistance cohort. DEGs regulated similarly in the acquired resistance cohort and the PDX model were analyzed. Finally, Ingenuity Pathway Analysis (IPA) was performed using the common up- or down-regulated genes to identify the underlying pathways regulating those DEGs associated with acquired TKI resistance.
Immunohistochemistry
Immunohistochemical staining with TNFR1 antibody (ab19139; Abcam, Cambridge, United Kingdom; 1:200 dilution) was performed on a tissue microarray construct from the intrinsic resistance cohort12 using an automated staining system (BenchMark XT; Ventana Medical Systems, Tucson, AZ, USA). The proportions of TNFR1-labeled tumor cells of each case were evaluated by two pathologists. To reduce interobserver discrepancies, the positive tumor cell proportions were estimated in 5% increments. TNFR1 expression was considered high when more than 10% of positive tumor cells exhibited cytoplasmic or membrane staining, where the 10% cutoff was determined using the cutoff finder program.17
Statistical analysis
Rate differences in contingency tables were compared using χ2 test; Fisher's exact test was used as an adjunct when the expected frequencies were low. The significance of the variables affecting the rate differences in the multivariate setting was evaluated by binomial logistic regression analysis. Differences in continuous variables were compared using a Mann-Whitney U test. Survival outcome differences were analyzed using Kaplan-Meier and Cox proportional hazard analyses in univariate and multivariate settings, respectively. The differences between area-under-curve (AUC) values of receiver operating characteristics curves were evaluated using a DeLong test implemented in the R package pROC.18 The statistical analyses were carried out using R version 3.4.3 (R Foundation for Statistical Computing, Vienna, Austria), and differences were considered to be significant if the two-sided P value was less than 0.05.
RESULTS
Clinical characteristics of the acquired resistance cohort
The clinical characteristics of the 10 patients in the acquired resistance cohort was already presented in our previous report (Supplementary Table 1).11 The median age of the patients at the beginning of TKI treatment was 53.5 years (range, 40–66 years). Eight patients were men. Six were at stage IV of the disease at initial presentation, and the remainder received TKI therapy due to post-nephrectomy relapse. Sunitinib was administered to seven patients, and the other three received pazopanib. Initial complete or partial remissions were achieved in eight patients. Despite TKI treatment, diseases had progressed in all patients with a median time of 13.5 months (range, 1–70 months), and despite of second treatment with everolimus or other TKIs, all patients had died of the disease at a median time of 24.5 months (range, 5–96 months) after treatment.
Commonly upregulated genes in both acquired resistance datasets
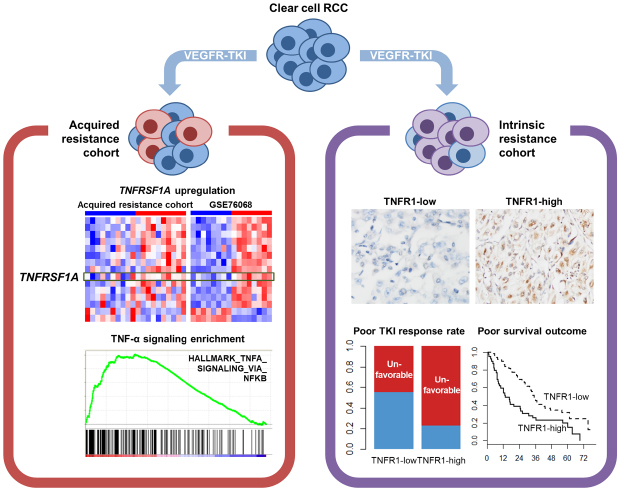
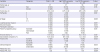
Seven hundred and fifteen upregulated and 260 down-regulated genes were identified between the post-treatment and matched pre-treatment tumor samples of the acquired resistance cohort. Analysis revealed that the upregulated genes were significantly enriched in the categories of cell cycle regulators, oxidative phosphorylation, mammalian target of rapamycin signaling pathway and EMT-associated genes, which we described in a previous report.11 These genes were then directly compared with the DEGs in the public data, which identified 13 up- and 2 down-regulated genes that were common to both experiments (Fig. 1A-C and Table 1).
Fig. 1
DEGs and pathway analyses common to two microarray datasets regarding TKI-resistant renal cell carcinoma. (A) Gene expression heatmaps showing coincidentally regulated genes between two microarray datasets. (B, C) Venn diagrams showing (B) upregulated and (C) downregulated genes between the two microarray datasets. (D) Diagram of the top network from gene set analysis using simultaneously up- and down-regulated genes across the two microarray experiments on acquired TKI-resistant ccRCC. Red color nodes denote upregulated genes in the TKI-resistant ccRCC. (E) GSEA analysis results for the “HALLMARK_TNFA_SIGNALING_VIA_NFKB” gene set showing significant upregulation of tumor necrosis factor-α signaling in TKI-resistant tumor samples across the two microarray datasets. (F) GSEA analysis of three gene sets based on nuclear factor-κB pathway showing significant enrichments for TKI-resistant tumor in two microarray datasets. Dotted lines indicate the significance level (FDR = 0.25).
DEGs = differently expressed genes, TKI = tyrosine kinase inhibitor, ccRCC = clear cell renal cell carcinoma, GSEA = gene set enrichment analysis, FDR = false discovery rate.
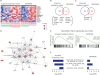
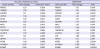
Table 1
Commonly up- and down-regulated genes across two microarray experiments
Network analysis using IPA revealed that the gene networks labeled “dermatological diseases and conditions, inflammatory response and immunological disease” was ranked at the top level. In detail, the gene network displayed complex interactions between TNFRSF1A and CD44 genes and various pathway nodes (VEGF, AKT, p38 mitogen-activated protein kinase, and NF-κB) (Fig. 1D). In both the datasets, GSEA analyses showed significant NF-κB-mediated TNF-α signaling pathway enrichment in the post-TKI treatment samples (Fig. 1E and F). These results suggest that the upregulation of the TNFRSF1A gene and the activation of the TNF-α pathway may participate in the acquired-TKI resistance by ccRCC.
TNFR1 expression in the intrinsic-resistance cohort and its association with the TKI response
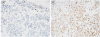
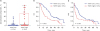
We next wondered whether the TNF-α signaling pathway also plays a role in intrinsic TKI resistance. TNFR1 immunoreactivity and its association with the TKI response were assessed in a separate cohort of 101 ccRCC cases that were treated with TKI, and whose TKI response was available.12 Among the 88 cases in which TNFR1 immunoreactivity status could be evaluated, 39 patients (44.3%) belonged to the high-TNFR1 expression group (Fig. 2).
Fig. 2
Examples of TNFR1 immunohistochemistry results. (A) Low- (magnification, ×400) and (B) high (×100) expression of TNFR1 by tumor cells.
TNFR1 = tumor necrosis factor receptor 1.
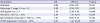
Clinicopathological features of the high- and low-TNFR1 expression groups are summarized in Table 2 and Supplementary Table 2. The high-TNFR1 expression cases displayed a high proportion of sarcomatoid components (P = 0.002) (Fig. 3A) as well as a significantly higher rate of clinically unfavorable TKI response compared with the low-TNFR1 expression group (P = 0.005). High International Society of Urological Pathologist (ISUP) grade, advanced pathological T stage and increased extent of necrosis were more frequent in high-TNFR1 expression group, but these tendencies turned out to be non-significant. The other clinical and pathologic parameters were not significantly different between the two TNFR expression groups.
Table 2
Clinicopathologic features of intrinsic resistance cohort separated by TNFR1 immunoreactivity statuses
Data are presented as mean ± standard deviation or number (%).
TNFR1 = tumor necrosis factor receptor 1, ISUP = International Society of Urological Pathology, OS = overall survival, PFS = progression-free survival, TKI = tyrosine kinase inhibitor.
aResults of Mann-Whitney U test; bResults of Kaplan-Meier survival analysis.
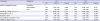
Fig. 3
Distinct clinicopathologic features of TNFR1-high expression group. (A) Box-whisker and overlapping scatterplots showing a significantly increased amount of sarcomatoid component in the TNFR1-high expression group in the intrinsic-resistance cohort (Mann-Whitey U test P = 0.002). (B, C) Kaplan-Meier survival curves according to TNFR1-high and low expression with respect to (B) OS and (C) PFS in the intrinsic-resistance cohort.
TNFR1 = tumor necrosis factor receptor 1, OS = overall survival, PFS = progression-free survival.
The results of multivariate logistic regression analyses of TNFR1 immunoreactivity status with respect to patients' TKI responses are shown in Table 3. We adjusted pathologic T stage, ISUP grade and extents of sarcomatoid and tumor necrosis components, which were significantly correlated with unfavorable TKI response in our previous study.12 Levels of 10% were used as cutoffs for tumor necrosis and sarcomatoid components, respectively, as described in our previous study.19 The high-TNFR1 expression group was significantly correlated with clinically unfavorable TKI responses (odds ratio, 3.51; 95% confidence interval [CI], 1.31–10.06; P = 0.015) even when the pathologic T stage, ISUP grade and extents of necrosis and sarcomatoid components were adjusted. Increased tumor necrosis (≥ 10%) was also independently associated with clinically unfavorable TKI responses.
Table 3
Multivariate logistic regression for clinically unfavorable TKI responsea
We also evaluated whether TNFR1 expression status further improved the TKI response predictability of our previous predictive model.12 The AUC value increased from 0.761 (95% CI, 0.683–0.838) to 0.805 (95% CI, 0.718–0.892) when TNFR1 expression was included in the previous model (data not shown), but this difference was not significant (P = 0.110).
The prognostic impact of TNFR1 expression in the intrinsic-resistance cohort
We also evaluated the prognostic significance of TNFR1 expression in the intrinsic resistance cohort. For the multivariate Cox regression analysis, Motzer's prognostic index20 and the variables used in clinically unfavorable TKI response model were adjusted. The high-TNFR1 expression group exhibited shorter overall survival (OS) and progression-free survival (PFS) compared with the low-TNFR1 expression group after univariate survival analysis (P = 0.003 and P = 0.020, respectively) (Table 2, Fig. 3B and C). Also, multivariate Cox regression analyses showed that the high-TNFR1 expression group was independently correlated with poor OS (hazard ratio [HR], 2.12; 95% CI, 1.25–3.59; P = 0.005) and PFS (HR, 1.67; 95% CI, 1.01–2.77; P = 0.045) compared with the low-TNFR1 expression group (Table 4). Poor Motzer's prognostic group and extent of necrosis (≥ 10%) were also independently associated with OS and PFS. These findings suggest that TNFR1 expression is also associated with intrinsic TKI resistance and could serve as a predictive marker of TKI response and a prognostic indicator in TKI-treated ccRCC patients.
Table 4
Multivariate Cox regression for the overall and progression-free survivals
DISCUSSION
We have shown that TNFR1SF1A gene expression and the TNF-α signaling pathway are significantly upregulated in ccRCC tumor samples that have acquired TKI resistance. Furthermore, the high-TNFR1 expression in the intrinsic-resistance cohort was correlated with sarcomatoid dedifferentiation and was an independent predictive factor for a clinically unfavorable TKI response and shorter OS and PFS. These findings suggest that the TNF-α signaling pathway plays a crucial role in both intrinsic and acquired TKI resistance and that TNFR1 expression may serve as a useful biomarker for predicting the unfavorable TKI responses and survival outcomes in ccRCC patients.
Acquired and intrinsic resistances refer to the different clinical settings in the treatment of neoplastic disease; acquired resistance implies an initial sensitivity and later unresponsiveness of the tumor to the drug treatment, while intrinsic resistance refers to de novo refractoriness to treatment.21 Although most aspects of the cellular mechanisms that initiate these forms of resistance will be distinct,22 there may be some common mechanisms underlying both acquired and intrinsic resistance. We have demonstrated that upregulation of TNFR1 expression can be associated with both acquired and intrinsic TKI resistance, implying that the TNF-α pathway activation may be a common cause of TKI resistance. Further functional studies and larger cohort-based clinical studies will be required to confirm these findings.
The biological and clinical implications of the TNF-α pathway in TKI-treated ccRCC have not yet been widely investigated. Harrison et al.23 described the expression of TNF-α and its receptor in renal cell carcinoma tumor tissue and showed a correlation between higher serum levels of TNF-α and poor patient survival,23 which was validated by another study.24 Mikami et al.25 also showed that increased tumor TNF-α expression was associated with higher histologic grade and tumor stage, and displayed poor prognosis, both in primary and sunitinib-treated metastatic ccRCC patients. In line with these previous studies, we also demonstrated an upregulation of a TNF-α pathway signature using in silico methods in TKI-resistant tumor samples. In addition, and differently from the previous studies, we demonstrated increased expression of TNFRSF1A, the gene for TNFR1, in TKI-resistant tumors. Therefore, increased expression of TNFR1 and subsequent TNF-α pathway activation may also play a crucial role in TKI resistance by ccRCC, a hypothesis that needs to be validated in a large-scale cohort.
A detailed cellular mechanism by which TNF-α pathway induces TKI resistance is yet to be widely investigated. TNF/TNFR1 signaling is known to activate canonical NF-κB signaling,2627 potentially mediating cell proliferation28 and chemotherapeutic resistance.29 Previous studies showed that TNF-α pathway-mediated NF-κB activation is crucial in TKI and chemotherapeutic agent resistance.91030 In accordance with these findings, this study demonstrated a positive correlation between NF-κB-mediated TNF-α pathway and acquired TKI resistance by GSEA. Thus, TNF-α signaling-induced NF-κB activation may play an important role in TKI resistance of ccRCC. Moreover, because TNFR1 and TNFR2 signaling pathways share canonical NF-κB activation,31 TNFR2 pathway may also play a role in TKI resistance in ccRCC,32 which should be confirmed by biological experiments.
Tissue biomarkers to predict TKI response by ccRCC patients are the subject of continuous investigation,33 but there is currently no consensus on this important issue. In our previous reports using the intrinsic resistance cohort, we have suggested a classifier for TKI response that includes tumor necrosis, sarcomatoid component, and immunohistochemical expression of hypoxia-inducible factor-1α.1219 When the TNFR1 expression status was included in this classifier, the predictability of the TKI response increased from 0.761 to 0.805. Although this increase was not statistically significant, we believe that TNFR1 expression status may still have a predictive effect because the previous predictive model was internally optimized for the intrinsic resistance cohort dataset. Therefore, the predictability of TNFR1 expression with respect to TKI response should be validated in a different cohort.
Several sequencing-based research have implicated TP53, NF2, and CDKN2A aberrations in sarcomatoid transformation of ccRCC,3435 but the mechanism underlying sarcomatoid transformation has not been clarified in the majority of cases.36 We showed that high TNFR1 expression is significantly correlated with the extent of the sarcomatoid component of TKI-treated ccRCC tumor tissue, and there are many lines of evidence supporting the role of the TNF-α pathway in cell migration and invasion.37 In renal cell carcinoma, several cell line-based studies have revealed the relationship between the TNF-α signaling and the EMT phenomenon.3839 Because it is believed that sarcomatoid transformation is directly related to EMT,4041 TNFR1 expression and TNF-α signaling pathway activation may serve as one of the mechanisms of sarcomatoid transformation in ccRCC.
A limitation of the present study is its retrospective nature, which increases the possibility of selection bias. Furthermore, the number of cases in our acquired resistance cohort and the public dataset were small, and their characteristics were unequal, i.e., the public dataset used a PDX model, while our acquired resistance cohort used matched-pair patient samples. Also, due to the small number of the cases and suboptimal tissue quality, DEG analyses in the acquired resistance cohort could not be conducted in a conventional manner. In addition, the 10% cutoff of TNFR1 expression defined by the statistical program has been a routinely adopted cutoff in semiquantitative interpretations of immunohistochemical stains,42 the cutoff value should be confirmed by future studies. Despite the limitations, it is notable that TNF-α pathway upregulation was associated with TKI-resistant samples across the separate studies, which is indicative of its strong relationship to TKI resistance. Therefore, these findings should be validated in further functional and/or large-scale cohort studies.
In conclusion, TNFR1/TNFRSF1A expression and TNF-α pathway activation may participate in the generation of resistance to TKI and may be served as a biomarker to predict unfavorable responses to TKI treatment in ccRCC.
 XML Download