

 PDF
PDF ePub
ePub Citation
 Print
Print


INTRODUCTION
Dementia is an increasing social problem that will have an enormous impact on the aging populations worldwide. Alzheimer's disease (AD) accounts for 60–80% of all dementia cases.1 The pathological characteristics of AD include the abnormal accumulation of amyloid plaques, extracellular deposits of amyloid beta-peptides (Aβ), neurofibrillary tangles, and the aggregation of hyperphosphorylated tau protein that induces the apoptosis of neuronal cells.12 These proteins are considered the pathological hallmarks of AD.2
Various therapeutic agents for AD are being developed based on an advanced understanding of the Aβ and tau pathways, and the early diagnosis of AD is critical for better therapeutic outcomes and improved prognoses.13 Remarkable advances have recently been made in diagnostic techniques for AD, including the development of several PET imaging agents. 11C-Pittsburgh compound B (PiB) was the first agent developed for detecting cerebral Aβ accumulation.4 Additionally, the three 18F-labeled compounds Neuraceq (18F-florbetaben, Life Molecular Imaging; Berlin, Germany), Amyvid (18F-florbetapir, Eli Lilly; Indianapolis, IN, USA), and Vizamyl (18F-flutemetamol, GE Healthcare; Arlington Heights, IL, USA) have been approved by the US Food and Drug Administration (FDA).4
We have developed a new 18F-labeled Aβ PET tracer, 2-[2-(N-monomethyl)aminopyridine-6-yl]-6-[(S)-3-[18F] fluoro-2-hydroxypropoxy]benzothiazole (18F-FC119S), which exhibits a high binding affinity (Ki=0.16 nM) for synthetic Aβ1-42 protein aggregates.5 Previous preclinical studies have demonstrated that this tracer has potential in imaging Aβ plaques.56
The safety and feasibility of 18F-FC119S in diagnosing AD were evaluated in a previous phase-0/1 clinical trial.7 That clinical trial included 28 healthy individuals, 10 patients with mild cognitive impairment, and 10 patients with AD, and demonstrated a significant correlation between 18F-FC119S and 11C-PiB uptake in the brain.7 However, the small number of subjects included in that trial made its results inconclusive, and so it is necessary to confirm the efficacy and safety of 18F-FC119S in diagnosing AD in a larger number of subjects.
This current open-label, single-dose, evaluator-blind clinical trial evaluated the diagnostic efficacy of 18F-FC119S for AD (including the sensitivity and specificity) and also its safety.
METHODS
Participants
This study prospectively recruited 105 individuals from June 2015 to February 2016, who comprised 53 AD patients, 16 patients with dementia other than AD (non-AD), and 36 healthy controls (HCs). These 105 individuals were selected and analyzed as a full set. Five individuals (three AD, one non-AD, and one HC) were excluded after performing 18F-FC119S scans due to noncompliance or not conforming with the inclusion or exclusion criteria, and so the acquired imaging data were not analyzed for these subjects. Consequently, 100 individuals were finally selected as the per-protocol set and used to evaluate the efficacy of 18F-FC119S PET.
The selection criteria for patients with AD were as follows: 1) aged 55 years or older, 2) dementia diagnosed based on the criteria of the text revision of the fourth edition of the Diagnostic and Statistical Manual of Mental Disorders (DSM-IV-TR), and 3) probable or definite AD according to the National Institute of Neurological Disorders and Stroke-Alzheimer Disease and Related Disorders (NINCDS-ADRDA) AD criteria. The selection criteria for non-AD patients were as follows: 1) aged 55 years or older, 2) dementia diagnosed based on the criteria of the DSM-IV-TR, and 3) not clinically diagnosed as either probable or definite AD according to NINCDS-ADRDA AD criteria. The criteria for recruiting HC individuals were as follows: 1) aged 55 years or older and 2) a score of 28 or more on the Korean version of the Mini Mental State Examination (K-MMSE).
All neurological examinations and imaging tests were conducted at the Korea Institute of Radiological and Medical Sciences (KIRAMS). In the first visit, the Seoul Neuropsychological Screening Battery cognitive function test was given to the dementia group. This study was approved by the Korea FDA, and the Institutional Review Board of KIRAMS (IRB No. K-1505-001-006). Written informed consent was obtained from all individuals or their close family members. All procedures were performed in accordance with the 1964 Helsinki Declaration and its later amendments or comparable ethical standards.
Study endpoints
The primary endpoint was the diagnostic performance of 18F-FC119S PET/CT visual assessments of AD compared with that of a historical control. 18F-fluorodeoxyglucose (FDG) PET and brain MRI are currently used as auxiliary tools for the differential diagnosis of AD. Therefore, the secondary endpoint included the diagnostic performances of 18F-FDG PET and MRI for AD. The diagnostic performance of 18F-FC119S PET/CT combined with MRI was also included as a secondary endpoint.
PET and MRI
The 18F-FC119S was supplied by KIRAMS, and 18F-FC119S PET/CT, MRI, and 18F-FDG PET/CT were performed on all individuals. The 18F-FC119S PET/CT images were acquired using a Siemens Biograph 6 TruPoint TrueV scanner (Siemens, Munich, Germany). Participants received an IV injection of 18F-FC119S (370±37 MBq, mean±SD), and PET/CT was performed 30 min after the injection for 30 min with an axial field of view of 216 mm and a slice thickness of 3 mm. CT scans were obtained for performing attenuation correction with the following parameters: 130 kVp, 30 mA, 0.6 s/CT rotation, and pitch 6. Images were reconstructed using a conventional iterative algorithm, ordered-subsets expectation-maximization, with four iterations and eight subsets.
MRI was performed within 4 weeks before the day of 18F-FC119S PET/CT imaging and for up to 4 weeks thereafter. MRI images were acquired using volumetric 3-Tesla T1-weighted MRI (MAGNETOM Trio A Tim).
18F-FDG PET/CT was performed within 4 weeks after the date of 18F-FC119S PET/CT, but not on the same day. Participants fasted for at least 2 h before the imaging protocol was performed, and received an intravenous injection of 18F-FDG (185.0±18.5 MBq). PET/CT was performed 30 min after the injection for 30 min using a PET/CT scanner (Biograph 6 TruePoint True V, Siemens). A CT scan was acquired for performing attenuation correction and anatomical localization, with CT images reconstructed into 3-mm-thick slices. PET images from the skull vertex to the skull base were subsequently obtained for 3.5 min in each bed position, and images were reconstructed using a conventional iterative algorithm with four iterations and eight subsets.
Image analysis
Visual assessments
Three nuclear-medicine physicians independently analyzed the PET or MRI images while blinded to clinical information. In case of disagreements between the three physicians, decisions were made by consensus. Each physician had at least 3 years of experience, and received training from an expert nuclear-medicine physician with experience evaluating Aβ PET images as well as from a neuroimaging expert radiologist.
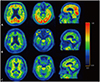
18F-FC119S PET visual assessments were performed according to a previous study.8 A scan was considered positive when the 18F-FC119S uptake was higher in one or more areas of the gray matter compared to the adjacent white matter of the cerebral cortex. Typical positive findings were as follows: 1) difficulty in recognizing the white-matter tracts connecting the frontal lobe with the parietal lobe, 2) difficulty in identifying the white-matter tracts between the occipital and temporal lobes, and 3) increased 18F-FC119S uptake in the gray matter in the parietal lobe (precuneus). A scan was considered negative when the 18F-FC119S uptake was lower in the gray matter than in the white matter in all areas of the cerebral cortex, and when the boundary between the gray and white matter could be distinguished. Typical findings in negative scans were as follows: 1) the white-matter tracts connecting the frontal lobe with the parietal lobe were clearly visible, 2) the white-matter tracts connecting the occipital lobe with the temporal lobe were clearly visible, and 3) finger shapes were visible due to 18F-FC119S uptake in the white matter of the frontal lobe.
The interpretations of 18F-FDG PET scans were also based on a previous study.9 Briefly, a scan was negative when 18F-FDG uptake was normal throughout the cerebellum and cerebrum. Typical findings of negative scans were as follows: 1) the 18F-FDG uptake was highest in the caudate nucleus and putamen, followed by a high uptake in the gray matter and the lowest uptake in the white matter and 2) the 18F-FDG uptake in the gray matter was relatively evenly distributed in each area. A scan was positive when there was any focal or diffuse hypometabolism in the parietal, temporal, and posterior cingulate cortex compared to the normal metabolism in the cerebellum and cerebrum.
MRI interpretations were mainly performed on the T1-weighted axial images, but T1-weighted coronal and sagittal images as well as T2-weighted images were also analyzed. The global cerebral hemispherical atrophy was evaluated based on the following global cortical atrophy (GCA) scale: 0=no cortical atrophy, 1=mild atrophy and opening of sulci, 2=moderate atrophy and volume loss of gyri, and 3=severe end-stage atrophy.10 Based on this scale, GCA grade 0 was evaluated as a negative finding for cerebral hemispheric atrophy, and GCA grades 1–3 were defined as a positive sign of cerebral hemispheric atrophy.
A positive or negative finding in the combined visual assessments of 18F-FC119S PET and MRI data was based on the degree of 18F-FC119S uptake in the cerebral cortical gray and white matter. MRI images were used to differentiate between gray and white matter. A scan was defined as negative when the boundary between the gray and white matter could be observed due to lower 18F-FC119S uptake in the gray matter compared to the white matter. A scan was defined as positive when the 18F-FC119S uptake in the gray matter was similar to or higher than that in the adjacent white matter.
Quantitative PET image analysis
Semiautomated quantitation was performed according to a previous report.8 In order to isolate the gray-matter area of the brain, regions in T1-weighted brain MRI images with high and low signals were automatically segmented using the SPM8 software (Wellcome Trust Centre for Neuroimaging, London, UK). The segmented MRI images and PET images were fused and then spatially normalized. An anatomical template was then applied to measure the standardized uptake value (SUV) of each brain region. PMOD (PMOD Technologies, Zurich, Switzerland) was used for quantitative analysis. The SUV ratios (SUVRs) for each region including the frontal cortex, temporal cortex, parietal cortex, occipital cortex, anterior cingulate, and posterior cingulate were calculated using the cerebellar cortex as a reference region.
Safety
Safety was assessed before and after administering 18F-FC119S. Feedback on adverse reactions and other safety-related issues was gathered through telephone interviews performed within 1 week after drug administration. Adverse events, vital signs, and the results of a physical examination and laboratory tests were all considered in the safety evaluation. Adverse events were identified using version 4.02 of Common Terminology Criteria for Adverse Events. Modified Korean causality assessment criteria that were based on the World Health Organization causality assessment criteria were used for the causality assessment with the following categories: certain, probable/likely, possible, unlikely, definitely not, conditional, and unassessable.
Statistical analysis
Recommendations for the development and labeling of antimicrobials published by The Division of Anti-Infective Drug Products of the FDA recommended a noninferiority margin for noninferiority trials.11 The recommended values were 15% and 20% in clinical trials with efficacy rates of 80–89% and ≤79%, respectively. We calculated the sample size based on the noninferiority trials. In this study, the sensitivity for diagnosing AD of the reference drugs in the previous studies was expected to be 88%, resulting in a 15% noninferiority margin. For a two-sided significance level (α) of 5% and a statistical power (1–β) of 90%, the required number of patients with AD was estimated at 50. The specificity of the reference drugs in the previous studies for diagnosing AD was expected to be 74.5%, resulting in a 20% noninferiority margin. Using the same criteria as for AD patients, the required number of HCs and non-AD patients was also estimated to be 50.
This study enrolled non-AD patients and HCs at a ratio of 3:7, and so 15 non-AD patients and 35 HCs were required. The final number of eligible subjects was 100, comprising 50 AD patients, 15 non-AD patients, and 35 HCs.
Conformity to a normal distribution was evaluated for all continuous variables using the Kolmogorov-Smirnov test. Comparisons of age, weight, height, cognitive function scores, and SUVR between HC subjects and non-AD or AD patients were made using an independent-samples t-test for normally distributed variables (age, weight, height, K-MMSE score, SUVRs of the frontal cortex, temporal cortex, occipital cortex, anterior cingulate, and posterior cingulate, and global SUVR), while the Mann-Whitney U test was used for nonnormally distributed variables [Glasgow Coma Scale (GCS) and SUVR of the parietal cortex].
The diagnostic performance of 18F-FC119S PET was analyzed using a noninferiority comparison based on a historical control group. Noninferiority margins of sensitivity and specificity were set at 15% and 20%, respectively. If the lower limit of the 95% CI was greater than the difference between the sensitivity or specificity of the historical control and the noninferiority margin, noninferiority was considered to be present.
The rates of agreement and discrepancy in the visual assessments were analyzed using Cohen's kappa coefficient and the Fleiss kappa coefficient.
The diagnostic accuracy for AD of each scan was evaluated by comparing the receiver operating characteristic (ROC) curves. Also, the optimal SUVR cutoff values of each region in 18F-FC119S PET were obtained by ROC curve analyses based on Youden's index.
Statistical tests were performed using Medcalc (version 16.8, Medcalc Software, Ostend, Belgium). All p values were two-sided, and differences were considered statistically significant when the p value was below 0.05.
RESULTS
Participant characteristics
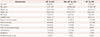
The patient cohort consisted of 105 participants, comprising 40 (38.1%) males and 65 (61.9%) females aged 74.6±6.8 years. Five subjects (one HC, one non-AD patient, and three AD patients) received 18F-FC119S but were excluded from the image analyses due to dropping out of the current clinical trial, and so 100 subjects were included in the image analyses. However, the safety data for the five subjects who dropped out of the clinical trial were confirmed and included in the safety analysis; the details are presented in Table 1.
At the time of the clinical trial, 68 of the participants were taking drugs for the nervous system, and the total number of administered drugs was 226. All AD patients were diagnosed with probable AD, and all non-AD individuals were diagnosed as unlikely AD based on the NINCDS-ADRDA AD criteria. An alert level of consciousness was identified in the neurological examination in all individuals. The GCS revealed the presence of mild brain injuries in all participants. The K-MMSE scores were 13.9±1.1, 18.3±1.2, and 29.0±1.3 for the AD, non-AD, and HC subjects, respectively.
Rate of agreement of 18F-FC119S PET interpretations between observers
Table 2 lists the overall agreement rates of the interpretations of the 18F-FC119S PET results, with or without MRI information independently performed by the three readers. The pairwise agreement between readers without MRI information was 88% or higher, and kappa (κ) ranged between 0.758 and 0.859. The rate of agreement between readers 2 and 3 was very high (κ=0.859, 95% CI=0.76–0.96), and those between readers 1 and 2 and readers 1 and 3 also showed reliable consistency. The overall kappa for the three readers was 0.791 (95% CI=0.77–0.83). The agreement rate of 18F-FC119S PET interpretations with MRI between readers 1 and 3 was 89%, and without MRI it improved slightly to 91%.
Sensitivity and specificity of 18F-FC-119S PET, 18F-FDG PET, and MRI visual assessments
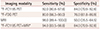
After a consensus between the three readers was achieved, and the clinical data were evaluated, the correlations between the results were determined (Table 3). 18F-FC119S PET had a sensitivity of 92.0% and a specificity of 84.0% for AD detection. Typical positive images in an AD patient and negative images in non-AD and HC individuals are shown in Fig. 1. 18F-FDG PET had a sensitivity of 80.0% and a specificity of 76.0%. MRI had a high sensitivity (90.0%) but a relatively low specificity (50.0%).
The areas under the ROC curves were 0.88, 0.78, and 0.73 for 18F-FC119S PET, 18F-FDG PET, and MRI, respectively, with significant differences between the values for 18F-FC119S PET and 18F-FDG PET (p=0.039) and those for 18F-FC119S PET and MRI (p=0.002), but not those for 18FFDG PET and MRI (p=0.262). The visual assessments of 18F-FC119S PET combined with the MRI demonstrated a slightly improved sensitivity (94.0%) compared with visual assessments using 18F-FC119S PET alone (92.0%).
Quantitative analysis
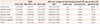
The SUVRs of 18F-FC119S PET for each group are summarized in Table 4. The SUVRs differed significantly between AD and non-AD patients and between AD patients and HCs (both p<0.01), which is similar to previously reported results.8 There were no significant differences in the SUVRs between the HC and non-AD groups.
ROC curve analysis was performed to distinguish AD from non-AD or HC based on quantitative values. The SUVRs for each region could be used to differentiate AD from other groups with high sensitivity and specificity (Table 4).
Safety
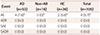
Adverse events occurred in only 6 (5.71%) of the 105 individuals (4 with AD and 2 HC) (Table 5). No adverse drug reactions or serious adverse events were reported, with no statistically significant differences between the AD, non-AD, and HC groups (p=0.85). None of the adverse events were related to underlying symptoms or symptom deterioration. The severity of adverse events was either mild (grade 1) or moderate (grade 2). The adverse events of AD patients included one case each of mild vomiting, mild gait disturbance, mild pyrexia, and moderate back pain, while the HC individuals experienced mild nausea and mild dizziness. There were three cases of adverse reactions that did not require any action, and three cases that were treated with drugs; five of these cases recovered or resolved and the sixth was still recovering or being resolved. The causality assessments indicated that four of the adverse events were unlikely to be related to 18F-FC119S and two were definitely not related to 18F-FC119S, and so it was concluded that no adverse events were related to 18F-FC119S.
DISCUSSION
This study aimed to determine the efficacy and safety of 18F-FC119S, which is a novel radiotracer for the diagnosis of AD. 18F-FC119S PET showed high sensitivity and specificity in AD diagnoses with no instances of serious toxicity. Semiquantitative cortical uptakes of 18F-FC119S revealed a significant difference between AD and non-AD patients, which is consistent with previous results.8 AD patients can reportedly be differentiated from HC subjects by using 18F-labeled amyloid PET tracers.4 Quantitative analyses as well as visual assessments of 18F-FC119S PET scans can help to differentiate AD from non-AD patients.
This study utilized previously reported (and currently used) Aβ PET agents as historical controls to evaluate the diagnostic performance of 18F-FC119S PET. The positive diagnostic rates for several Aβ PET agents for the AD, non-AD, and HC groups are summarized in Supplementary Tables 1, 2, and 3, in the online-only Data Supplement respectively. The rate of Aβ PET positivity for AD was 88.1% (Supplementary Table 1 in the online-only Data Supplement),121314151617 and the rates for the non-AD and HC groups were 22.3% (Supplementary Table 2 in the online-only Data Supplement)131418 and 26.8% (Supplementary Table 3 in the online-only Data Supplement),12131516171920 respectively. In the current study, the positive rate for the group including non-AD and HC individuals was 25.5%, which was due to non-AD and HC participants being recruited at a ratio of 3:7. Based on the positive rates of several Aβ PET agents, the overall sensitivity and specificity of the historical control were 88.1% and 74.5%, respectively.
The diagnostic accuracy of the historical control was similar to the values obtained in the meta-analysis for 18F-labeled amyloid PET tracers in the diagnosis of AD (sensitivity of 90% and specificity of 85%).4 The specificity of the historical control was lower than that found in a previous meta-analysis, which may be due to the inclusion of 11C-PiB data in the present historical group. A meta-analysis found that 11C-PiB had a diagnostic sensitivity and specificity of 96% and 58%, respectively.4 Noninferiority margins for sensitivity and specificity in the current study were set at 15% and 20%, respectively, based on previous results.21
The sensitivity of visual assessments with 18F-FC119S PET for AD was 92.0% (95% CI=80.8–97.8). The lower confidence limit of 80.8% is higher than the difference of 73.1% between the sensitivity of the historical control group (88.1%) and the noninferiority margin (15%). The specificity of 18F-FC119S PET was 84.0% (95% CI=70.9–92.8). This lower confidence limit of 70.9% is higher than the difference of 54.5% between the specificity of the historical control group (74.5%) and the noninferiority margin (20%). These findings suggest that both the sensitivity and specificity for an AD diagnosis using 18F-FC119S are not inferior to those of historical PET agents, including 11C-PiB, 18F-florbetapir, and 18F-florbetaben.
Good consistency was obtained between the readers in differentiating AD from non-AD patients. A previous clinical trial with 18F-flutemetamol found that the kappa coefficient for the agreement between multiple readers was 0.72 (95% CI=0.67–0.76),22 which is similar to the current data. This high level of consistency reflects the ease of image reading and the resulting absence of individual variations. We therefore expect that it would be possible to differentiate AD unequivocally using 18F-FC119S PET in a clinical setting.
Several imaging modalities have been used for diagnosing AD.2324 Aβ imaging involves direct measurements of AD pathology,25 whereas MRI and 18F-FDG PET are tools that evaluate the secondary effects of AD, such as neurodegeneration or neuronal injury.26 A meta-analysis performed to compare the capability of imaging modalities as AD diagnostic tools found that MRI showed a sensitivity of 84% (95% CI=78–88) and a specificity of 70% (95% CI=56–81), while 18F-FDG PET showed a sensitivity of 92% (95% CI=82–97) and a specificity of 78% (95% CI=68–86).23 The current study compared the diagnostic efficacy of 18F-FC119S PET for AD with those of MRI and 18F-FDG PET. We also evaluated whether combining MRI with 18F-FC119S PET provided additional information for diagnosing AD. The diagnostic performance of 18F-FC119S PET was significantly better than that of 18F-FDG PET and MRI. In the interobserver agreement analysis, the kappa coefficient did not differ significantly between with and without MRI. Furthermore, there was no significant difference in the overall diagnostic performance of 18F-FC119S PET between with and without MRI.
Schütz et al.25 reported that simultaneous amyloid PET and MRI is helpful for differentiating MCI due to AD. On the other hand, the current study found that 18F-FC119S PET exhibited sufficient diagnostic performance for AD without combining with MRI. However, the role of MRI in the present study may have been underestimated due to the possibility of selection bias of AD patients, or to the detection of structural changes in the brain using only T1-weighted images. Future studies should assess whether combining various types of MRI sequences with 18F-FC119S PET can enhance the AD diagnostic performance.
There are some limitations to the current study. First, AD was not confirmed in postmortem biopsies, instead relying on clinical criteria only. The gold standard of AD diagnosis is to confirm Aβ deposits in a postmortem brain biopsy, but this is challenging to perform. Although the diagnostic accuracies of using AD clinical criteria have been reported to be lower (at 65–96%) than that of brain biopsy,27 NINCDS-ADRDA AD criteria have been widely used in clinical research as well as in clinics since these criteria were proposed in 1984. Second, a relatively small number of participants was enrolled in the present clinical study. Additional studies with larger numbers of patients and with various levels of AD severity are required. Third, we did not directly compare 18F-FC119S with other Aβ imaging agents approved by the FDA, and so direct comparisons also need to be performed in the future.
In conclusion, we were able to differentiate AD from non-AD patients with high accuracy by using a novel Aβ imaging PET agent, 18F-FC119S. The diagnostic performance of 18F-FC119S PET for AD was higher than that of 18F-FDG PET or MRI, and the administration of 18F-FC119S did not induce any severe adverse events. 18F-FC119S is the first PET agent developed in Korea for the differential diagnosis of AD. Indirect comparisons with existing Aβ PET imaging agents for AD revealed that equivalent or better results were obtained in the differential diagnosis of AD. We therefore suggest that 18F-FC119S PET is a useful auxiliary diagnostic tool for AD with high sensitivity, specificity, and safety.

 XML Download