

 PDF
PDF ePub
ePub Citation
 Print
Print


INTRODUCTION
The current knowledge about the relationship between specific brain lesions and symptoms is based on knowledge accumulated by scholars during the 19th and 20th centuries, including Pierre Paul Broca, Carl Wernicke, and Wilder Penfield. However, increasing clinical experiences have revealed that our knowledge is incomplete. Patients might experience similar symptoms for lesions occurring at different locations or different symptoms for lesions occurring at similar locations. Approximately 100 years ago, Carl Wernicke suggested that, unlike the motor or sensory system, system-level failure of the entire brain would lead to disruption of higher cognitive functions.1 The recently introduced concept of the connectome has enabled the entire brain network structure to be analyzed. A connectome is the sum of all the connections among neurons or regions in the brain.2 However, few studies have examined whether the resulting effects of specific lesions can be visualized in the scope of the whole-brain connectome in individual stroke patients. One related approach is lesion-network mapping,3 which helps to reveal the network-level effects of a lesion that causes specific neurologic symptoms and signs including peduncular hallucinosis and central poststroke pain.4 However, lesion-network mapping is designed to provide a group-level understanding, and there remains a need for clinicians to visualize and understand the effects of lesions on the brain networks of individual patients. Knowledge acquired in this way may help when predicting the prognosis of individual patients and establishing an individually tailored therapeutic strategy, such as personalized rehabilitation. Although several visualization methods including the so-called glass brain have been proposed,5 they are difficult for clinicians to interpret, consequently making them difficult to use in a clinical setting.
This study aimed to visualize the effects of stroke lesions on the functional brain networks of individual patients.
METHODS
This descriptive study of patients with ischemic stroke aimed to characterize the effects of lesions on whole-brain functional connectivity. We enrolled patients with an acute cerebral infarction detected in diffusion-weighted imaging who were admitted to a tertiary referral hospital within 1 week of symptom onset. We excluded patients who were unable to cooperate during resting-state functional magnetic resonance imaging (rs-fMRI). The study was approved by the Hallym University Sacred Heart Hospital Institutional Review Board (Approval No. 2017-I050) and conformed to the Declaration of Helsinki. Written informed consent was obtained from eligible patients or their legally authorized representatives.
Imaging protocol
We screened patients by referring to their initial brain imaging results obtained at the time of admission due to acute stroke. Those who had metallic artifacts or large-territory infarctions that impeded imaging preprocessing were identified and excluded. We obtained multimodal imaging data at 3 months after the onset of symptoms using a 3-T magnetic resonance imaging (MRI) device (Achieva, Philips Healthcare, Best, the Netherlands) and correlated them with the available data on functional outcome. The imaging modalities included rs-fMRI and volumetric T1-weighted MRI imaging. The rs-fMRI parameters were a field of view (FOV) of 224×224 mm2, repetition time (TR) of 3,000 ms, echo time (TE) of 30 ms, a 75×75×45 matrix, voxel size of 3×3×3 mm3, flip angle of 90°, and 180 dynamic scans. The volumetric T1-weighted MRI parameters were an FOV of 240×240 mm2, TR of 8.1 ms, TE of 4.6 ms, a 240×240 matrix, voxel size of 1×1×1 cm3, flip angle of 8°, and 175 dynamic scans. The MRI sessions included localization scanning, sagittal volumetric T1-weighted MRI, and rs-fMRI. We instructed patients to keep their eyes open during rs-fMRI.
Image processing
For image preprocessing, we visually delineated the acute stroke lesions using the diffusion-weighted images obtained at the time of admission. We then superimposed the lesion mask on the volumetric T1-weighted images acquired 3 months after stroke using MRIcron software (Supplementary Fig. 1 in the online-only Data Supplement).6 These lesion masks were used for the subsequent image preprocessing for volume reconstruction.
We processed rs-fMRI data using a pipeline based on SPM12 software package (https://www.fil.ion.ucl.ac.uk/spm/software/spm12). All of the DICOM files were converted into NIfTI format for further processing. The quality of the functional images was assessed by creating implicit masks and saving the mean images. Outliers were identified based on the mean signal intensity, Mahalanobis distances, and the root mean square of successive differences across volumes. Images with signal intensities that exceeded 3 standard deviations from the global mean were considered as outliers. For signal intensity and Mahalanobis distances, images that exceeded 10 mean absolute deviations based on moving averages with a full width at half maximum (FWHM) of 20 image kernels were also identified as outliers. Each time point identified as an outlier by either of these two outlier detection methods was included as a nuisance covariate. Functional images were slice-timing corrected and motion corrected (spatially realigned). Volumetric T1-weighted images were then coregistered to the functional image, and normalized to the Montreal Neurological Institute template (2×2×2 mm3) using a unified segmentation-normalization algorithm with masked lesions.7 These warping parameters were then applied to the functional images, which were subsequently smoothed with the 5-mm FWHM smoothing kernel. We regressed out nuisance covariates including 24 head-motion parameters (the 6 movement parameters of translations in the x, y, and z directions, and roll, pitch, and yaw; their mean-centered squares, their derivatives, and squared derivatives), outlier indicators, linear drift, and principal components of white-matter and ventricle signals (5 principal components for each).89 Spatiotemporal outlier voxels (with intensities more than 5 standard deviations lower or higher than the median) were further winsorized, and a bandpass filter from 0.008 to 0.1 Hz was applied. The codes used for preprocessing can be found at https://github.com/cocoanlab/humanfmri_preproc_bids/.
Connectograms
To construct the rs-fMRI functional connectivity matrices, we first spatially averaged the blood-oxygenation-level-dependent (BOLD) signals across voxels at each time point for each of the 280 brain regions identified using the Brainnetome Atlas,1011 creating 280 (number of regions)-by-(time points) region-of-interest average time-series data. We then calculated Pearson's correlations among the 280 brain regions based on the averaged time-series data, which resulted in 280×280 region-by-region connectivity matrices. We used these connectivity matrices to generate the connectograms using in-house MATLAB code (circos_multilayer.m, available at https://github.com/cocoanlab/cocoanCORE/tree/master/Visualization). Network attributes including clustering coefficients and the degree of centrality were also calculated using the brain connectivity toolbox.12
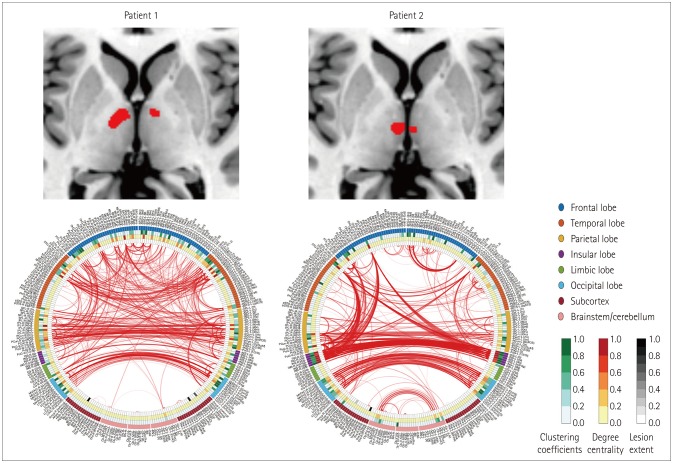
The functional connectivity patterns of representative patients are shown in Fig. 1. The left and right sides of each circle in the figure represent the left and right brain hemispheres, respectively. The name of each parcellated cortical area is displayed outside the circle. Representative network attributes at each point in the circle are shown along with the lesions, and the connectivity of each part is visualized by a line inside the circle. The presence or absence of a line indicates the presence or absence of suprathreshold functional connections, respectively, with its thickness representing the strength of the connection. To reduce noise and find meaningful connections, the global density threshold was set to the highest 1% of values of the network density.
Clinical and imaging variables
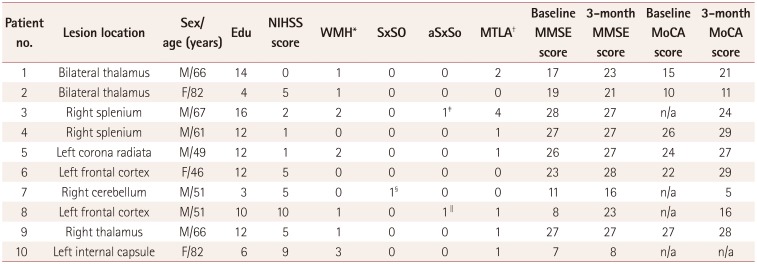
We queried demographic and clinical variables from a pre-determined multicenter hospital-based registry database for acute ischemic stroke.13 Mini Mental State Examination and Montreal Cognitive Assessment scores were queried from the predetermined registry database, which indicated the functional outcome at 3 months after the index stroke.1314 For index-stroke MRI images, white-matter hyperintensities (WMH) were graded using the Fazekas grading system,15 while medial temporal atrophy (MTLA) was assessed using Scheltens visual grading.16 Magnetic resonance angiography was performed to identify any significant steno-occlusive lesions (>50% of the lumen area) in both symptomatic and asymptomatic vessels.
RESULTS
The clinical and neuroimaging characteristics are presented in Table 1. The mean interval between the index stroke and MRI data acquisition was 100.9 days (standard deviation=42.1 days). Two patients with bilateral thalamic infarctions appeared to have similar lesions in the first inspection that exerted different effects on the whole-brain functional network (Fig. 1). In the reconstructed connectograms, interhemispheric and intrahemispheric connectivities were relatively well maintained in patient 1, whose cognitive scores returned to normal after 3 months. However, there was greater impairment in the corresponding interhemispheric and intrahemispheric connectivities in patient 2, whose cognitive test scores had not returned to normal after 3 months.
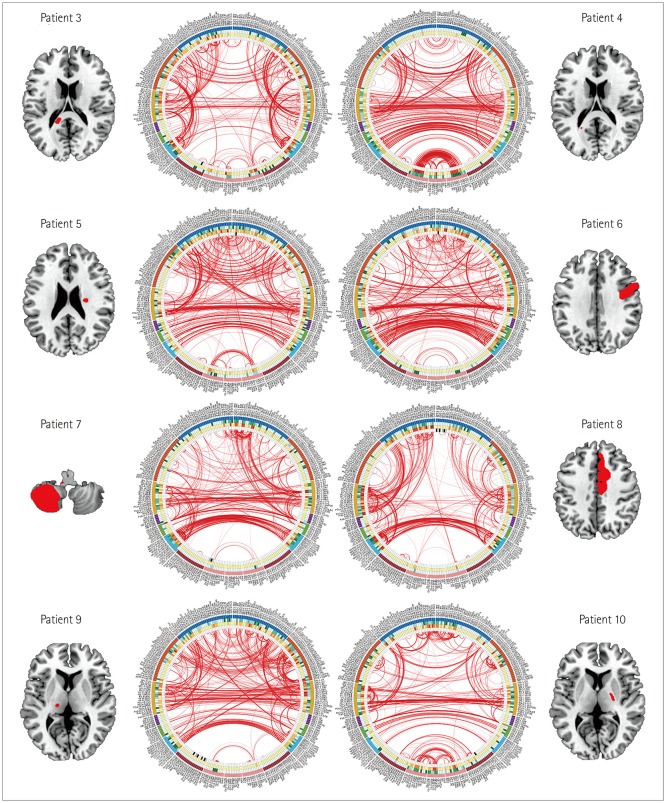
We also compared patients 3 and 4, who had corpus callosum lesions. A lesion in patient 3 in the right corpus callosum selenium was mainly responsible for the impaired interhemispheric connectivity of the parietooccipital region in the connectograms (Fig. 2). In contrast, the lesions in patient 4 were very small, and the interhemispheric connectivity was relatively well maintained in the connectograms, despite patients 3 and 4 having a similar demographic backgrounds including age and education level.
One of two patients in their forties, patient 5, had a small infarction in the left subcortical region, while the other (patient 6) had a cortical infarction in the left frontal area (Fig. 2). Although these patients were in a similar age group and had the same education level, the influence of the cortical lesion on the functional brain network in patient 6 was more severe than that of the subcortical lesion in patient 5, and the network density was sparser in patient 6 than in patient 5 (Fig. 2).
Patients 7 and 8 were in their fifties and had similar stroke severities. Patient 7 had a right cerebellar lesion, but had compromised intrahemispheric connectivity in the frontal lobe (Fig. 2). The pattern was similar in patient 8, who had a frontal cortical infarction.
Comparison of patients 9 and 10 revealed that the network density of the connectograms was significantly reduced in patient 10 even though both patients had lesions of similar sizes in the thalamocapsular regions (Fig. 2). This might be because patient 10 had a lower education level and was older than patient 9.
DISCUSSION
In this study we visualized the impact of stroke lesions on the entire brain functional network in individual patients. We were able to infer the effects of these lesions specifically in each patient by visually inspecting their connectograms, which has yielded new hypotheses on differences in the effects of stroke lesions in different patients.
In both of the patients with bilateral thalamic infarctions (patients 1 and 2), the functional activity of the frontal lobe projection was decreased, which can be attributed to the disruption of the frontothalamic circuit by the lesions, as suggested by a previous study using diffusion-tensor imaging.17 The lesions in patient 1 were located in a more-anterolateral position compared to those in patient 2, and considering the connectivity between the thalamic nuclei and each cortical area in the brain,18 this small difference in lesion location might result in a significant difference in their effects on the functional brain network.
Patients 3 and 4 both had stroke lesions in the splenium of the corpus callosum. In patient 3 the lesion was located on the medial side of the splenium with densely packed white-matter bundle, while the lesion in patient 4 was on the lateral side of the splenium with more-dispersed white-matter tracts. Considering a previous report of tract disruption due to lacunar infarcts in the white-matter pathways,19 differences in the size and location of stroke lesions on the white-matter bundles seem to result in significant differences in their effects on the connected network.
It is important to consider the effects of demographic and chronic pathologic changes including age, education level, WMH, and MTLA. Patient 2 was older and had a lower education level than patient 1, while the chronic changes including WMH and MTLA in patient 3 were more disadvantageous than those in patient 4. Patients 9 and 10 had similar subcortical lesions that did not involve the major cortical hub regions; however, the overall brain connectivity was reduced in patient 10. The differences in age (66 vs. 82 years), education level (12 vs. 6 years), and underlying WMH severity (Fazekas grade 1 vs. grade 3) might have also contributed to the differences in cerebral network connectivity and functional recovery after stroke.202122 The overall effect of hostile environments might have also been reflected in the connectograms. Further research is needed into how these covariates affect the functional brain networks relative to the effects of stroke lesions.
Despite patients 5 and 6 having similar ages and education levels, the intrahemispheric segregation was better maintained in patient 5 while interhemispheric connectivity was better preserved in patient 6. A previous study considered a similar finding to be based on sex,23 with intrahemispheric segregation being more prominent in males and interhemispheric connectivity being more prominent in females. Alternatively, the left frontal cortical lesion in our patient 6 might have interfered in transcallosal functional connections with the contralateral cortical mirror neurons.24 Additionally, the effect of the cortical lesions in patient 6 on the connectivity pattern was more pronounced than that of the subcortical lesions in patient 5.
The loss of frontal functional activity in patient 7, who had a cerebellar infarction, might have been due to the influence of connectional diaschisis,25 which is classically known as a focal decrease in energy metabolism in anatomically intact brain regions distant from lesions.26 However, recent developments in brain imaging have expanded the concept of diaschisis to selective changes in brain regions related to a lesion in a node constituting a large-scale neural network in the brain (connectional diaschisis).25 Furthermore, changes in the entire brain network configuration caused by focal lesions have been included in this developing concept.25 The pattern of frontal disconnection in patient 7 was similar to that in patient 8, who had an anterior cerebral artery territory infarction; the interhemispheric connectivity was better maintained in patient 7. The findings in these two patients suggest that the indirect effects of a remote lesion are as significant as the direct effects.
This proof-of-concept study had several limitations. First, we did not measure the changes over time. Since our study only acquired functional images at a single time point of 3 months after the index stroke, we could not establish a causal relationship between brain connectivity and functional recovery. It is difficult to determine whether the difference in connectivity determines the prognosis or recovery, or whether there seems to be a difference in connectivity because there was a difference in recovery. However, a previous study found that the baseline brain modularity was a good predictor of intervention-related brain plasticity and recovery after cognitive training or aerobic exercise.27
Second, interhemispheric connectivity predicts functional recovery after stroke, but this effect varies according to stroke stage. Contralesional activity might promote functional recovery several days after a stroke, but this interhemispheric connectivity might inhibit the functional activity of the primary motor cortex of the lesioned hemisphere at later stages during the recovery (e.g., after 3–6 months).2829 This suggests that the predictive function of brain connectivity is complex and depends on the time at which the assessment is performed after the stroke. The present study identified functional connectivity at 3 months after strokes, which might represent the recovery potential of the patients. However, further studies are needed to confirm whether the differences in the changes in functional connectivity occurred within the 3 months after stroke occurrence or instead were unique characteristics of the individuals that existed prior to stroke occurrence.
Third, since the patients were all recruited from a single institution over a short period of time, the lesion location and size were not exact matches between the patients being compared. A larger cohort data set is needed to select moresuitable matching groups for comparisons. Lastly, many covariates need to be considered, including age, sex, vascular risk factors, chronic ischemic lesions, and perfusion defects. Accumulating research findings show that differences in connectivity patterns depend on age, sex, and genetic and environmental influences.2330 Future studies should attempt to identify the impact of these individual factors on the connectograms in order to improve their clinical usefulness. We hypothesized that all of these factors combine to influence the current condition of the neural network, and so our results reflected the current functional status of individual patients. Recruiting a sufficient number of patients for each characteristic stroke syndrome will provide a better understanding of the impact of these covariates.
The clinical significance of this study is that its methodology can be applied to visualize the effects of stroke lesions on the intracerebral networks of individual patients. Rather than using complex formulas or illustrations, we wanted to demonstrate the potential of applying connectomics in stroke care by using a simple representation method that can be intuitively understood by clinicians. An understanding of the changes in the brain network caused by focal brain lesions induced by a stroke can be applied as an important surrogate marker for stratifying high-risk groups and linking them to therapeutic interventions. Performing qualitative and quantitative verifications between clinical information and connectome parameters will be essential to applying such parameters in large-scale clinical studies.
 XML Download