

 PDF
PDF ePub
ePub Citation
 Print
Print


Background
The field of pharmacometrics (PMx) started out prior to 1960. Since 1970's pharmacokinetic and pharmacodynamic modeling and simulation has been one of the innovative methods to describe patterns in observational data. Regulatory agencies and pharmaceutical industry abroad were well aware of its needs and impact in drug development starting the 80's. In 1989, the US Food and Drug Administration issued guidelines involving the sparse PK information collection and later issued guidance on population analyses for the industry in 1999 and on pharmacodynamic relationships describing exposure-response in 2003.[1]
It has been a couple of decades since the field of PMx was introduced in Korea. With the growing pharmaceutical industry in Korea, we have recently witnessed the evolution of the PMx environment in the pharmaceutical industry, academia, and regulatory body in Korea.
Stakeholders in the industry sought for more effective tools for drug development and started to notice the benefits of PMx analysis, which can support dose regimen optimization to regulatory submissions.[23] The number of drug candidates in the early stage of development increased with an increased number of smaller biotechnology companies aiming for successful license-out deals targeting US and European markets.[4]
Traditionally, it has been known that academic institutions, approximately less than 5 institutions throughout the country, have been providing pharmacokinetic/pharmacodynamic (PK/PD) analysis to the pharmaceutical companies in Korea. However, a new platform beyond the academic-based level was needed to provide a high level of PK/PD analysis service. Accordingly, the first pharmacometrics service providing company in Korea was launched in 2016.
We noticed shifts in government body as well. The Ministry of Food and Drug Safety (MFDS) accepts and reviews PMx reports for drug approvals. We also have learned that they support the notion that model-informed drug development (MIDD) may provide evidence-based answers to the relevant questions. Thus, the industry became more comfortable utilizing PMx analysis services to support their rationales. MFDS is making a continuous effort to increase its expertise in PMx with continuing educations.
Go to : 
The launch of the first PMx company
Along with the evolving PMx environment in Korea, the first PMx service company, Q-fitter, was launched in Oct 2016 from the preceding academic-based research institution, Pharmacometrics institution for Practical Education & Training (PIPET). After the transition to an industry level project-based service, we have experienced a dramatic increase in the interest in the use of PMx in drug development given by the increasing number of projects from the pharmaceutical companies and expanding scope of services. In this article, we will review three years of PMx analysis experiences of Q-fitter.
Go to :
Objectives & Methods
We will evaluate the characteristics of the PMx consultancy projects over time, identify the current trends of PMx consultancy service in Korea, and assess the impact of the application of modeling and simulation techniques in drug development in Korea and lastly identify an area of development to trail future demands.
We compiled and summarized pharmacometrics projects from October 2016 to October 2019. Information about the projects was gathered, including the number of projects, companies, company types, indications, therapeutic areas, drug development stages, purposes of modeling and simulation, and scope of services. Then within each category (purposes, stages, therapeutic areas, and company types), we assessed the subcategories and a year-over-year trend.
Go to :
PMx service experiences
A total of 47 projects contracted with 27 different companies were assessed in this review. Over the three years, the number of projects increased by 170% per year on average. The PMx service projects included PK/PD analysis, mainly using population PK/PD modeling and simulation (~72%), non-compartmental analysis (NCA) (~21%). The others were an interpretation of modeling data (~4%) and drug-drug interaction (DDI) prediction (~2%). Selected projects of PMx analysis are presented in Table 1.
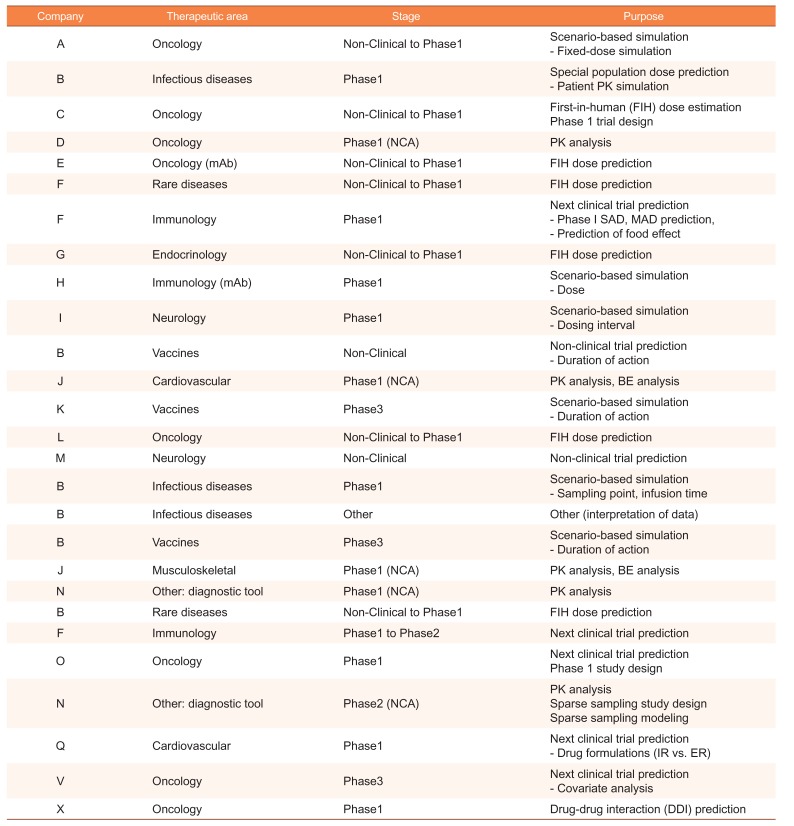
Table 1
Summary of PMx service experiences (selected)
![]()
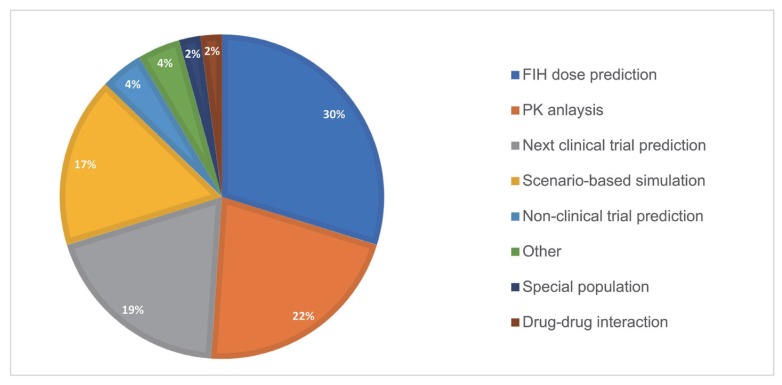
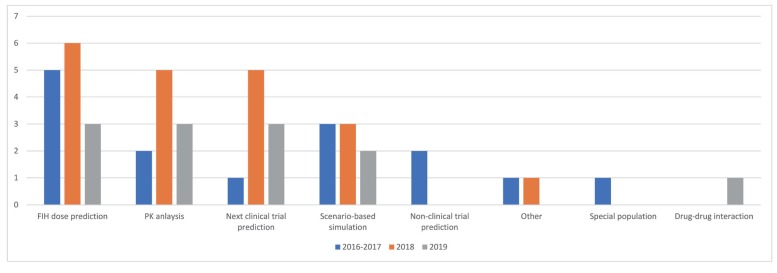
Purposes
The most sought-after purpose in PMx projects was first-in-human dose prediction (~30%) using PK/PD modeling and simulation from in vitro, and in vivo data. The second was NCA (~22%) followed by the next clinical trial prediction (~19%), which includes phase 1 Multiple Ascending Dose (MAD) prediction from Single Ascending Dose (SAD) study, phase 2 PK prediction from phase I PK study, PK/PD prediction in Extended-Release (ER) formulations based on limited Immediate-Release (IR) and ER PK data. Scenario-based simulation (17%) seek answers to specific questions, including prediction of PK or PD with dosing interval, infusion time, or sampling point change. The ultimate goal of the use of PMx analysis was to support regulatory submission (~51%), internal decision-making process, and/or out-licensing deals. Figure 1 shows the proportion of 8 different purposes in overall PMx projects. A year-over-year trend of purposes is outlined in Figure 2.
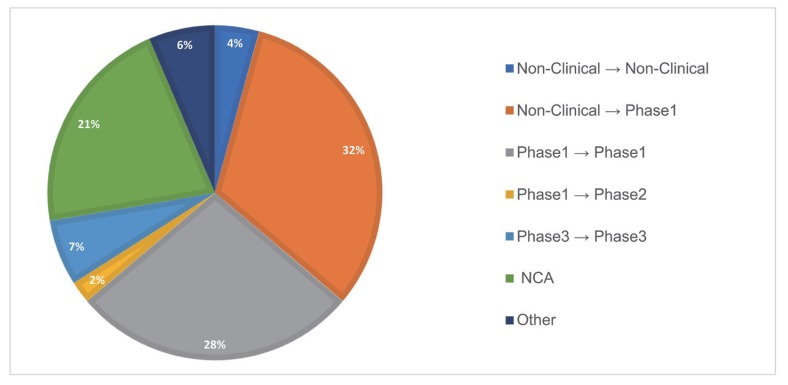
Drug development stages
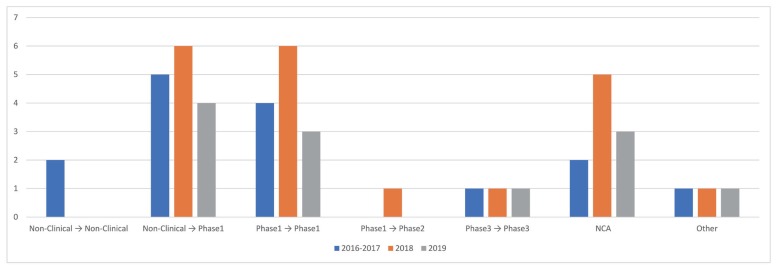
Following the previous results in which FIH dose prediction was the most sought-after purpose, the transition from non-clinical to clinical was the most frequent stage of development (~32%) involved with PMx service projects. The next was phase 1 to phase 1 prediction (~28%), including next dose prediction within SAD study, MAD prediction from SAD study, and different population PK prediction within phase 1 study, followed by NCA, which was separately grouped but mainly involved phase 1 data. Others were non-clinical PK prediction from non-clinical data, phase 1 to phase 2 prediction, and PK prediction within phase 3 studies, which predicted a racial difference in PK. Figure 3 shows the proportion of 7 different subcategories of drug development stages of PMx service projects. A year-over-year trend of drug development stages is outlined in Figure 4.
Therapeutic areas
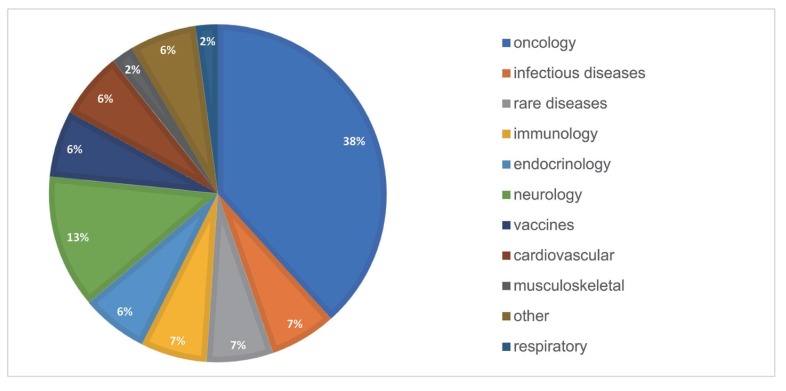
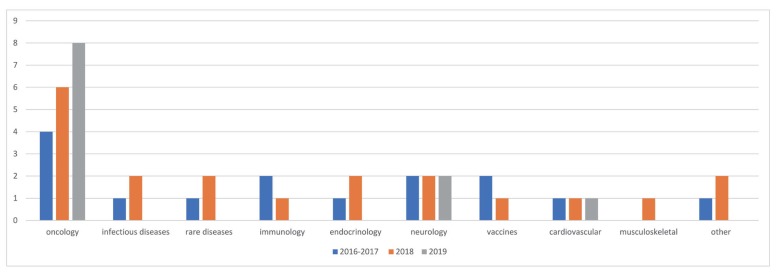
Oncology has been the top therapeutic area of interest in PMx service projects consisting of ~38% of the total projects. Among the oncologic agents, ~28% were monoclonal Antibodies (mAb). Neurology (~13%) was the second in rank, including indications such as Alzheimer's disease and Parkinson's disease. Other therapeutic areas were immunology (with an indication of rheumatoid arthritis), endocrinology (with an indication of Type 2 diabetes mellitus), cardiovascular (with an indication of dyslipidemia), rare disease (with an indication of Hunter syndrome, hemophilia), and more. Figure 5 shows the proportion of 11 different subcategories of therapeutic areas in overall PMx projects. A year-over-year trend of the therapeutic areas is outlined in Figure 6.
Types of companies
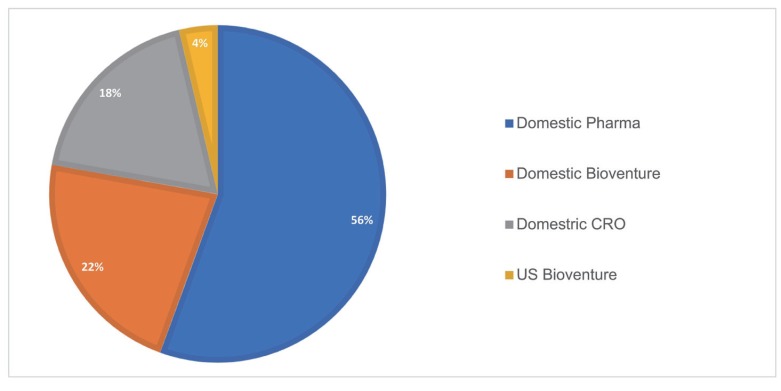
A total of 27 companies collaborated with Q-fitter for PMx related services. The most frequent types of companies were domestic pharmaceutical companies (~56%), followed by smaller domestic biotechnology/bio venture companies (~22%), domestic CROs (~19%), and US bio venture (~4%). The US bio venture collaborated with rooted from the pharmaceutical company in Korea. Thus, PMx service was mainly provided to the domestic pharmaceutical industry. Figure 7 shows the proportion of 4 different company types in overall PMx projects.
Go to :
Conclusion & Future perspectives
We have reviewed three years of experience in providing PMx service for the pharmaceutical industry in Korea from 2016 to 2019. The primary purpose of PMx analysis was FIH dose selection, which involved a transition from the non-clinical to the clinical study. More than half of the total analysis results were used for regulatory submissions. Oncologic agents were the most popular therapeutic area which utilized the MIDD. Large domestic pharmaceutical companies and smaller bio ventures were the main outsourcing agents seeking PK/PD analysis.
We continue to observe an increase in demand of PMx analysis service and PMx related educations. Some of the trends in domestic PMx service include an increase in mAb PK/PD modeling and simulation and the use of physiologically-based pharmacokinetic approaches for the DDI and the human PK parameter predictions in conjunction with compartmental modeling. Also, we have noticed a high retention rate of the companies once they learned the benefits of the PMx analysis solutions (>40% of the companies brought subsequent projects). Thereafter, a broader scope of services is requested by the companies, which entails strategic drug development planning starting from in vitro/in vivo stage and further prediction of PK/PD after the acquisition of an actual clinical data, which was initially predicted by the model. Therefore, data generation/learn/confirm/predict at each drug development stage became possible, creating a complete loop in a “learn-and-confirm” paradigm to deliver high-value PMx analysis results.[3] For the next review, as many investigational products handled are completing their phase 1 studies, we are planning to compare the model-based predictions versus observations to evaluate the success rate of MIDD. We are highly optimistic that the MIDD is now becoming one of the critical components of drug development in the pharmaceutical industry in Korea. To contribute to the field of PMx in Korea, we will continue to strive for excellence in PMx analysis, continue to provide educations to the researchers, and share the success stories
Go to :
 XML Download