This article has been
cited by other articles in ScienceCentral.
Abstract
The accuracy and predictability of mixture models in NONMEM® may change depending on the relative size of inter-individual differences and the size of the differences in the parameters between subpopulations. This study explored the accuracy of mixture models when dealing with missing a categorical covariate under various situations that may occur in reality. We generated simulation data under various scenarios where genotypes representing extensive metabolizers (EM) and poor metabolizers (PM) of drug-metabolizing enzymes affect the clearance of a drug by different degrees, and the inter-individual variations in clearance are different for each scenario. From each simulated datum, a specific proportion of the covariate (genotype information) was randomly removed. Based on these simulation data, the proportion of each individual subpopulation and the clearance were estimated using a mixture model. Overall, the clearance estimate was more accurate when the difference in clearance between subpopulations was large, and the inter-individual variations were small. In some scenarios that showed higher ETA or epsilon shrinkage, the clearance estimates were significantly biased. The mixture model made better predictions for individuals in the EM subpopulation than for individuals in the PM subpopulation. However, the estimated values were not significantly affected by the tested ratio, if the sample size was secured to some extent. The current simulation study suggests that when the coefficient of variation of inter-individual variations of clearance exceeds 40%, the mixture model should be used carefully, and it should be taken into account that shrinkage can bias the results.
Keywords: NONMEM, Missing categorical, Covariate, Mixture model
Introduction
Pharmacometrics refers to an integrative science that uses mathematical models to quantify interactions and effects among data in biology, physiology, and pharmacology. Pharmacometrics currently plays an important role in the efficient and safe use of drugs already on the market and in new drug development. In some cases, PK/PD parameters (absorption, clearance, etc.) can differ by nearly 20 times in different subpopulations,[
1] which may have a significant effect on the effectiveness of drugs.
Dealing with individual differences is the main concern in the field of pharmacometrics. In NONMEM® (ICON Development Solutions, Ellicott City, MD, USA), the most widely used software in pharmacometrics, a log-normal distribution is typically assumed for unexplained inter-individual differences with a variance of ω2, and individual-specific parameters (Pi) are expressed using individual-specific values (ηi) randomly selected from the distribution as follows:
Where Pi, PTV, and ηi respectively indicate individual parameter estimates, the typical value of the parameter, and a specific value (realized ETA) for an individual that is randomly selected from a normally distributed variable with a mean of zero and a variance of ω2.
When describing inter-individual variability in this manner, we need to assume that individual PK/PD parameters follow the symmetric and unimodal distribution. However, there are a variety of covariates (age, body weight, genetic characteristics, concomitant medications, etc.) that affect PK/PD parameters; therefore, PK/PD parameters may be divided into completely different subpopulations, each of which follows its own unimodal distribution and multimodal distribution, overall. To reflect these characteristics, we separated the entire group into subpopulations according to certain covariates and implemented them with different typical parameter values during the modeling analysis. However, in order to estimate the typical value separately by subpopulations, it was first necessary to determine which variables affect specific PK/PD parameters, which can be difficult. In addition, in real-world data, some data are collected insufficiently, making it difficult to identify that each person belongs to which subpopulation.
Accordingly, various methods are employed to handle missing categorical covariates. If the missing value is complete at RANDOM (MCAR), all data may be erased (casewise deletion), or data may be removed only in certain situations (pairwise deletion). In some situations, it is also used to replace all missing categorical covariates with a single value. However, each method has clear weaknesses. A mixture model in NONMEM® (using the $MIXTURE subroutine) can be used to handle the missing categorical covariate, which replaces the missing values with ones that have the highest probability for each individual.
Although the mixture model is a common method used for estimating individual subpopulations in a multimodal distribution in NONMEM®, the accuracy and predictability of the mixture model are not well-known. In fact, the accuracy and predictability of the mixture model may change depending on the size of the inter-individual differences and the size difference of a parameter between subpopulations.
This study evaluated the accuracy and predictability of a mixture model in dealing with missing categorical covariates under various situations that can happen in reality.
Methods
For this study, we generated Monte-Carlo simulation PK data under various scenarios (1000 replicates each) based on the PK model from literature in which the multimodal distribution had been previously reported.[
2] This PK model consists of first absorption, one component model, and clearance (CL) were different between subjects with genotypes representing extensive metabolizers (EM) and poor metabolizers (PM).[
2] EM and PM subpopulations were assumed to be 3:1.
The total number of people in datasets was Forty-eight (48), and blood for the PK analysis was set at 0 (predose), 1, 2, 3, 4, 6, 8, 12, 24, 48, 72, and 96 h after drug administration. The EM/PM ratio of CL (10%–80%) or inter-individual variations of the CL (5%–100% in coefficient of variation (CV)) were changed in various Monte-Carlo simulation scenarios (CV(%) =
√exp(ω2)−1
× 100). From each simulated datum, a specific proportion (5%, 10%, 15%, 20%, or 25%) of the covariate (genotype information) was removed at random times. Based on these simulated data, the proportion of the individual subpopulation and the clearance was estimated using the mixture model implemented in NONMEM® as follows:
EST = MIXEST
IF (OGEN.EQ.0) EOGEN = 0
IF (OGEN.EQ.1) EOGEN = 1
IF (OGEN.GE.999.AND.MIXNUM.EQ.1) EOGEN = 0
$MIX
NSPOP=2
P(1) = 0.75
P(2) = 0.25
EOGEN indicates the subpopulation of the genotype group (EM, PM) and MIXEST indicates the use of the mixture model. We define the proportion of subjects between subpopulation 1 (P(1)) and subpopulation 2 (P(2)) using $MIX and NSPOP = 2.
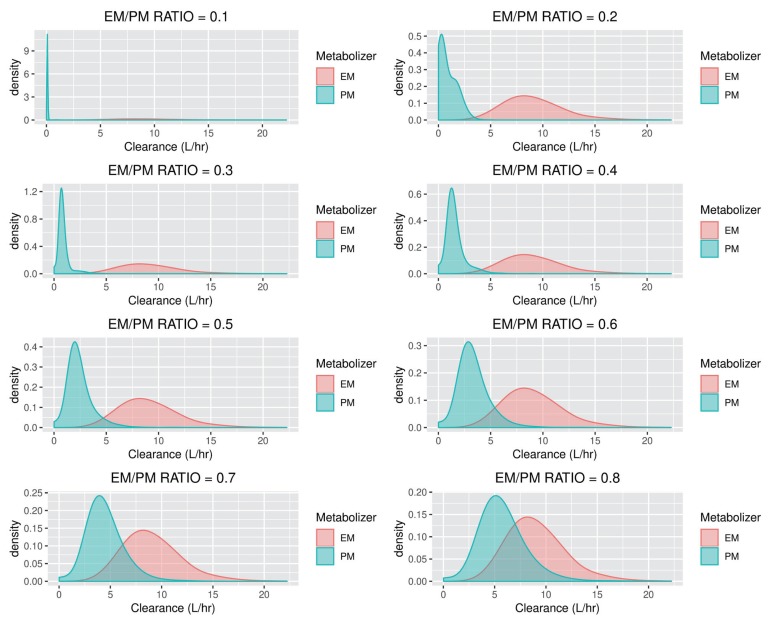
PK analysis was conducted using nonlinear mixed effect modeling with NONMEM® version 7.4 (subroutines ADVAN2, firstorder conditional estimation (FOCE) with INTERACTION method), and the data were plotted using R version 3.5.3. CL probability density plots for each EM/PM ratio of CL (30% CV) are presented in
Figure 1.
Figure 1
CL probability density plots for each EM/PM ratio of CL (30% CV).

After estimating parameters using each dataset, we assessed the predictability of the mixture model by evaluating how accurately NONMEM® estimates the genotypes (EM, PM) of the missing data. The accuracy was evaluated by the similarity between the clearance estimates (EM, PM) and the actual ones. The accuracy and predictability for each simulated datum from various scenarios are presented in tables.
Results
In the dataset under various situations, the successful minimization rate was generally over 90%, which was thought to be sufficiently high. Estimated values in each dataset are presented in
Tables 1,
2,
3,
4,
5. Estimated values from a proportion of the missing covariate are presented in
Table 6. Estimated values that failed in the minimization process were excluded. 3-dimensional plots showing changes in inter-individual variations of CL and the EM/PM CL ratio for each subpopulation are presented in
Figures 2,
3,
4. CL estimates that exclude high ETA or epsilon shrinkage (30% or more) are presented in
Supplement 1.
Figure 2
3-dimensional plot of the predictability of EM versus interindividual variabilities for CL and the clearance ratio (EM/PM) in the EM subpopulation.
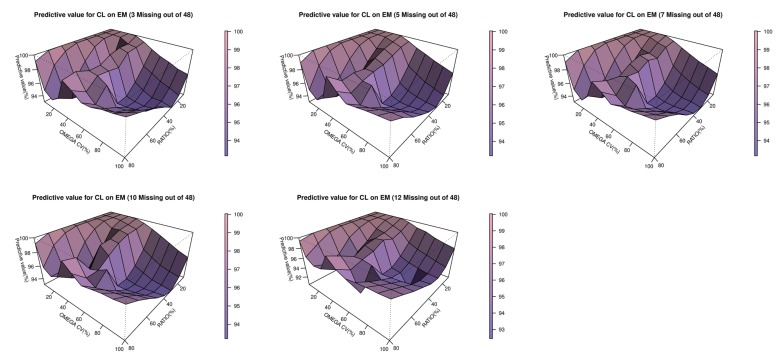
Figure 3
3-dimensional plot of the predictability versus interindividual variabilities for CL and the clearance ratio (EM/PM) in both the PM subpopulations.
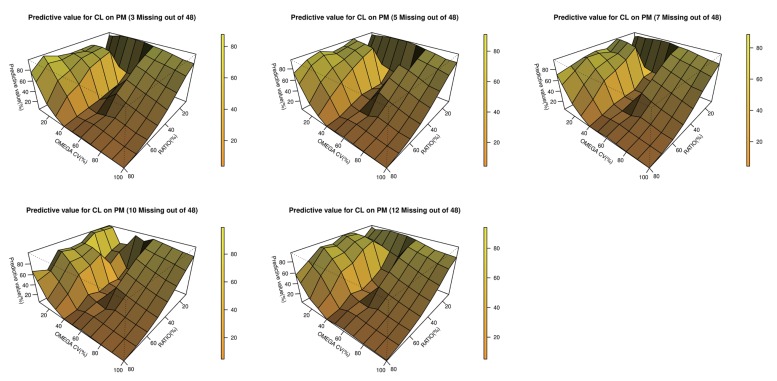
Figure 4
3-dimensional plot of the predictability versus interindividual variabilities for CL and the clearance ratio (EM/PM) in both the PM and EM
subpopulation.
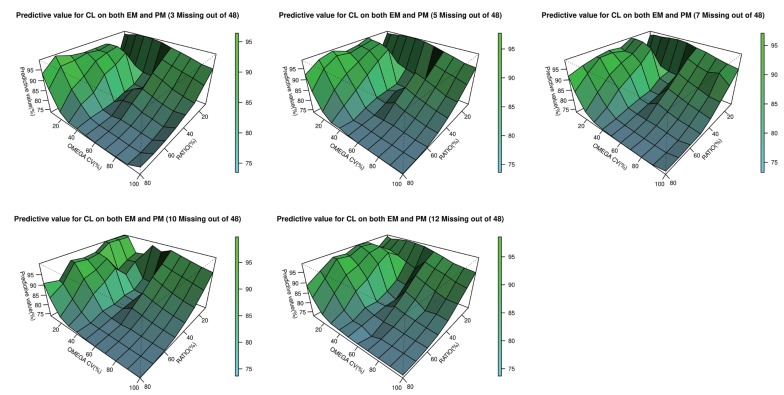
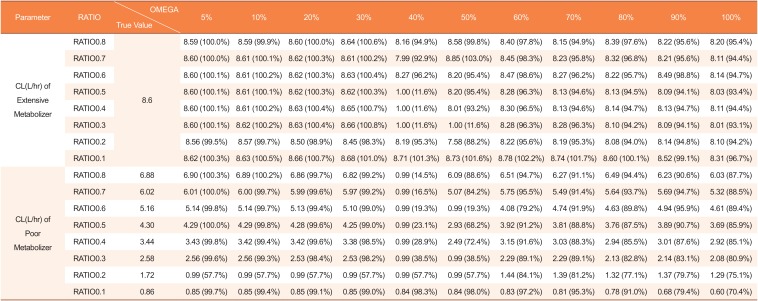
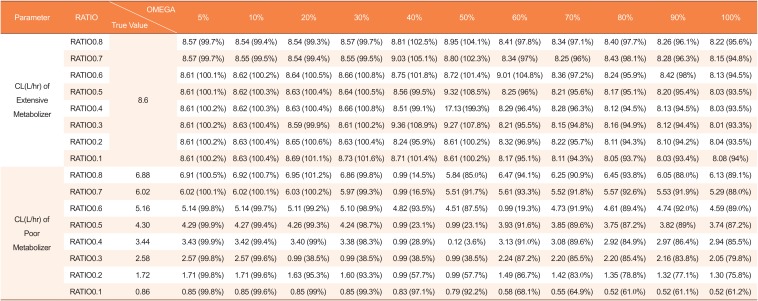
Table 1
Estimated clearances by mixture model using datasets with missing genotype covariates in 3 of 48 subjects (5%)
|
Parameter |
RATIO |
OMEGA\True Value |
5% |
10% |
20% |
30% |
40% |
50% |
60% |
70% |
80% |
90% |
100% |
|
CL(L/hr) of Extensive Metabolizer |
RATIO0.8 |
8.6 |
8.59 (100.0%) |
8.59 (99.9%) |
8.60 (100.0%) |
8.64 (100.6%) |
8.16 (94.9%) |
8.58 (99.8%) |
8.40 (97.8%) |
8.15 (94.9%) |
8.39 (97.6%) |
8.22 (95.6%) |
8.20 (95.4%) |
|
RATIO0.7 |
8.60 (100.0%) |
8.61 (100.1%) |
8.62 (100.3%) |
8.61 (100.2%) |
7.99 (92.9%) |
8.85 (103.0%) |
8.45 (98.3%) |
8.23 (95.8%) |
8.32 (96.8%) |
8.21 (95.6%) |
8.11 (94.4%) |
|
RATIO0.6 |
8.60 (100.1%) |
8.61 (100.2%) |
8.62 (100.3%) |
8.63 (100.4%) |
8.27 (96.2%) |
8.20 (95.4%) |
8.47 (98.6%) |
8.27 (96.2%) |
8.22 (95.7%) |
8.49 (98.8%) |
8.14 (94.7%) |
|
RATIO0.5 |
8.60 (100.1%) |
8.61 (100.1%) |
8.62 (100.3%) |
8.62 (100.3%) |
1.00 (11.6%) |
8.20 (95.4%) |
8.28 (96.3%) |
8.13 (94.6%) |
8.13 (94.5%) |
8.09 (94.1%) |
8.03 (93.4%) |
|
RATIO0.4 |
8.60 (100.1%) |
8.61 (100.2%) |
8.63 (100.4%) |
8.65 (100.7%) |
1.00 (11.6%) |
8.01 (93.2%) |
8.30 (96.5%) |
8.13 (94.6%) |
8.14 (94.7%) |
8.13 (94.7%) |
8.11 (94.4%) |
|
RATIO0.3 |
8.60 (100.1%) |
8.62 (100.2%) |
8.63 (100.4%) |
8.66 (100.8%) |
1.00 (11.6%) |
1.00 (11.6%) |
8.28 (96.3%) |
8.28 (96.3%) |
8.10 (94.2%) |
8.09 (94.1%) |
8.01 (93.1%) |
|
RATIO0.2 |
8.56 (99.5%) |
8.57 (99.7%) |
8.50 (98.9%) |
8.45 (98.3%) |
8.19 (95.3%) |
7.58 (88.2%) |
8.22 (95.6%) |
8.19 (95.3%) |
8.08 (94.0%) |
8.14 (94.8%) |
8.10 (94.2%) |
|
RATIO0.1 |
8.62 (100.3%) |
8.63 (100.5%) |
8.66 (100.7%) |
8.68 (101.0%) |
8.71 (101.3%) |
8.73 (101.6%) |
8.78 (102.2%) |
8.74 (101.7%) |
8.60 (100.1%) |
8.52 (99.1%) |
8.31 (96.7%) |
|
CL(L/hr) of Poor Metabolizer |
RATIO0.8 |
6.88 |
6.90 (100.3%) |
6.89 (100.2%) |
6.86 (99.7%) |
6.82 (99.2%) |
0.99 (14.5%) |
6.09 (88.6%) |
6.51 (94.7%) |
6.27 (91.1%) |
6.49 (94.4%) |
6.23 (90.6%) |
6.03 (87.7%) |
|
RATIO0.7 |
6.02 |
6.01 (100.0%) |
6.00 (99.7%) |
5.99 (99.6%) |
5.97 (99.2%) |
0.99 (16.5%) |
5.07 (84.2%) |
5.75 (95.5%) |
5.49 (91.4%) |
5.64 (93.7%) |
5.69 (94.7%) |
5.32 (88.5%) |
|
RATIO0.6 |
5.16 |
5.14 (99.8%) |
5.14 (99.7%) |
5.13 (99.4%) |
5.10 (99.0%) |
0.99 (19.3%) |
0.99 (19.3%) |
4.08 (79.2%) |
4.74 (91.9%) |
4.63 (89.8%) |
4.94 (95.9%) |
4.61 (89.4%) |
|
RATIO0.5 |
4.30 |
4.29 (100.0%) |
4.29 (99.8%) |
4.28 (99.6%) |
4.25 (99.0%) |
0.99 (23.1%) |
2.93 (68.2%) |
3.92 (91.2%) |
3.81 (88.8%) |
3.76 (87.5%) |
3.89 (90.7%) |
3.69 (85.9%) |
|
RATIO0.4 |
3.44 |
3.43 (99.8%) |
3.42 (99.4%) |
3.42 (99.6%) |
3.38 (98.5%) |
0.99 (28.9%) |
2.49 (72.4%) |
3.15 (91.6%) |
3.03 (88.3%) |
2.94 (85.5%) |
3.01 (87.6%) |
2.92 (85.1%) |
|
RATIO0.3 |
2.58 |
2.56 (99.6%) |
2.56 (99.3%) |
2.53 (98.4%) |
2.53 (98.2%) |
0.99 (38.5%) |
0.99 (38.5%) |
2.29 (89.1%) |
2.29 (89.1%) |
2.13 (82.8%) |
2.14 (83.1%) |
2.08 (80.9%) |
|
RATIO0.2 |
1.72 |
0.99 (57.7%) |
0.99 (57.7%) |
0.99 (57.7%) |
0.99 (57.7%) |
0.99 (57.7%) |
0.99 (57.7%) |
1.44 (84.1%) |
1.39 (81.2%) |
1.32 (77.1%) |
1.37 (79.7%) |
1.29 (75.1%) |
|
RATIO0.1 |
0.86 |
0.85 (99.7%) |
0.85 (99.4%) |
0.85 (99.1%) |
0.85 (99.0%) |
0.84 (98.3%) |
0.84 (98.0%) |
0.83 (97.2%) |
0.81 (95.3%) |
0.78 (91.0%) |
0.68 (79.4%) |
0.60 (70.4%) |

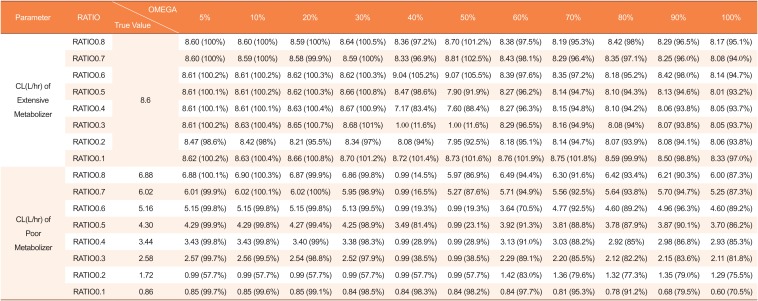
Table 2
Estimated clearances by mixture model using datasets with missing genotype covariates in 5 of 48 subjects (10%)
|
Parameter |
RATIO |
OMEGA\True Value |
s |
10% |
20% |
30% |
40% |
50% |
60% |
70% |
80% |
90% |
100% |
|
CL(L/hr) of Extensive Metabolizer |
RATIO0.8 |
8.6 |
8.60 (100%) |
8.60 (100%) |
8.59 (100%) |
8.64 (100.5%) |
8.36 (97.2%) |
8.70 (101.2%) |
8.38 (97.5%) |
8.19 (95.3%) |
8.42 (98%) |
8.29 (96.5%) |
8.17 (95.1%) |
|
RATIO0.7 |
8.60 (100%) |
8.59 (100%) |
8.58 (99.9%) |
8.59 (100%) |
8.33 (96.9%) |
8.81 (102.5%) |
8.43 (98.1%) |
8.29 (96.4%) |
8.35 (97.1%) |
8.25 (96.0%) |
8.08 (94.0%) |
|
RATIO0.6 |
8.61 (100.2%) |
8.61 (100.2%) |
8.62 (100.3%) |
8.62 (100.3%) |
9.04 (105.2%) |
9.07 (105.5%) |
8.39 (97.6%) |
8.35 (97.2%) |
8.18 (95.2%) |
8.42 (98.0%) |
8.14 (94.7%) |
|
RATIO0.5 |
8.61 (100.1%) |
8.61 (100.2%) |
8.62 (100.3%) |
8.66 (100.8%) |
8.47 (98.6%) |
7.90 (91.9%) |
8.27 (96.2%) |
8.14 (94.7%) |
8.10 (94.3%) |
8.13 (94.6%) |
8.01 (93.2%) |
|
RATIO0.4 |
8.61 (100.1%) |
8.61 (100.1%) |
8.63 (100.4%) |
8.67 (100.9%) |
7.17 (83.4%) |
7.60 (88.4%) |
8.27 (96.3%) |
8.15 (94.8%) |
8.10 (94.2%) |
8.06 (93.8%) |
8.05 (93.7%) |
|
RATIO0.3 |
8.61 (100.2%) |
8.63 (100.4%) |
8.65 (100.7%) |
8.68 (101%) |
1.00 (11.6%) |
1.00 (11.6%) |
8.29 (96.5%) |
8.16 (94.9%) |
8.08 (94%) |
8.07 (93.8%) |
8.05 (93.7%) |
|
RATIO0.2 |
8.47 (98.6%) |
8.42 (98%) |
8.21 (95.5%) |
8.34 (97%) |
8.08 (94%) |
7.95 (92.5%) |
8.18 (95.1%) |
8.14 (94.7%) |
8.07 (93.9%) |
8.08 (94.1%) |
8.06 (93.8%) |
|
RATIO0.1 |
8.62 (100.2%) |
8.63 (100.4%) |
8.66 (100.8%) |
8.70 (101.2%) |
8.72 (101.4%) |
8.73 (101.6%) |
8.76 (101.9%) |
8.75 (101.8%) |
8.59 (99.9%) |
8.50 (98.8%) |
8.33 (97.0%) |
|
CL(L/hr) of Extensive Metabolizer |
RATIO0.0 |
6.88 |
6.88 (100.1%) |
6.90 (100.3%) |
6.87 (99.9%) |
6.86 (99.8%) |
0.99 (14.5%) |
5.97 (86.9%) |
6.49 (94.4%) |
6.30 (91.6%) |
6.42 (93.4%) |
6.21 (90.3%) |
6.00 (87.3%) |
|
RATIO0.7 |
6.02 |
6.01 (99.9%) |
6.02 (100.1%) |
6.02 (100%) |
5.95 (98.9%) |
0.99 (16.5%) |
5.27 (87.6%) |
5.71 (94.9%) |
5.56 (92.5%) |
5.64 (93.8%) |
5.70 (94.7%) |
5.25 (87.3%) |
|
RATIO0.6 |
5.16 |
5.15 (99.8%) |
5.15 (99.8%) |
5.15 (99.8%) |
5.13 (99.5%) |
0.99 (19.3%) |
0.99 (19.3%) |
3.64 (70.5%) |
4.77 (92.5%) |
4.60 (89.2%) |
4.96 (96.3%) |
4.60 (89.2%) |
|
RATIO0.5 |
4.30 |
4.29 (99.9%) |
4.29 (99.8%) |
4.27 (99.4%) |
4.25 (98.9%) |
3.49 (81.4%) |
0.99 (23.1%) |
3.92 (91.3%) |
3.81 (88.8%) |
3.78 (87.9%) |
3.87 (90.1%) |
3.70 (86.2%) |
|
RATIO0.4 |
3.44 |
3.43 (99.8%) |
3.43 (99.8%) |
3.40 (99%) |
3.38 (98.3%) |
0.99 (28.9%) |
0.99 (28.9%) |
3.13 (91.0%) |
3.03 (88.2%) |
2.92 (85%) |
2.98 (86.8%) |
2.93 (85.3%) |
|
RATIO0.3 |
2.58 |
2.57 (99.7%) |
2.56 (99.5%) |
2.54 (98.8%) |
2.52 (97.9%) |
0.99 (38.5%) |
0.99 (38.5%) |
2.29 (89.1%) |
2.20 (85.5%) |
2.12 (82.2%) |
2.15 (83.6%) |
2.11 (81.8%) |
|
RATIO0.2 |
1.72 |
0.99 (57.7%) |
0.99 (57.7%) |
0.99 (57.7%) |
0.99 (57.7%) |
0.99 (57.7%) |
0.99 (57.7%) |
1.42 (83.0%) |
1.36 (79.6%) |
1.32 (77.3%) |
1.35 (79.0%) |
1.29 (75.5%) |
|
RATIO0.1 |
0.86 |
0.85 (99.7%) |
0.85 (99.6%) |
0.85 (99.1%) |
0.84 (98.5%) |
0.84 (98.3%) |
0.84 (98.2%) |
0.84 (97.7%) |
0.81 (95.3%) |
0.78 (91.2%) |
0.68 (79.5%) |
0.60 (70.5%) |
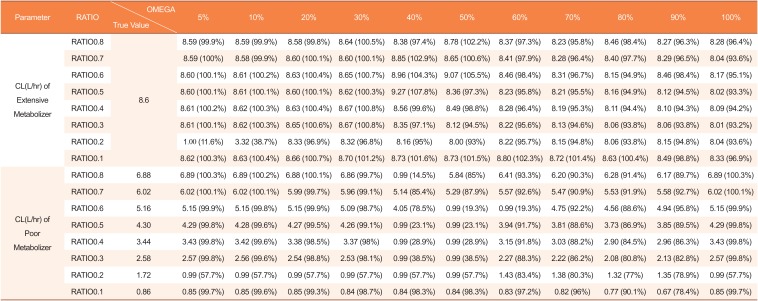
Table 3
Estimated clearances by mixture model using datasets with missing genotype covariates in 7 of 48 subjects (15%)
|
Parameter |
RATIO |
True Value\OMEGA |
5% |
10% |
20% |
30% |
40% |
50% |
60% |
70% |
80% |
90% |
100% |
|
CL(L/hr) of Extensive Metabolizer |
RATIO0.8 |
8.6 |
8.59 (99.9%) |
8.59 (99.9%) |
8.58 (99.8%) |
8.64 (100.5%) |
8.38 (97.4%) |
8.78 (102.2%) |
8.37 (97.3%) |
8.23 (95.8%) |
8.46 (98.4%) |
8.27 (96.3%) |
8.28 (96.4%) |
|
RATIO0.7 |
8.59 (100%) |
8.58 (99.9%) |
8.60 (100.1%) |
8.60 (100.1%) |
8.85 (102.9%) |
8.65 (100.6%) |
8.41 (97.9%) |
8.28 (96.4%) |
8.40 (97.7%) |
8.29 (96.5%) |
8.04 (93.6%) |
|
RATIO0.6 |
8.60 (100.1%) |
8.61 (100.2%) |
8.63 (100.4%) |
8.65 (100.7%) |
8.96 (104.3%) |
9.07 (105.5%) |
8.46 (98.4%) |
8.31 (96.7%) |
8.15 (94.9%) |
8.46 (98.4%) |
8.17 (95.1%) |
|
RATIO0.5 |
8.60 (100.1%) |
8.61 (100.1%) |
8.60 (100.1%) |
8.62 (100.3%) |
9.27 (107.8%) |
8.36 (97.3%) |
8.23 (95.8%) |
8.21 (95.5%) |
8.16 (94.9%) |
8.12 (94.5%) |
8.02 (93.3%) |
|
RATIO0.4 |
8.61 (100.2%) |
8.62 (100.3%) |
8.63 (100.4%) |
8.67 (100.8%) |
8.56 (99.6%) |
8.49 (98.8%) |
8.28 (96.4%) |
8.19 (95.3%) |
8.11 (94.4%) |
8.10 (94.3%) |
8.09 (94.2%) |
|
RATIO0.3 |
8.61 (100.1%) |
8.62 (100.3%) |
8.65 (100.6%) |
8.67 (100.8%) |
8.35 (97.1%) |
8.12 (94.5%) |
8.22 (95.6%) |
8.13 (94.6%) |
8.06 (93.8%) |
8.06 (93.8%) |
8.01 (93.2%) |
|
RATIO0.2 |
1.00 (11.6%) |
3.32 (38.7%) |
8.33 (96.9%) |
8.32 (96.8%) |
8.16 (95%) |
8.00 (93%) |
8.22 (95.7%) |
8.15 (94.8%) |
8.06 (93.8%) |
8.15 (94.8%) |
8.04 (93.6%) |
|
RATIO0.1 |
8.62 (100.3%) |
8.63 (100.4%) |
8.66 (100.7%) |
8.70 (101.2%) |
8.73 (101.6%) |
8.73 (101.5%) |
8.80 (102.3%) |
8.72 (101.4%) |
8.63 (100.4%) |
8.49 (98.8%) |
8.33 (96.9%) |
|
CL(L/hr) of Poor Metabolizer |
RATIO0.8 |
6.88 |
6.89 (100.3%) |
6.89 (100.2%) |
6.88 (100.1%) |
6.86 (99.7%) |
0.99 (14.5%) |
5.84 (85%) |
6.41 (93.3%) |
6.20 (90.3%) |
6.28 (91.4%) |
6.17 (89.7%) |
6.89 (100.3%) |
|
RATIO0.7 |
6.02 |
6.02 (100.1%) |
6.02 (100.1%) |
5.99 (99.7%) |
5.96 (99.1%) |
5.14 (85.4%) |
5.29 (87.9%) |
5.57 (92.6%) |
5.47 (90.9%) |
5.53 (91.9%) |
5.58 (92.7%) |
6.02 (100.1%) |
|
RATIO0.6 |
5.16 |
5.15 (99.9%) |
5.15 (99.8%) |
5.15 (99.9%) |
5.09 (98.7%) |
4.05 (78.5%) |
0.99 (19.3%) |
0.99 (19.3%) |
4.75 (92.2%) |
4.56 (88.6%) |
4.94 (95.8%) |
5.15 (99.9%) |
|
RATIO0.5 |
4.30 |
4.29 (99.8%) |
4.28 (99.6%) |
4.27 (99.5%) |
4.26 (99.1%) |
0.99 (23.1%) |
0.99 (23.1%) |
3.94 (91.7%) |
3.81 (88.6%) |
3.73 (86.9%) |
3.85 (89.5%) |
4.29 (99.8%) |
|
RATIO0.4 |
3.44 |
3.43 (99.8%) |
3.42 (99.6%) |
3.38 (98.5%) |
3.37 (98%) |
0.99 (28.9%) |
0.99 (28.9%) |
3.15 (91.8%) |
3.03 (88.2%) |
2.90 (84.5%) |
2.96 (86.3%) |
3.43 (99.8%) |
|
RATIO0.3 |
2.58 |
2.57 (99.8%) |
2.56 (99.6%) |
2.54 (98.8%) |
2.53 (98.1%) |
0.99 (38.5%) |
0.99 (38.5%) |
2.27 (88.3%) |
2.22 (86.2%) |
2.08 (80.8%) |
2.13 (82.8%) |
2.57 (99.8%) |
|
RATIO0.2 |
1.72 |
0.99 (57.7%) |
0.99 (57.7%) |
0.99 (57.7%) |
0.99 (57.7%) |
0.99 (57.7%) |
0.99 (57.7%) |
1.43 (83.4%) |
1.38 (80.3%) |
1.32 (77%) |
1.35 (78.9%) |
0.99 (57.7%) |
|
RATIO0.1 |
0.86 |
0.85 (99.7%) |
0.85 (99.6%) |
0.85 (99.3%) |
0.84 (98.7%) |
0.84 (98.3%) |
0.84 (98.3%) |
0.83 (97.2%) |
0.82 (96%) |
0.77 (90.1%) |
0.67 (78.4%) |
0.85 (99.7%) |
Table 4
Estimated clearances by mixture model using datasets with missing genotype covariates in 10 of 48 subjects (20%)
|
Parameter |
RATIO |
True Value\OMEGA |
5% |
10% |
20% |
30% |
40% |
50% |
60% |
70% |
80% |
90% |
100% |
|
CL(L/hr) of Extensive Metabolizer |
RATIO0.8 |
8.6 |
8.57 (99.7%) |
8.54 (99.4%) |
8.54 (99.3%) |
8.57 (99.7%) |
8.81 (102.5%) |
8.95 (104.1%) |
8.41 (97.8%) |
8.34 (97.1%) |
8.40 (97.7%) |
8.26 (96.1%) |
8.22 (95.6%) |
|
RATIO0.7 |
8.57 (99.7%) |
8.55 (99.5%) |
8.54 (99.4%) |
8.55 (99.5%) |
9.03 (105.1%) |
8.80 (102.3%) |
8.34 (97%) |
8.25 (96%) |
8.43 (98.1%) |
8.28 (96.3%) |
8.15 (94.8%) |
|
RATIO0.6 |
8.61 (100.1%) |
8.62 (100.2%) |
8.64 (100.5%) |
8.66 (100.8%) |
8.75 (101.8%) |
8.72 (101.4%) |
9.01 (104.8%) |
8.36 (97.2%) |
8.24 (95.9%) |
8.42 (98%) |
8.13 (94.5%) |
|
RATIO0.5 |
8.61 (100.1%) |
8.62 (100.3%) |
8.63 (100.4%) |
8.64 (100.5%) |
8.56 (99.5%) |
9.32 (108.5%) |
8.25 (96%) |
8.21 (95.6%) |
8.17 (95.1%) |
8.20 (95.4%) |
8.03 (93.5%) |
|
RATIO0.4 |
8.61 (100.2%) |
8.62 (100.3%) |
8.63 (100.4%) |
8.66 (100.8%) |
8.51 (99.1%) |
17.13 (199.3%) |
8.29 (96.4%) |
8.28 (96.3%) |
8.12 (94.5%) |
8.13 (94.5%) |
8.03 (93.5%) |
|
RATIO0.3 |
8.61 (100.2%) |
8.63 (100.4%) |
8.59 (99.9%) |
8.61 (100.2%) |
9.36 (108.9%) |
9.27 (107.8%) |
8.21 (95.5%) |
8.15 (94.8%) |
8.16 (94.9%) |
8.12 (94.4%) |
8.01 (93.3%) |
|
RATIO0.2 |
8.61 (100.2%) |
8.63 (100.4%) |
8.65 (100.6%) |
8.63 (100.4%) |
8.24 (95.9%) |
8.61 (100.2%) |
8.32 (96.9%) |
8.22 (95.7%) |
8.11 (94.3%) |
8.10 (94.2%) |
8.04 (93.5%) |
|
RATIO0.1 |
8.61 (100.2%) |
8.63 (100.4%) |
8.69 (101.1%) |
8.73 (101.6%) |
8.71 (101.4%) |
8.61 (100.2%) |
8.17 (95.1%) |
8.11 (94.3%) |
8.05 (93.7%) |
8.03 (93.4%) |
8.08 (94%) |
|
CL(L/hr) of Poor Metabolizer |
RATIO0.8 |
6.88 |
6.91 (100.5%) |
6.92 (100.7%) |
6.95 (101.2%) |
6.86 (99.8%) |
0.99 (14.5%) |
5.84 (85.0%) |
6.47 (94.1%) |
6.25 (90.9%) |
6.45 (93.8%) |
6.05 (88.0%) |
6.13 (89.1%) |
|
RATIO0.7 |
6.02 |
6.02 (100.1%) |
6.02 (100.1%) |
6.03 (100.2%) |
5.97 (99.3%) |
0.99 (16.5%) |
5.51 (91.7%) |
5.61 (93.3%) |
5.52 (91.8%) |
5.57 (92.6%) |
5.53 (91.9%) |
5.29 (88.0%) |
|
RATIO0.6 |
5.16 |
5.14 (99.8%) |
5.14 (99.7%) |
5.11 (99.2%) |
5.10 (98.9%) |
4.82 (93.5%) |
4.51 (87.5%) |
0.99 (19.3%) |
4.73 (91.9%) |
4.61 (89.4%) |
4.74 (92.0%) |
4.59 (89.0%) |
|
RATIO0.5 |
4.30 |
4.29 (99.9%) |
4.27 (99.4%) |
4.26 (99.3%) |
4.24 (98.7%) |
0.99 (23.1%) |
0.99 (23.1%) |
3.93 (91.6%) |
3.85 (89.6%) |
3.75 (87.2%) |
3.82 (89%) |
3.74 (87.2%) |
|
RATIO0.4 |
3.44 |
3.43 (99.9%) |
3.42 (99.4%) |
3.40 (99%) |
3.38 (98.3%) |
0.99 (28.9%) |
0.12 (3.6%) |
3.13 (91.0%) |
3.08 (89.6%) |
2.92 (84.9%) |
2.97 (86.4%) |
2.94 (85.5%) |
|
RATIO0.3 |
2.58 |
2.57 (99.8%) |
2.57 (99.6%) |
0.99 (38.5%) |
0.99 (38.5%) |
0.99 (38.5%) |
0.99 (38.5%) |
2.24 (87.2%) |
2.20 (85.5%) |
2.20 (85.4%) |
2.16 (83.8%) |
2.05 (79.8%) |
|
RATIO0.2 |
1.72 |
1.71 (99.8%) |
1.71 (99.6%) |
1.63 (95.3%) |
1.60 (93.3%) |
0.99 (57.7%) |
0.99 (57.7%) |
1.49 (86.7%) |
1.42 (83.0%) |
1.35 (78.8%) |
1.32 (77.1%) |
1.30 (75.8%) |
|
RATIO0.1 |
0.86 |
0.85 (99.8%) |
0.85 (99.6%) |
0.85 (99%) |
0.85 (99.3%) |
0.83 (97.1%) |
0.79 (92.2%) |
0.58 (68.1%) |
0.55 (64.9%) |
0.52 (61.0%) |
0.52 (61.1%) |
0.52 (61.2%) |
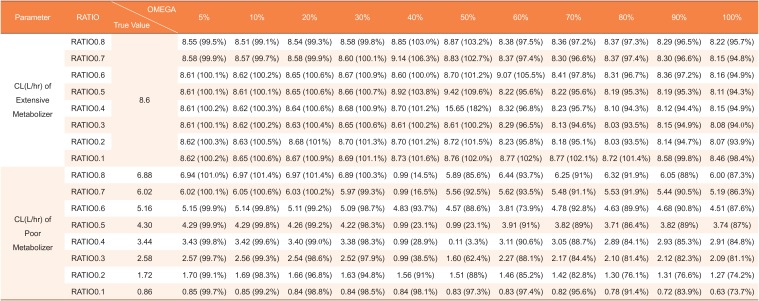
Table 5
Estimated clearances by mixture model using datasets with missing genotype covariates in 12 of 48 subjects (25%)
|
Parameter |
RATIO |
OMEGA\True Value |
5% |
10% |
20% |
30% |
40% |
50% |
60% |
70% |
80% |
90% |
100% |
|
CL(L/hr) of Extensive Metabolizer |
RATIO0.8 |
8.6 |
8.55 (99.5%) |
8.51 (99.1%) |
8.54 (99.3%) |
8.58 (99.8%) |
8.85 (103.0%) |
8.87 (103.2%) |
8.38 (97.5%) |
8.36 (97.2%) |
8.37 (97.3%) |
8.29 (96.5%) |
8.22 (95.7%) |
|
RATIO0.7 |
8.58 (99.9%) |
8.57 (99.7%) |
8.58 (99.9%) |
8.60 (100.1%) |
9.14 (106.3%) |
8.83 (102.7%) |
8.37 (97.4%) |
8.30 (96.6%) |
8.37 (97.4%) |
8.30 (96.6%) |
8.15 (94.8%) |
|
RATIO0.6 |
8.61 (100.1%) |
8.62 (100.2%) |
8.65 (100.6%) |
8.67 (100.9%) |
8.60 (100.0%) |
8.70 (101.2%) |
9.07 (105.5%) |
8.41 (97.8%) |
8.31 (96.7%) |
8.36 (97.2%) |
8.16 (94.9%) |
|
RATIO0.5 |
8.61 (100.1%) |
8.61 (100.1%) |
8.65 (100.6%) |
8.66 (100.7%) |
8.92 (103.8%) |
9.42 (109.6%) |
8.22 (95.6%) |
8.22 (95.6%) |
8.19 (95.3%) |
8.19 (95.3%) |
8.11 (94.3%) |
|
RATIO0.4 |
8.61 (100.2%) |
8.62 (100.3%) |
8.64 (100.6%) |
8.68 (100.9%) |
8.70 (101.2%) |
15.65 (182%) |
8.32 (96.8%) |
8.23 (95.7%) |
8.10 (94.3%) |
8.12 (94.4%) |
8.15 (94.9%) |
|
RATIO0.3 |
8.61 (100.1%) |
8.62 (100.2%) |
8.63 (100.4%) |
8.65 (100.6%) |
8.61 (100.2%) |
8.61 (100.2%) |
8.29 (96.5%) |
8.13 (94.6%) |
8.03 (93.5%) |
8.15 (94.9%) |
8.08 (94.0%) |
|
RATIO0.2 |
8.62 (100.3%) |
8.63 (100.5%) |
8.68 (101%) |
8.70 (101.3%) |
8.70 (101.2%) |
8.72 (101.5%) |
8.23 (95.8%) |
8.18 (95.1%) |
8.03 (93.5%) |
8.14 (94.7%) |
8.07 (93.9%) |
|
RATIO0.1 |
8.62 (100.2%) |
8.65 (100.6%) |
8.67 (100.9%) |
8.69 (101.1%) |
8.73 (101.6%) |
8.76 (102.0%) |
8.77 (102%) |
8.77 (102.1%) |
8.72 (101.4%) |
8.58 (99.8%) |
8.46 (98.4%) |
|
CL(L/hr) of Poor Metabolizer |
RATIO0.8 |
6.88 |
6.94 (101.0%) |
6.97 (101.4%) |
6.97 (101.4%) |
6.89 (100.3%) |
0.99 (14.5%) |
5.89 (85.6%) |
6.44 (93.7%) |
6.25 (91%) |
6.32 (91.9%) |
6.05 (88%) |
6.00 (87.3%) |
|
RATIO0.7 |
6.02 |
6.02 (100.1%) |
6.05 (100.6%) |
6.03 (100.2%) |
5.97 (99.3%) |
0.99 (16.5%) |
5.56 (92.5%) |
5.62 (93.5%) |
5.48 (91.1%) |
5.53 (91.9%) |
5.44 (90.5%) |
5.19 (86.3%) |
|
RATIO0.6 |
5.16 |
5.15 (99.9%) |
5.14 (99.8%) |
5.11 (99.2%) |
5.09 (98.7%) |
4.83 (93.7%) |
4.57 (88.6%) |
3.81 (73.9%) |
4.78 (92.8%) |
4.63 (89.9%) |
4.68 (90.8%) |
4.51 (87.6%) |
|
RATIO0.5 |
4.30 |
4.29 (99.9%) |
4.29 (99.8%) |
4.26 (99.2%) |
4.22 (98.3%) |
0.99 (23.1%) |
0.99 (23.1%) |
3.91 (91%) |
3.82 (89%) |
3.71 (86.4%) |
3.82 (89%) |
3.74 (87%) |
|
RATIO0.4 |
3.44 |
3.43 (99.8%) |
3.42 (99.6%) |
3.40 (99.0%) |
3.38 (98.3%) |
0.99 (28.9%) |
0.12 (3.6%) |
3.11 (90.6%) |
3.05 (88.7%) |
2.89 (84.1%) |
2.93 (85.3%) |
2.91 (84.8%) |
|
RATIO0.3 |
2.58 |
2.57 (99.7%) |
2.56 (99.3%) |
2.54 (98.6%) |
2.52 (97.9%) |
0.99 (38.5%) |
1.60 (62.4%) |
2.27 (88.1%) |
2.17 (84.4%) |
2.10 (81.4%) |
2.12 (82.3%) |
2.09 (81.1%) |
|
RATIO0.2 |
1.72 |
1.70 (99.1%) |
1.69 (98.3%) |
1.66 (96.8%) |
1.63 (94.8%) |
1.56 (91%) |
1.51 (88%) |
1.46 (85.2%) |
1.42 (82.8%) |
1.30 (76.1%) |
1.31 (76.6%) |
1.27 (74.2%) |
|
RATIO0.1 |
0.86 |
0.85 (99.7%) |
0.85 (99.2%) |
0.84 (98.8%) |
0.84 (98.5%) |
0.84 (98.1%) |
0.83 (97.3%) |
0.83 (97.4%) |
0.82 (95.6%) |
0.78 (91.4%) |
0.72 (83.9%) |
0.63 (73.7%) |
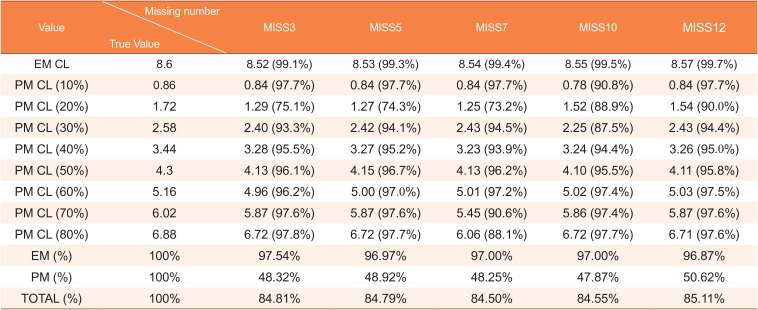
Table 6
Clearance estimates according to the missing proportion of genotype data
|
Value |
True Value\Missing number |
MISS3 |
MISS5 |
MISS7 |
MISS10 |
MISS12 |
|
EM CL |
8.6 |
8.52 (99.1%) |
8.53 (99.3%) |
8.54 (99.4%) |
8.55 (99.5%) |
8.57 (99.7%) |
|
PM CL (10%) |
0.86 |
0.84 (97.7%) |
0.84 (97.7%) |
0.84 (97.7%) |
0.78 (90.8%) |
0.84 (97.7%) |
|
PM CL (20%) |
1.72 |
1.29 (75.1%) |
1.27 (74.3%) |
1.25 (73.2%) |
1.52 (88.9%) |
1.54 (90.0%) |
|
PM CL (30%) |
2.58 |
2.40 (93.3%) |
2.42 (94.1%) |
2.43 (94.5%) |
2.25 (87.5%) |
2.43 (94.4%) |
|
PM CL (40%) |
3.44 |
3.28 (95.5%) |
3.27 (95.2%) |
3.23 (93.9%) |
3.24 (94.4%) |
3.26 (95.0%) |
|
PM CL (50%) |
4.3 |
4.13 (96.1%) |
4.15 (96.7%) |
4.13 (96.2%) |
4.10 (95.5%) |
4.11 (95.8%) |
|
PM CL (60%) |
5.16 |
4.96 (96.2%) |
5.00 (97.0%) |
5.01 (97.2%) |
5.02 (97.4%) |
5.03 (97.5%) |
|
PM CL (70%) |
6.02 |
5.87 (97.6%) |
5.87 (97.6%) |
5.45 (90.6%) |
5.86 (97.4%) |
5.87 (97.6%) |
|
PM CL (80%) |
6.88 |
6.72 (97.8%) |
6.72 (97.7%) |
6.06 (88.1%) |
6.72 (97.7%) |
6.71 (97.6%) |
|
EM (%) |
100% |
97.54% |
96.97% |
97.00% |
97.00% |
96.87% |
|
PM (%) |
100% |
48.32% |
48.92% |
48.25% |
47.87% |
50.62% |
|
TOTAL (%) |
100% |
84.81% |
84.79% |
84.50% |
84.55% |
85.11% |
Discussion
A mixture model in NONMEM® can be applied to data missing categorical covariates and for data with mixed, functionally different subpopulations where unidentified factors are causing said difference. However, the accuracy and predictability of the mixture model varied under different scenarios. In this simulation, we evaluated the accuracy and predictability of a mixture model in NONMEM® using different inter-individual variabilities, various parameter differences, and different probabilities of missing values. Overall, the accuracy and predictability were better when the difference in CL between subpopulations was larger, and the inter-individual variations were smaller.
If inter-individual variations exceeds 40% in CV(%), accuracy and predictability decreased rapidly, compared with 30% in CV(%), (accuracy, 91.0% → 46.3%; predictability, 86.9% → 80.6%).
In datasets where the CL PM/EM ratio is 0.2, or the CV(%) of the CL is 40% and 50%, their ETA or epsilon shrinkage was much higher than for other groups, and the clearance estimates were significantly biased and did not show clear bimodal distribution. As a result, accuracy and predictability were much lower when compared with other groups. It has been reported that the model has a high probability of being incorrect when the shrinkage (SD-based) is more than 30%.[
3] When estimating parameters, except for values with shrinkage of 30% or more, the outlier values have been greatly reduced, and the values are much more consistent with the above assumption. A table estimating parameters, except for values with shrinkage of 30% or more, are presented in
Supplement 1. Based on these results, we should consider that shrinkage can affect the outcome when we use the mixture model.
The mixture model predicted the EM subpopulation well, but the predictability of the PM subpopulation was much more variable. And in PM subpopulations, the predictability was significantly different depending on the PM/EM ratio of CL and on the inter-individual differences of CL (95% → 3%).
However, the estimated values were not significantly affected by the tested ratio, even if up to 25% of the value was missing, if the sample size was secured to some extent.
There are some limitations to this study. First, the work presented here dealt with a simple model; thus, its accuracy and predictability may be different when applied to a much more complex pharmacokinetic/pharmacodynamic model. Second, the data were only simulated when the total number of people in the clinical trial was 48, and we did not predict the accuracy of the mixture model when the missing ratio for a specific covariate was more than 25%.
Notwithstanding these limitations, we made a reference result according to the degree of difference between subpopulations and the value of inter-individual variations using the mixture model.
It is also worth noting that when the size of inter-individual differences was larger, the accuracy decreased more. Moreover, if the CV(%) for inter-individual differences was more than 40%, the predictability for a smaller subpopulation group is very low except when the difference in a parameter among subpopulations is large (i.e., more than double). Also, we found that the accuracy and predictability of the mixture model were significantly biased.
In conclusion, this study examined the accuracy and predictability of a mixture model for parameter estimation using data with a missing categorical covariate in various scenarios. The results suggest that when the CV of inter-individual variations of clearance exceeds 40%, the mixture model should be used carefully, and shrinkage can significantly bias the results.
Acknowledgments
This study was supported by the Technology Innovation Program (grant numbers: 10067737, Establishment of risk management platform with aim to reduce attrition of new drugs and its service) funded by the Ministry of Trade, Industry & Energy (MI, Korea).
References
1. Blake CM, Kharasch ED, Schwab M, Nagele P. A Meta-Analysis of CYP2D6 Metabolizer Phenotype and Metoprolol Pharmacokinetics. Clin Pharmacol Ther. 2013; 94:394–399. DOI:
10.1038/clpt.2013.96. PMID:
23665868.

2. Noetzli M, Guidi M, Ebbing K, Eyer S, Wilhelm L, Michon A, et al. Population pharmacokinetic approach to evaluate the effect of CYP2D6, CYP3A, ABCB1, POR, and NR1I2 genotypes on donepezil clearance. Br J Clin Pharmacol. 2014; 78:135–144. DOI:
10.1111/bcp.12325. PMID:
24433464.
3. Savic RM, Karlsson MO. Importance of Shrinkage in Empirical Bayes Estimates for Diagnostics: Problems and Solutions. AAPS J. 2009; 11:558–569. DOI:
10.1208/s12248-009-9133-0. PMID:
19649712.
Supplementary Material
Supplementary 1
Supplement in ‘Performance of mixture model in missing categorical covariate’ article.
tcp-27-141-s001.pdf


 PDF
PDF ePub
ePub Citation
 Print
Print


 XML Download