

 PDF
PDF Citation
 Print
Print


INTRODUCTION
Mortality and prevalence are important measures of the health status of the human population.1 They are influenced by social, economic, and cultural factors as well as by the social groups to which an individual belongs.23 Identifying a country's mortality and prevalence trends can help to understand the health level of its population, disease characteristics of the country, and predict future situations.
This is especially important for Korea as it is a country that has shown a rapid change in demographic characteristics, with an increasing proportion of people with chronic diseases resulting in increases in the burden of disease and in life expectancy. These rapid changes may have been influenced by social and economic changes in Korea. Therefore, it is necessary to evaluate the long-term mortality and prevalence trends in Korea to build a long-term health plan, make priority decisions in health policies, and find adjustable factors that may contribute to the trends.
Previous studies regarding mortality and prevalence have dealt with mortality and prevalence rates for specific diseases in a particular year or analyzed mortality and prevalence rates separately. Therefore, it was difficult to know the overall disease-related trends in Korea based on these previous studies.456
METHODS
Data sources
To estimate the national representative prevalence rates of selected diseases, we used the Korea Central Cancer Registry (KCCR) for cancer, Korea National Hospital Discharge Injury Surveillance data for injuries, and National Health Insurance Service (NHIS) claims data for other diseases. To estimate the mortality rates for selected diseases, we used the Cause of Death Statistics from Statistics Korea. Because the National Hospital Discharge Injury Surveillance data are available from 2004, the injury prevalence rate was estimated for the period 2004–2014, and the mortality rate was estimated for the period 2002–2015. The mid-year population reported by the National Statistical Office for each year was used to calculate the prevalence and mortality rates. To compare the prevalence and mortality rates, we calculated the age-adjusted estimates based on data from the 2000 Census from the Korean National Statistical Office.
Case definition
In this study, 206 mutually exclusive diseases and injuries in Korea were classified into 21 cause clusters based on the 2015 Korean Burden of Disease study (KBD).6 These 21 cause clusters were further divided into three broad cause groups: 1) communicable, maternal, neonatal, and nutritional conditions (CMNNs); 2) non-communicable diseases (NCDs); and 3) injuries. Detailed information on the definitions of cause of death and Korean standard classification of diseases were described in the 2015 KBD.6
The health insurance claim data are widely used as a source of estimates of disease prevalence, but the number of patients calculated from NHIS claims is affected by the disease-specific disease range and the prevalence criteria.7 Using the same criteria as the KBD and Injuries study 2015, we defined individuals with each disease as those who were hospitalized at least once or who had appointments in outpatient clinics 1–5 times, depending on the disease.6 Cancers were defined according to ICD-10 codes derived from the KBD 2012 study's cause categories.8
The cause group for CMNNs was divided into seven cause clusters: 1) human immunodeficiency virus infection and acquired immune deficiency syndrome (HIV/AIDS) and tuberculosis; 2) diarrhea, lower respiratory infections, meningitis, and other common infectious diseases; 3) neglected tropical diseases and malaria; 4) maternal disorders; 5) neonatal disorders; 6) nutritional deficiencies; and 7) other communicable, maternal, neonatal, and nutritional disorders.
The NCD-cause group was divided into 10 cause clusters: 8) neoplasms; 9) cardiovascular and circulatory diseases; 10) chronic respiratory diseases; 11) cirrhosis of the liver; 12) digestive diseases except cirrhosis; 13) neurological disorders; 14) mental and behavioral disorders; 15) diabetes, urogenital, blood, and endocrine diseases; 16) musculoskeletal disorders; and 17) other NCDs.
The injury-cause group was divided into four cause clusters: 18) transport injuries; 19) unintentional injuries other than transport injuries; 20) self-harm and interpersonal violence; and 21) forces of nature, war, and legal interventions.
Statistical analysis
The mortality and prevalence rates were calculated based on the number of deaths, prevalence, and mid-year population in each year.
To estimate the mortality rates, the number of deaths was determined using the garbage code redistribution method9 for listed causes that could not have been the actual cause of death. Using the modified algorithm for garbage code redistribution, when calculating the number and mortality of diseases has improved the accuracy of defining the cause of death and the validity of the causal attribution.10 To compare annual mortality rates from 2002 to 2015, age-adjusted mortality rates were calculated using the 2000 Census from the Korean National Statistical Office (standard population). After calculating the crude mortality rates by age, the direct age-adjusted mortality rate was produced based on the standardized population.
The crude prevalence rate was calculated by mid-year population in each year from 2002 to 2015, standardized against the 2000 Census from the Korean National Statistical Office. The detailed method for obtaining the cancer and injury prevalence rates used for the survey has been previous described.1112
All-cause specific trends for age-standardized mortality and prevalence rates were analyzed by the joinpoint regression method13 using the Joinpoint Regression Program (version 4.5.0.1; Statistical Research and Applications Branch, National Cancer Institute, Bethesda, MD, USA). In joinpoint regression analysis, as the study period was relatively short for estimation, the maximum number of join points was set to 1. The degree of change during the period is presented as the annual percentage change (APC) rate over a specific period.
RESULTS
Overall, between 2002 and 2015, the age-standardized mortality rates for all causes decreased from 477.27 to 299.80, and the average annual change (AAPC) was −3.5% (95% confidence interval [CI], −3.8 to −3.3) for the entire period. Joinpoint analysis showed that the APC during the period 2007–2015 (APC, −3.2%; 95% CI, −3.5 to −2.9) was significantly different (P < 0.05) from the APC during the period 2002–2007 (APC, −4.0%; 95% CI, −4.6 to −3.4). The age-standardized prevalence rates for all causes increased from 77,421.48 to 145,487.30 (AAPC, 5.9%; 95% CI, 4.1 to 7.8). Joinpoint analysis indicated that the APC increased significantly during the period 2002–2009 (APC, 10.2; 95% CI, 7.5 to 13.0), and the increase has slowed somewhat since 2009 (Table 1).
Table 1
Trends in age-standardized mortality and prevalence rates for all causes in Korea according to joinpoint analyses, 2002–2015 (per 100,000 population)
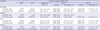
APC = annual percent change, CI = confidence interval, CMNN = communicable, maternal, neonatal & nutritional disorders, NCD = non-communicable disease.
aAge-standardized mortality rates adjusted to the 2000 Census in Korea; bAge-standardized prevalence rates adjusted to the 2000 Census in Korea; c
P < 0.05.
![]()
The causes of diseases were divided into three categories, i.e., CMNNs, NCDs, and injuries. The decreases in mortality rates were unaffected by changes in all three categories from 2002 to 2015. The differences in mortality decline were not significant in the three categories from 2002 to 2015, while increases in prevalence rates (AAPC, 5.9%) were affected by increases in the prevalence of NCDs (AAPC, 8.9%; 95% CI, 6.9 to 10.9) compared to CMNNs (AAPC, 3.0%; 95% CI, −2.5 to −0.4) and injuries (AAPC, 2.2%; 95% CI, 1.2 to 3.3) (Table 1).
Fig. 1 shows the proportion of deaths from diseases and the distribution of patient numbers by three broad causal categories: NCDs, CMNNs, and injuries. NCDs continuously showed the highest number of deaths among the three categories from 2002 to 2015 (Fig. 1), even as the patient numbers clearly changed in 2015 compared to 2002. In 2002, CMNNs showed the highest number of patient cases (60.17%), and NCDs showed the lowest, at 39.83%. However, in 2015, NCDs had the greatest number of patients (57.64%) (Fig. 1).
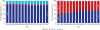 | Fig. 1Proportion of deaths from diseases and distribution of the patient numbers by three broad causal categories: CMNNs, NCDs, injuries, 2002–2015.CMNN = communicable, maternal, neonatal & nutritional disorders, NCD = non-communicable disease.
|
Mortality rates
The trends in mortality rates for CMNNs decreased (AAPC, −3.4%; 95% CI, −3.8 to −3.0) during the period 2002–2015 except for maternal disorders. The mortality rate of maternal disorders increased slightly in this period, but the APC of maternal disorders was not significant (Table 1 and Fig. 2).
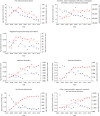 | Fig. 2Age-standardized mortality and prevalence rate for communicable, maternal, neonatal & nutritional disorders in Korea, 2002–2015.HIV/AIDS = human immunodeficiency virus infection and acquired immune deficiency syndrome.
|
In addition, the NCD mortality rate decreased (AAPC, −3.9%; 95% CI, −4.1 to −3.7) continuously throughout the study period, and the APC shifted from −4.5% (95% CI, −4.8 to −4.2) during the period 2002–2009 to −3.3% (95% CI, −3.6 to −2.9) during the period 2009–2015 (Table 1). The mortality rate of neurological disorders decreased during the period 2002–2005 (APC, −5.6%; 95% CI, −11.7 to 1.0) and then increased during the period 2005–2015 (APC, 2.3%; 95% CI, 1.3 to 3.4) (Table 2 and Fig. 3).
Table 2
Joinpoint analysis of age-standardized mortality and prevalence trends in Korea, 2002–2015
APC = annual percent change, CI = confidence interval, CMNN = communicable, maternal, neonatal & nutritional disorders, HIV/AIDS = human immunodeficiency virus infection and acquired immune deficiency syndrome, NCD = non-communicable disease.
aAge-standardized mortality rates adjusted to the 2000 Census in Korea; bage-standardized prevalence rates adjusted to the 2000 Census in Korea; c
P < 0.05; devaluated from 2004 to 2014.
![]()
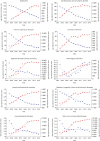 | Fig. 3Age-standardized mortality and prevalence rates for non-communicable disease causes in Korea, 2002–2015.
|
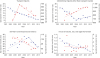
The mortality rate for injuries decreased from 62.21 to 51.96 (AAPC, −1.5%; 95% CI, −2.5 to −0.4) (Table 1), and the APC was significant during the period 2011–2015 (APC, −3.8%; 95% CI, −7.0 to −0.6). Mortality rates for unintentional injuries other than transport injuries decreased during the period 2002–2009 (APC, −3.3%; 95% CI, −4.3 to −2.2), and increased during the period 2009–2015 (APC, 1.0%; 95% CI, −0.4 to 2.4). However, there was no meaningful change after this period. In addition, the rates of self-harm and interpersonal violence increased during the period 2002–2011 (APC, 3.5%; 95% CI, 1.4 to 5.7) and then decreased during the period 2011–2015 (APC, −6.5%; 95% CI, −12.9 to 0.4) (Table 2 and Fig. 4).
Prevalence rates
The prevalence rates for CMNNs increased during the period 2002–2009 (APC, 5.8%; 95% CI, 3.1 to 8.6) and then decreased during the period 2009 – 2015 (APC, −0.2%; 95% CI, −3.4 to 3.1) (Table 1). For HIV/AIDS and tuberculosis, the prevalence rate increased by 3.8% (95% CI, 0.2 to 7.5) during the initial period (2002–2006), but decreased continuously during the period 2006–2015 (APC, −2.3%; 95% CI, −3.3 to −1.3). The prevalence rates of neglected tropical diseases and malaria increased during the period 2002–2005 (APC, 32.7%; 95% CI, 7.4 to 64.0) and then decreased during the period 2005–2015 (APC, −3.5%; 95% CI, −6.6 to −0.3). However, this was unusual because of the large 95% CI (7.4 to 64.0), and further observations are therefore needed (Table 2 and Fig. 2).
All cause clusters in NCD prevalence rates increased during the study period (AAPC, 8.9%; 95% CI, 6.9 to 10.9). The APC during the period 2002–2009 (APC, 14.7%; 95% CI, 11.7 to 17.8) was significantly increased. In addition, the APC was slightly increased during the period 2009–2015 (APC, 2.4%; 95% CI, −1.0 to 5.9) (Table 1). The proportion of patients due to CMNNs continued to decrease, from 60.17% in 2002 to 42.36% in 2015, whereas the proportion of patients due to NCDs increased from 39.83% in 2002 to 57.64% in 2015 (Fig. 1).
The prevalence rates for injuries increased during the period from 2004 to 2014 (AAPC, 2.2%; 95% CI, 1.2 to 3.3). The APC during the period 2004–2006 (APC, 8.2%; 95% CI, 2.0 to 14.7) was significantly different (P < 0.05) from the APC during the period 2006–2014 (APC, 0.8%; 95% CI, 0.2 to 1.5) (Table 1 and Fig. 1). The rates for transport injuries increased significantly during the period 2004–2007 (APC, 5.1%; 95% CI, 2.0 to 8.3), but decreased during the period 2007–2014 (APC, −1.5%; 95% CI, −2.3 to −0.7). The prevalence rates for self-harm and interpersonal violence decreased continuously throughout the period 2004–2014 (APC, −2.7%; 95% CI, −3.5 to −1.9) (Table 2 and Fig. 4).
DISCUSSION
In this study, the trends of mortality and prevalence rates in Korea from 2002 to 2015 were analyzed in 21 cause clusters. This analysis of mortality and prevalence in Korea indicated an overall decreasing trend in the age-standardized mortality rates and increasing trend in the age-standardized prevalence rates between 2002 and 2015 for all causes combined. The decrease in age-standardized mortality rates was due to increasing life expectancy, creating a social atmosphere for health improvement, and the establishment of a national health care system. The number of patients due to NCDs continued to increase from 2002 to 2015. The increases in the age-standardized prevalence rates were due to increases in the prevalence of NCDs. In Korea, the number of people with NCDs continues to increase,14 thus increasing the socioeconomic burden. In particular, the burden of NCDs is expected to continue to rise due to the increase in the elderly population. Thus, preventive management policies for NCDs are needed.
Among the CMNNs, the prevalence rate of HIV/AIDS and tuberculosis has been declining since 2006, which was seen as an effect of the continued decline in the prevalence of tuberculosis in Korea; the number of tuberculosis patients in Korea has decreased by an average of 6.6% per annum over the last 5 years.15 However, the number of new infections of HIV/AIDS in Korea has continued to rise,16 and the prevalence of tuberculosis is still high compared to other OECD member countries; therefore, it requires continued management.17
In NCD analysis, the mortality rates of cancer and cardiovascular and circulatory diseases, which are major causes of death in Korea, tended to decrease sharply over the study period. However, while the mortality rate for all diseases in the NCD group has decreased, the mortality rates for neurological disorders has increased since 2005, with stroke making a significant contribution. Globally, the number of deaths from neurological disorders increased by 36.7% between 1990 and 2015.18 This is due to the increased numbers of people and the aging of society, which increases the burden of neurological disorders, although the age-standardized mortality rate has decreased significantly. As the number of elderly people continues to rise in Korea,19 the mortality rate of neurological disorders is expected to continue to rise. Therefore, neurological disorders are an important cause of death around the world, and as mortality rates continue to rise in Korea, health policy makers and healthcare providers must be aware of these trends to provide appropriate services. Although the death rate associated with neurological disorders in Korea is still low, the continuous increasing trend in mortality in this country remains a concern.
The prevalence rates for transport injuries have decreased since 2007. Although the decreasing trend of prevalence rates continues due to continuous efforts to prevent traffic accidents and improve public awareness of compliance with laws and regulations, efforts to reduce deaths from traffic accidents across the nation are still lower than in major OECD member countries.20 To date, Korea has invested about 1.3 trillion Won in transportation safety and implemented various road traffic safety projects every year. Until recently, however, the number of traffic accidents and the gap in traffic safety level has not decreased compared to other countries.21 Therefore, it is necessary to reevaluate the effectiveness of the existing major road traffic safety projects as policy measures and to seek measures for improvement to ensure more efficient implementation of the budget. In addition, it is necessary to strengthen public relations and education for children and senior citizens in kindergarten and institutions for the elderly to prevent transport injuries.
Finally, the mortality rate associated with self-harm and interpersonal violence rose until 2011, but has since changed to a declining trend. This trend is related to a change in the suicide rate in Korea, which fell from 31.7 per 100,000 people in 2011 to 25.6 per 100,000 people in 2016. The Korean government is carrying out policies, such as the 1 million Gate Keeper training, as well as a survey of all suicide deaths over 5 years, and 24-hour telephone consultation to prevent suicide, and these efforts seem to have influenced the recent decrease in suicide rate. However, the number has increased in teenagers and in people in their 20s, and also the incidence of self-harm in the lower socioeconomic groups is on the rise. 22 Therefore, self-injury and interpersonal violence should be investigated and managed separately in socially disadvantaged classes.
This study had a number of limitations. First, the study was conducted over a 13-year period from 2002 to 2015. A maximum of one joinpoint was allowed due to the short period of the study. A short-term trend is prone to random variation, so further studies over a longer period would provide clearer results regarding the disease trends. Second, in this study, 206 mutually exclusive diseases and injuries in Korea were divided into 21 cause clusters, and the trends of age-standardized mortality and prevalence rates were examined. As they were analyzed with disease-cause clusters, there were limitations in analyzing the trends of each individual disease. Further disease-specific studies are needed to investigate these trends. Despite these limitations, this study measured the mortality and prevalence trends of a comprehensive list of diseases in Korea and provided important implications. We expected the results of this study to be used as an important resource to establish appropriate disease prevention and health interventions.
 XML Download