

 PDF
PDF ePub
ePub Citation
 Print
Print


INTRODUCTION
The prevalence of obesity among Korean female adolescents aged 12 to 18 increased from 7.4% in 2008 to 11.3% in 2011 [12]. If metabolic syndrome occurs during childhood and adolescence, the prevalence of the metabolic syndrome is doubled in adulthood and diabetes is tripled [3]. The risk factor for metabolic syndrome is the body mass index (BMI) for both adults and adolescents [4567]. As the BMI increases, the probability of developing metabolic syndrome increases by 1.6 times in boys and 2.3 times in girls, so that adolescent girls are at higher risk for metabolic syndrome than boys [6].
In particular, the female adolescents are likely to have a distorted perception of body type, resulting in excessive weight control [8]. And self-body image satisfaction or body shape perception have a significant influence on eating habits [91011121314]. Girls were more likely to put efforts into losing weight than boys [15]. Also, the correlation between female adolescents' self-esteem and body image was higher than male adolescents' [16]. Adolescents may be interested in weight control in ways that are not desirable, for example, because of misconceptions about their appearance or recognition by peer groups, rather than weight control for health [1718].
Therefore, using the results of the 2010 and 2011 Korea National Health and Nutrition Examination Survey (KNHANES), this study compared biochemical index, nutrient intakes, nutrition label use, diet-related factors and weight control behavior of Korean female adolescents at the age of 12 to 18, concerning the BMI.
MATERIALS AND METHODS
Study subjects
The raw data of the KNHANES in 2010 and 2011 was downloaded and used with the approval for the use of data through the website of the Korea Centers for Disease Control and Prevention. Among the total 11,115 participants in the KNHANES in 2010 and 2011, 561 female adolescents aged 12 to 18 participated in the study.
Research contents
According to the standards of the Korean Society for the Study of Obesity (KSSO) [19] for women aged 12 to 18, the BMI under 18.5 kg/m2 was classified as ‘underweight,’ 18.5 kg/m2 to 22.9 kg/m2 as ‘normal,’ 23 kg/m2 to 24.9 kg/m2 as ‘overweight,’ and over 25 kg/m2 as ‘obese.’ As a health index, the BMI, waist circumference (WC), blood pressure (BP), fasting blood glucose, serum total cholesterol, low-density lipoprotein cholesterol (LDL-C), high-density lipoprotein cholesterol (HDL-C), and triglycerides were compared. Energy and nutrient intake were calculated by the ratios of 2010 Dietary Reference Intakes for Koreans (KDRIs) in adolescents aged 12 to 14 and 15 to 18, which were presented in KDRIs [20]. Also, the results of ‘the subjective body image perception,’ ‘the weight control in a year,’ and ‘the weight control methods’ in the health survey were used. Among the answers to the subjective body image perception, ‘very thin’ and ‘slightly thin’ were classified as ‘normal,’ and ‘slightly obese’ and ‘very obese’ were classified as ‘obese.’ Among the answers to the weight control in a year, except no efforts and non-responses, only the answers of ‘efforts to lose,’ ‘efforts to maintain,’ and ‘efforts to gain’ were compared by the BMI. For the items on the weight control methods, only ‘yes’ or ‘no’ to ‘exercise,’ ‘reduction of food intake’ and ‘skip meals’ were compared according to the BMI, except for non-responses.
The results of breakfast fasting were used among the dietary behavior survey items of the nutrition survey to find out the dietary habits of female adolescents regarding obesity. Among the nutrition knowledge survey items, the experiences of ‘nutritional education,’ ‘nutrition label recognition’ and ‘its use status’ were used. Also, the answers to ‘whether or not to take dietary supplements for more than 2 weeks over the past year’ and ‘the circumstance of your home meals for the last year’ were used.
Statistical analyses
The data analysis was assessed by using statistical program SPSS version 22 (SPSS Inc., Armonk, NY, USA), and complex sample frequency, complex descriptive analysis, complex χ2 analysis and complex linear regression analysis were performed. Since the KNHANES data is a complex sample design, statistical analysis was conducted by taking into account distributed estimation layers, collection extraction variables, and aggregated weights. The frequency (n) and percentage (%) of the data were shown for categorical data, mean ± standard deviation was shown for continuous data, and all statistical significance levels were based on p < 0.05.
RESULTS
Anthropometric measurements and BPs according to BMI in female adolescents
Table 1 shows the breakdown of 561 female adolescents by BMI distribution and the mean BMI for each group. Girls with BMI of 18.5 kg/m2 and below were considered as ‘underweight,’ those between 18.5 kg/m2 and 22.9 kg/m2 were considered as ‘normal,’ those between 23 kg/m2 and 24.9 kg/m2 were considered as ‘overweight,’ and those above 25 kg/m2 were considered as ‘obese’ by KSSO [19]. The mean BMI for female adolescents aged 12 to 18 was 20.9 kg/m2, with 55.9% of the subjects being normal, 9.7% overweight, 11.7% obese and 22.7% underweight.
Table 1
Distribution of obesity in female adolescents

![]()
Table 2 shows the WC and BP of female adolescents based on their BMI. The WC was found to be 60.7 cm in the underweight group, 67.5 cm in the normal group, 75.2 cm in the overweight group, and 84.2 cm in the obese group, indicating that the higher the BMI, the higher the WC was (p < 0.001).
Table 2
WC and BP by BMI of female adolescents

Values are presented as mean ± standard deviation. Values tested by the complex linear regression analysis.
WC, waist circumference; BP, blood pressure; BMI, body mass index.
![]()
Systolic BP was 102.0 mmHg in the underweight group, 104.7 mmHg in the normal group, 104.6 mmHg in the overweight group, and 107.9 mmHg in the obese group. There was a significant difference in systolic BP by BMI (p < 0.01). And there was no significant difference in diastolic BP in relation to obesity.
Biochemical index according to BMI in female adolescents
The results of a biochemical index for female adolescents depending on their obesity are shown in Table 3. There were no significant differences in fasting blood glucose, serum total cholesterol, and LDL-cholesterol depending on BMI. Fasting blood glucose was found to be 87.8 mg/dL in the underweight group, 87.1 mg/dL in the normal group, 89.0 mg/dL in the overweight group, and 92.2 mg/dL in the obese group. Serum total cholesterol was found as 159.1 mg/dL in the underweight group, 162.7 mg/dL in the normal group, 158.4 mg/dL in the overweight group, and 167.6 mg/dL in the obese group. Although the obese group had the highest serum total cholesterol, there was no significant difference depending on the levels of obese. Serum HDL-cholesterol was lower in the higher BMI groups, as 57.3 mg/dL in the underweight group, 56.4 mg/dL in the normal group, 53.9 mg/dL in the overweight group, and 47.9 mg/dL in the obese group, and there was a significant difference for serum HDL-cholesterol (p < 0.001). Regarding serum triglyceride, the underweight group had 75.7 mg/dL, the normal group had 77.1 mg/dL, the overweight group had 90.3 mg/dL, and the obese group had 110.2 mg/dL, which was significant difference by BMI (p < 0.01).
Table 3
Biochemical indexes by BMI of female adolescents

Values are presented as mean ± standard deviation. Values tested by the complex linear regression analysis.
BMI, body mass index; HDL-C, high-density lipoprotein cholesterol; LDL-C, low-density lipoprotein cholesterol.
![]()
Nutrient intake according to BMI in female adolescents
The results of an analysis of the nutrient intake for female adolescents based on their BMI are shown in Table 4. There was no significant difference among the all groups in energy and all nutrient intakes, except carbohydrate. Carbohydrate intake was 326.7 g in the underweight group, and 279.7 g in the obese group, and there was a significant difference among groups (p < 0.05).
Table 4
Nutrient intakes by BMI of female adolescents
Values are presented as mean ± standard deviation. Values tested by the complex linear regression analysis.
BMI, body mass index.
![]()
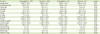
The result of the ratio of nutrient intake compared to the KDRIs [20] are shown in Table 5. Protein, phosphorus, thiamine, and riboflavin met recommended nutrient intake (RNI) for those aged 12 to 14, but calcium, iron, vitamin A, and vitamin C were 52.4%, 88.5%, 94.9%, and 83.8% of RNI. Protein, phosphorus, vitamin A, thiamine, riboflavin, and niacin met RNI for those aged 15 to 18, but calcium, iron, and vitamin C were 53.0%, 63.5%, and 82.1% of RNI. The result showed that calcium was the most deficient nutrient for female adolescents.
Table 5
Nutrient intake ratio compared to KDRIs by BMI of female adolescents
Values are presented as mean ± standard deviation.
KDRIs, Dietary Reference Intakes for Koreans (2010); BMI, body mass index.
*The energy intake ratio represents the intake ratio relative to KDRI's estimated energy requirement, while the intake ratio of the other nutrients represents the intake ratio relative to KDRI's recommended nutrient intake.
![]()
Factors related to dietary life according to BMI in female adolescents
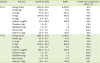
Table 6 compares the female adolescents aged 12 to 18 according to BMI, regarding eating breakfast of the prior day, nutrition education experience, nutrition label recognition, nutrition label use, intake of dietary supplements for more than 2 weeks over the past year, and dietary circumstance. Except for the use of nutrition label, there was no significant difference among the groups depending on the BMI. The nutrition education experience was below 15% in all groups. The recognition rate for nutrition label was over 90% in all groups, and the utilization rate for nutrition label was below 50% in all groups. In particular, the underweight group had the lowest rate for nutrition label use with 28.4%, compared to more than 40% of normal, overweight, and obese groups, which was a significant difference (p < 0.05). In the past year, there was no significant difference in dietary supplements intake by obesity. More than 90% of all groups answered that their dietary circumstance was sufficient.
Table 6
Diet-related factors by BMI of female adolescents
![]()
Subjective body image perception and weight control according to BMI in female adolescents
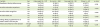
Table 7 shows the results of subjective body image perception and weight control effort according to BMI. Subjective body image perception was classified as thin, normal, and obese, and 39.9% of the underweight group considered themselves as normal. However, 25.3% of the normal weight group considered themselves as obese, which was a significant difference by BMI (p < 0.001).
Table 7
Self-body images and weight control efforts by BMI of female adolescents
![]()
Over the past year, weight control effort was a significant difference by BMI (p < 0.001). The 18.9% of the underweight group have tried to lose weight and 55.6% have tried to maintain their weight. In the normal group, 71.1% recognized themselves as normal, 25.3% recognized themselves as obese, and 75.3% of those put efforts into weight loss, have tried to lose their weight. Regarding subjective body image perception in overweight and obese groups, 92.8% and 100% of each group recognized themselves as obese, and 85.7% and 92.1% of the female adolescents who said they tried to lose their weight, have tried to lose weight, respectively.
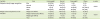
Table 8 shows the methods for weight control in female adolescents. The percentage of those who said they were ‘exercising’ for weight control was the highest in the underweight group, and the lowest in the obese group, which was significant by BMI (p < 0.05). There were no significant differences concerning BMI for ‘reduction of food intake’ and ‘skip meals’ as weight control methods, but the underweight group showed the highest tendency to answer ‘yes’ on ‘reducing diet’ and ‘skip meal’. In this study, 42.2% of the actual underweight students considered themselves as ‘normal’ or ‘obese’ and 25.3% of female adolescents with normal BMI considered themselves as ‘obese.’
Table 8
How to control weight by BMI of female adolescents

![]()
DISCUSSION
Among the study subjects, 9.7% were overweight, and about 11.7% were obese. This obesity rate was higher than 15.2% of female adolescents in Korea National Health Statistics of 2008 [1] that indicates an increase in obesity rates in 3 years, of 2010 and 2011. In this study, the obese group was the most disadvantageous group concerning WC, systolic BP, blood triglycerides and blood HDL-cholesterol, and there were significant differences by BMI. These factors are metabolic syndrome risk factors [2122]. In this study, the serum triglyceride in the obese group was found to be 110.2 mg/dL, which is similar to 110 mg/dL of triglyceride of the metabolic syndrome criteria of Cook et al. [21]. Serum HDL-cholesterol level of the obese group was significantly lower than other groups (p < 0.001), as 47.9 mg/dL, but higher than 40 mg/dL of HDL-cholesterol of the metabolic syndrome criteria of Cook et al. [21]. Criterion of Cook et al. [21], WC and BP criteria used above the 90th percentile of gender and age, followed as below 110 mg/dL of fasting blood glucose, below 40 mg/dL of HDL-cholesterol, and above 110 mg/dL of triglyceride. Regarding criterion of Ford et al. [22], WC, BP, triglyceride, and HDL-cholesterol criteria were the same as criterion of Cook et al. [21], and in fasting blood glucose criterion, the 2 criteria of 110 mg/dL and 100 mg/dL were used [22]. Regarding WC and BP, when there are 3 or more applicable criteria as above the 90th percentile of each gender and age, it can be determined as metabolic syndrome. The fasting blood glucose was higher in the obese group as 92.2 mg/dL, but it was lower than the metabolic syndrome standard, 110 mg/dL or below of Cook's criterion [21].
According to the 2011 Korea National Health Statistics [2], for women aged 10 to 18, the mean of fasting blood glucose was 88.2 mg/dL, the mean of total cholesterol was 162.5 mg/dL, and the mean of triglycerides was 85.2 mg/dL. However, the means for the obese group were higher as followed, 92.2 mg/dL for fasting blood glucose, 167.6 mg/dL for serum total cholesterol, and 100.2 mg/dL for serum triglycerides, respectively. Even though the biomarks of the obese group are within normal range for metabolic syndrome [2122], their results are still higher than the normal group. Thus as earlier studies also suggest, it seems that the risk of metabolic syndrome in the obese group is higher than in the normal group.
According to the analysis of 469 male and female adolescents in the 2016 KNHANES, among the 5 diagnostic components of metabolic syndrome; WC, BP, fasting blood glucose, serum triglyceride, and HDL-cholesterol, the risk factors of metabolic syndrome for Korean adolescents are mainly reported to be abdominal obesity, hypertriglyceridemia, and low HDL-cholesterol [4]. According to the analysis of children and teens aged 10 to 18 using the 2008 KNHANES, the obese group had significantly high prevalence in hypertension, low HDL-cholesterol, hypertriglyceridemia, and abdominal obesity [5]. Cho [23] reported that metabolic syndrome risk factors were more affected by BMI than body shape index in Korean adolescents. In female adolescents 12 to 18 years old, the BMI was significantly correlated with WC, serum HDL-cholesterol and triglyceride, while in female adolescents 15 to 18 years old, the BMI was significantly correlated with fasting blood glucose [23]. In this study, the obese group with a high BMI also had significantly lower HDL-cholesterol and significantly higher serum triglyceride.
In the prior research for adolescents [24], there was no significant difference of energy intake among the normal weight group, the obese group, and the metabolic syndrome obese group, and there was no significant difference of energy intake among the underweight group, the normal group, the overweight group, and the obese group in this study as well. And in the study by Nam and Choi [5] of adolescents aged 10 to 18 using the 2008 KNHANES, there was no significant difference in energy and nutrient intake between the normal group and the metabolic syndrome group. Even among students aged 7 to 19, there was no significant difference in energy intake between the obese group and the normal weight group [24].
However, the results of the nutrient intake analysis in this study suggest that it is difficult to represent the everyday eating habits of the subjects since it is a result of a one-day survey of each person. In earlier study, the ratio of underestimation of food or energy intake increased with obesity and desire for weight loss was associated with underestimate both among overweight and normal weight subjects [25]. Considering that 80% of overweight and obese groups in this study showed they have tried fasting for weight control. So, results of this study could consider that attitudes about female adolescent's own body weight may influenced reported food or energy intake.
Calcium intake was 471.6 mg for those aged 12 to 14, which is 52.4% for the RNI, and 424.1 mg for those aged 15 to 18, which is 53.0% for the RNI. The similar results were found in the study by Bae [26] using the 2010–2012 KNHANES, which showed that 473.7 mg of calcium intake for girls aged 12 to 14 and 432.1 mg for girls aged 15 to 18, that are similar to the results of this study, and it suggests that calcium is the most deficient nutrient by RNI. The results revealed that the prevalence of calcium deficiency is high in female adolescents.
Eating breakfast, experience of nutrition education, recognition of nutrition label, use of dietary supplements over the past year, and dietary circumstance were not significantly different in relation to BMI. There was no significant difference in the awareness of ‘nutrition label,’ but there was a significant difference in ‘use of nutrition label’ (p < 0.05), as the use rate of nutrition label in the normal, the overweight and the obese groups were 1.5–1.7 times higher than the underweight group. This result suggests that it is related to the higher rates of answers for efforts to lose weight in the ‘weight control over the past year’ question in the overweight and the obese groups, compared to the lower rates of the answers in the underweight and the normal groups. The recognition rate for nutrition label was more than 90%, but it was found to be less than 50% for nutrition label utilization rate, and the experience rate of nutrition education was found to be less than 15% for all subjects. Overall, it is necessary to strengthen nutrition education.
Overweight adolescents were regarded as obese weight, and normal adolescents were considered as overweight, the overestimation of body weight may induce the motivation to lose more weight. In this study, 25.3% of the normal group thought they are obese, and 75.3% of female adolescents have tried to lose weight in the normal group, among those who had experience with weight control. Also, in the underweight group, when they put efforts for weight control, the ‘weight loss efforts’ was 18.9%. In previous research, the subjective body recognitions were worse for female students than male students, as they perceived themselves as obese even though they aren't [15]. And Choi et al. [8] reported that, for the rates that recognizing oneself as obese even if he or she is not, are higher in the female underweight group than the male one, and it was the same for the normal groups as well. Choi et al. [8] also showed that there was a higher abnormal recognitions of subjective body image in the normal groups, which is consistent with the results of this study. In previous research, perceptions of overweight and attempts to lose weight were highest in the group of university students in Asian countries where body weights are generally low. And more women than men felt they were overweight [14]. According to Bellisle et al. [27], who studied 16,486 university students in 21 countries, in spite of the low BMI, many students perceived themselves as overweight, especially women. Trying to lose weight (44% of women, 17% of men) and dieting (14% in women, 3% in men) were not uncommon [27]. Among the weight control methods, fasting was the highest as 80% in all groups, compared to exercise and reducing diet.
Female adolescents' self-perceptions of body weight can be influenced by their peers who misperceive their body weight, especially with the overestimation of their normal weight at school. Therefore, it implies that not only education on proper subjective body image perception, but also education on proper weight control methods and nutrition label are necessary for the overall health care of people.
CONCLUSION
In this study, the systolic BP of the female obese group was higher than the normal group (p < 0.01), and the obese group had low HDL-cholesterol (p < 0.001) and high triglyceride (p < 0.01), which indicates a high risk for metabolic syndrome. In the nutrient intake, calcium was the most deficient nutrient for female adolescents. The nutrition label recognition rate was higher than 90%, but its use rate was lower than 50%, which demands more nutrition education. In the underweight and the normal groups, 25.3% perceived themselves as obese, and 75.3% of the normal group engaged with efforts for reducing weight rather than efforts for maintaining weight. On the other hand, considering that the proportion of female adolescents who said they had no experience of nutrition education exceeded 80% in all 4 groups, active and effective nutrition education is necessary for female adolescents at the school level for healthy weight, proper weight control, improvement of body type recognition, and education for calcium intake.
 XML Download