

 PDF
PDF Citation
 Print
Print


BACKGROUND
Exposure to green space has been closely linked to various health outcomes such as birth weight, mental health, allergic diseases, type 2 diabetes, and cardiovascular disease [12345]. According to a recent report from the World Health Organization, exposure to greenness can benefit health either directly or indirectly through a variety of mechanisms and their synergies [6]. Greenness can improve mental and physical health by reducing psychological stress, depression, air pollution, and noise, along with increasing social contacts and physical activity. Enhanced immune functioning is also one of the important pathways linking green spaces to health [7]. However, these advantages of nature are not shown in all health outcomes.
For example, the literature on the association of green space with allergic conditions is inconsistent. A number of studies have reported that exposure to greenness is inversely associated with allergic diseases in children and adolescents [89101112]. In contrast, other studies have observed positive associations between greenness and risk of allergy-related symptoms in children [2131415]. Some of this inconsistency in the study of children may be explained by 2 largely independent mechanisms, namely the biodiversity hypothesis and pollen from a variety of plants or trees. Early-life exposure to green space can improve the diversity and abundance of microbiota, thereby leading to enhanced immune function at an early age [9]. On the other hand, green vegetation can stimulate allergic reactions and increase the risk of developing allergic disease through fungal spores and many different types of pollens [15]. Consequently, the conflicting effects of greenness on allergies remain an issue.
To date, association studies of the role of greenness in allergy-related conditions have focused primarily on children or adolescents. However, as with children, the adult population has a high prevalence of allergic disease, with a prevalence rate of more than 20% for allergic rhinitis [16]. In the case of persistent allergic rhinitis and contact dermatitis, the prevalence in adults is even higher than in children [17]. Indirect health impacts via increased physical activity in green areas may be more important for children than adults. Nevertheless, there is little published evidence on the effects of greenness on allergic diseases in adults. In addition, few studies on greenness and allergic disease have been performed in Asian populations. Therefore, this study aimed to investigate the associations of greenness with allergic diseases in Korean adults.
METHODS
Subjects
The data used for this study were obtained from the 2009 Korea Community Health Survey (KCHS) (https://chs.cdc.go.kr/chs/index.do), which was conducted by the Korea Centers for Disease Control and Prevention [18]. Briefly, the KCHS, which is a nationwide community-based survey, was initiated in 2008 to evaluate health comprehensively at the community level and to provide evidence-based disease prevention programs and health promotion services. In total, 230,715 adults were interviewed in 2009. Of these, we excluded 11,417 samples that inaccurately responded to the allergy-related questions or questions for interest variables including age, sex, education, and physical activity. Therefore, a total of 219,298 adults were included in the study.
Allergy-related conditions
Individuals' allergy-related conditions were obtained through self-reporting of atopic dermatitis and allergic rhinitis, which were respectively assessed by 2 questions on physician diagnosis and current treatment: 1) Have you ever been diagnosed with atopic dermatitis or allergic rhinitis by a physician? 2) Are you currently being treated for atopic dermatitis or allergic rhinitis? Subjects responded as dichotomous variables (“yes” or “no”).
Assessment of green areas
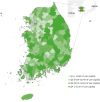
The KCHS data did not include the actual addresses of the subjects, which would be required to estimate the level of individual exposure to green space. Therefore, we assessed the amount of green areas using an alternative approach wherein an identical level of exposure was assigned to individuals living in the same administrative area. We obtained the 2009 data from the KOrean Statistical Information Service (KOSIS), which contain information regarding the amount of green areas (m2) per capita in 200 administrative regions, including cities and counties (KOSIS, 2009). The green areas reported by the KOSIS included forests, parks and reserves, greenness, greenways, and riparian areas. The geographical codes for the study participants were all matched on the basis of the amount of green areas in each administrative region. The size of administrative region ranged from 33 km2 to 1,819 km2, and its mean was 623.15 km2. The distribution is presented in Fig. 1.
Variables of interest
For the associations between green areas and allergic disease, we also investigated variables of interest, including basic characteristics. Several variables, such as age, sex, marital status, education, monthly income, job, cigarette smoking, alcohol drinking, stress, and moderate activity were assessed using a questionnaire. Job categories included: 1) white-collar jobs (e.g. general office workers or managers), 2) blue-collar jobs (e.g. mechanics, builders, factory employees, or construction, firefighting), 3) pink-collar jobs (e.g. healthcare, nursing, floristry, salespersons, teaching assistant, child care), 4) military jobs including professional soldiers, and 5) no economic act (e.g. students or unemployed individuals). In addition, Moderate physical activity was defined as moderate-intensity activities (i.e., leisure sports, including swimming, tennis, volleyball, badminton, and ping-pong, etc.) of more than 10 minutes at least a day per week. Body mass index (BMI) was estimated as weight in kilograms divided by the square of the height in meters (kg/m2). In addition, the residential regions of the subjects were divided into 2 categories: urban and rural. These variables of interest were considered as covariates for each model.
Statistical analysis
The KCHS accounted for the population-based and representative nature of the sample using individual weights. First, the household weights were calculated so that the participating households represented all the whole households, and the individual weights were estimated by reflecting the individual response rate in the household weights. Next, the individual weights were adjusted for sex and age, based on the resident population so that the sample represented the total population. Before analyses, we checked the normality of the distribution of green areas. As a result, the distribution did not follow normality. To alleviate the problem of the skewed distribution of green areas, we converted values of green areas with a log2 transformation. Although the resulting distribution was closer to a normal distribution than the distribution of the raw values of green areas, it still did not completely follow a normal distribution. Therefore, we additionally performed quartiles analysis by dividing the distribution of green areas into 4 levels: quartile 1 (≤ 14.90 m2/capita), quartile 2 (14.91–22.40 m2/capita), quartile 3 (22.41–33.30 m2/capita), and quartile 4 (≥ 33.31 m2/capita). The associations between green areas and allergic disease were evaluated using logistic regression analysis, and we estimated odds ratios (ORs) and 95% confidence intervals (95% CIs) in green areas for atopic dermatitis or allergic rhinitis. In quartiles analysis, quartile 1 of green areas (the lowest level) was used as the reference level. In total, 5 statistical models were estimated by adjusting for covariates. In addition, we performed the mediation analysis by stratifying moderate physical activity. All statistical analyses were performed using SAS 9.2 (SAS Institute, Cary, NC, USA).
RESULTS
The basic characteristics of the study population are shown in Table 1. The mean age of the subjects was 49.37 years, and the proportion of female (52.9%) was slightly higher than that of male (47.2%). Most of the subjects were married (71.7%) and about 43% of the subjects were graduated from middle-high school. The percentage of people who did not involve economic activities was the highest (38.1%), followed by blue-color workers (29.2%). The proportion of current smokers and drinkers were 24.2% and 51.0%, respectively. The proportion of people engaged in moderate physical activity was 29.4%, and about 26% of subjects were highly stressed. The proportion of people living in rural (54.0%) was slightly higher than that in urban (46.0%). The mean BMI of the subjects was 22.95 kg/m2.
Table 1
Characteristics of study population
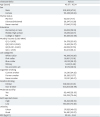
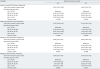
Table 2 provides the ORs (95% CI) for atopic dermatitis by green areas level according to adjustment models. In the case of self-reported atopic dermatitis based on physician diagnosis, the highest level of green areas was significantly associated with decreased risk of atopic dermatitis (OR in quartile 4, 0.82; 95% CI, 0.73–0.91, Model 4). As green areas increased, the risk of atopic dermatitis was gradually decreased (p-value for trend < 0.0001, all adjustment models). Likewise, high levels of green areas were significantly associated with a decreased risk of atopic dermatitis based on self-reports of current treatment (OR in quartile 4 = 0.77; 95% CI = 0.64–0.92, Model 4). For 2 times increase in green areas, the adjusted ORs (95% CI) for atopic dermatitis were 0.94 (0.90–0.98) in the physician's diagnosis and 0.92 (0.85–0.99) in current treatment, respectively (Model 4), which were statistically significant.
Table 2
Prevalence odds ratio (95% confidence interval) for atopic dermatitis by the level green areas

Model 1 was adjusted by age, sex, marriage, education, monthly income, and job categories; Model 2 was further adjusted for smoking and alcohol; Model 3 was further adjusted for physical activity and self-reported stress; Model 4 was further adjusted for urbanity and body mass index.
aTrend p-value was estimated based on the Wald statistics.
The logistic regression results (95% CI) for allergic rhinitis were given in Table 3. These were similar to those of atopic dermatitis. Compared with the lowest level of green areas (quartile 1), the highest level (quartile 4) showed decreased risks of allergic rhinitis in adjustment models. In the full covariate model (model 4), the ORs (95% CI) of allergic rhinitis based on physician diagnosis and current treatment were 0.94 (0.89–0.99) and 0.91 (0.82–1.00), respectively. As green areas increased, the risk of allergic rhinitis was gradually decreased (p-value for trend < 0.05, all adjustment models except for Model 3 in current treatment). Unlike atopic dermatitis, the adjusted ORs (95% CI) per 2 increases in green areas for allergic rhinitis based on the physician's diagnosis and current treatment were not significant in full covariate model (model 4).
Table 3
Prevalence odds ratio (95% confidence interval) for allergic rhinitis by the level of green areas

Model 1 was adjusted by age, sex, marriage, education, monthly income, and job categories; Model 2 was further adjusted for smoking and alcohol; Model 3 was further adjusted for physical activity and self-reported stress; Model 4 was further adjusted for urbanity and body mass index.
aTrend p-value was estimated based on the Wald statistics.
The association results stratified by moderate physical activity were indicated in Table 4. When moderate physical activity was classified into 2 groups (yes or no), the group with moderate physical activity (yes) showed a more beneficial impact from green areas on atopic dermatitis than the moderate physical inactivity group (no). In the results for 2 times increase in green areas, the adjusted ORs (95% CI) for atopic dermatitis based on physician diagnosis and current treatment were 0.90 (0.83–0.98) and 0.79 (0.68–0.91). However, no association between green areas and atopic dermatitis was observed in the moderate physical inactivity group. In the results for the quartiles of green areas, the group that participated in moderate physical activity (yes) had lower ORs for individuals with atopic dermatitis than the group that did not participate in physical activity (no). Compared with the lowest quartile for green areas (quartile 1), the adjusted ORs (95% CI) in the 4th quartile for atopic dermatitis based on physician diagnosis and current treatment were 0.70 (0.58–0.85) and 0.56 (0.41–0.77) in the moderate physical activity group (yes) and 0.76 (0.67–0.86) and 0.76 (0.62–0.93) in the moderate physical inactivity group (no). However, the association between green areas and allergic rhinitis according to the moderate physical activity had no clear pattern.
Table 4
Prevalence odds ratio (95% CI) for atopic dermatitis and allergic rhinitis by the level of green areas, stratified by moderate physical activity
DISCUSSION
This study investigated the associations between green areas and allergic diseases such as atopic dermatitis and allergic rhinitis in Korean adults. Our results showed the protective effects of green areas on atopic dermatitis and allergic rhinitis. The risk of atopic dermatitis in the highest level of green areas was significantly higher compared with the lowest level of green areas (OR in quartile 4, 0.82; 95% CI, 0.73–0.91, Model 4). Similarly, a high level of green areas was significantly associated with a decreased risk of allergic rhinitis (OR in quartile 4 = 0.94; 95% CI = 0.89-0.99, Model 4). In addition, the group that participated in moderate physical activity (Yes) had lower ORs for individuals with atopic dermatitis than the group that did not participate in physical activity (No), suggesting that moderate physical activity is a potential mediator for this association. The current study supports the previous evidence that greenness has an effect in a protective direction against allergic diseases [891112].
To date, several studies have reported associations between greenness and allergy-related conditions such as asthma and rhinitis in children or adolescents. However, results have been inconsistent. In 2008, Lovasi et al. [19] first reported that street trees in New York city were significantly associated with a lower of childhood asthma (≤ 15 years old). In 2009, a large-scale epidemiological study based on the Dutch population also identified that the annual prevalence rate of asthma was lower in people who have 10% more green area than average in a 1 km radius around their home [20]. In 2014, Lynch et al. [10] suggested that concomitant exposure to high levels of certain allergens and bacteria in early life might be beneficial. Furthermore, recent studies reported by Hanski and colleagues [9] demonstrated the environmental biodiversity hypothesis regarding atopy, showing the inverse relationship between the amount of forest and agricultural land around the home and atopic sensitization in children [11]. In addition, Sbihi et al. [12] reported the beneficial effects of surrounding greenness on asthma in preschool-age children. In contrast, there is evidence of the harmful effects of greenness on allergic diseases. In 2012, one association study based on asthmatic children aged 4–12 years in south-central Massachusetts, Connecticut, and New York state reported that asthmatic symptoms were closely related to ambient exposure to all-type pollen, as well as grass, tree, and weed pollen [21]. Similarly, in 2013, the results from a birth cohort based in New York city (population of African-American and Dominican families) showed that the tree canopy coverage in urban areas significantly increased the risks of asthma, any specific allergic sensitization, and allergic sensitization to tree pollen at 7 years of age [15]. In 2014, Dadvand et al. [2] also demonstrated that residential proximity to parks was significantly associated with an increased prevalence of current asthma or allergic rhinoconjunctivitis in schoolchildren aged 9–12 years in Sabadell of Spain. Interestingly, Fuertes's study [8] performed in 2 areas (GINI/LISA South and GINI/LISA North) of Germany reported heterogeneous association results between greenness and allergies across study areas despite applying identical study methods in both areas. In recent, they reconfirmed their heterogeneous result according to the area in seven birth cohort data from Swedish (BAMSE), Australian, (MACS), Dutch (PIAMA), Canadian (CAPPS and SAGE), and German (GINIplus and LISAplus), identifying that the effect direction of residential greenness related to allergic rhinitis and aeroallergen sensitization varies by study location [14]. In addition, Andrusaityte et al. [13] found that greenness was related to an increased relative risk of asthma in preschool children. This inconsistency regarding greenness effects on allergic diseases may be partially explained by different methodologies such as survey area, study participants' characteristic (i.e., age and ethnicity), and greenness exposure assessment. Differences in the typical structure of country-specific green systems may also explain such discrepancies.
This is the first report to investigate the associations between green areas and allergic diseases (i.e., atopic dermatitis and allergic rhinitis) in Asian adults. Most studies of effects of residential greenness on allergic diseases have focused primarily on children and adolescents in Europe. Thus, this study provides valuable evidence for the protective effects of greenness on allergic diseases in Korean adults, when considering the high prevalence of allergic diseases in adults. The beneficial effects of early-life exposure to green space on allergic diseases have been mostly regarded as the exposure effect of various environmental microbiota influencing an immune response (i.e., the biodiversity hypothesis) [11]. Although there is no direct evidence showing that the adult immune system can be reprogrammed by the environment, our significant findings in adults may be interpreted based on several indirect sources of evidence in the literatures. The greenness effects may be mediated via the benefits of reduced sedentary behaviors. In our data, moderate activity was a potential mediator for association between green areas and atopic dermatitis. It is well known that physical activity or leisure activity is strongly related to decreased allergic symptoms [2223], even though severe or high-intensity exercise in specific elite athletes, including swimmers, has been reported to induce atopic-related symptoms [2425]. In addition, green space may reduce air pollution, thereby resulting in a decreased risk of atopic dermatitis or allergic rhinitis. Greenness can improve air quality by several mechanisms, including the air-filtering effect of plants [26272829]. A number of studies have shown that air pollution was associated with the prevalence of allergy-related conditions including atopic dermatitis and allergic rhinitis [303132]. However, further studies are needed to verify these hypotheses in the inverse relationship between greenness and allergic disease in the adult population.
The first major limitation is that we did not measure the subjects' exposure length of green areas. Because of the unavailability of home address data, we could not measure the number of surrounding green areas within a specific buffer zone around the home of each subject. Instead, this study used the amount of green spaces per capita in a semi-ecological design that assigned the same level of exposure to all participants living in the same administrative region. However, this design may not take into account the independence of resident individuals within the same administrative district. Second, this was cross-sectional study, and it is thus impossible to assign causality between the amount of greenness per capita and the development of allergic diseases. Third, in our results, it is difficult to rule out the possibility of uncontrolled confounding by socioeconomic status, the onset of allergic disease during childhood, and air pollution, as well as self-selection bias (i.e. healthier people move in places with more green areas). Fourth, this study used the self-report data to assess individuals' allergy-related conditions. Compared to medical records, self-report data have several strengths in that they are relatively less expensive, less time-consuming, and easier. However, this method may not only misinform by faulty memory, but also be distorted by self-deception in case of sensitive topics. Thus, our data needs to be interpreted carefully. Fifth, our study could not identify impact of early-life exposure to green space for supporting previous theory (i.e. the biodiversity hypothesis), because of unavailability of data. Lastly, the links between greenness and allergic diseases in our study may be different from the association of natural forests and human-created green areas with allergic diseases. However, we could not confirm the effects between them, because of the absence of separate data on artifacts and natural greenness.
CONCLUSIONS
This study aimed to identify associations between greenness and atopic dermatitis or allergic rhinitis in an adult population. Our findings provide evidence that green areas are significantly associated with allergic disease such as atopic dermatitis and allergic rhinitis in Korean adults, showing significant effects in a protective direction.
 XML Download