

 PDF
PDF Citation
 Print
Print


BACKGROUND
Tobacco is one of the leading causes of death and the single most preventable cause of death [1]. In each year, more than 8 million deaths in people are caused by direct or indirect tobacco use. Surveillance and monitoring are important for tobacco use cessation, and tobacco users need proper helps to quit smoking [2]. Accurate survey of smoking status is essential for controlling tobacco use. Currently, the main tools for investigating smoking status are self-report smoking questionnaires. The main disadvantage of self-reported smoking status is the possibility that the subjects' responses are invalid [3].
The previous study on the validity of self-reported smoking status was conducted mainly on non-worker groups such as general population, women, adolescents, and participants in smoking cessation programs [45678910]. Research and management of smoking for the general publics is important, but it is also critical to control smoking for workers who are occupationally exposed to harmful substances. Especially, firefighters are exposed to various toxic gases (carbon monoxide, cyanide, nitric acid gas, ammonia) and carcinogens (arsenic compounds, asbestos, benzo-pyrene, cadmium) in their occupational environment [1112]. The International Labour Organization reported that the incidence rates of aortic aneurysm, cancer of the genitourinary tract, brain cancer, and acute lung disease are higher in firefighters than in the general population [12]. The International Agency for Research on Cancer has announced that firefighting can increase the risk of developing 3 types of cancers: testicular cancer, prostate cancer, and non-Hodgkin's lymphoma [11]. Meta-analysis reported a positive association with firefighting in colorectal cancer, melanoma, bladder and kidney cancer [13].
In Korea, a medical checkup is conducted every year for firefighters. One of the purposes of this medical checkup is providing health education to prevent disease [14]. In order to provide proper anti-smoking education and to select subjects for the smoking cessation program, an accurate smoking status survey is prerequisite. If firefighters' responses on smoking questionnaires are not valid, then other methods are needed for investigating smoking status in firefighters.
In this study, the validity of firefighters' responses on smoking questionnaires was analyzed. Using this data, we evaluated whether self-report smoking questionnaires are appropriate tools for investigating smoking status in firefighters and analyzed factors that affected smoking survey validity.
METHODS
Subjects and data selection
This study was conducted on 445 male firefighters from 9 fire stations in Daegu (the city in South Korea) who visited a medical institution for a medical checkup in 2016. Information about general characteristics (e.g., age, tobacco use, exercise, alcohol consumption), working duration, and medical history was obtained from self-report questionnaires provided during the medical checkup. Body mass index (BMI, kg/m2) was calculated from measurements of height and weight.
Age was classified as 20–29, 30–39, 40–49, and ≥ 50 years. Working duration was classified as 9 years or less, 10–19 years, or 20 or more years. Exercise habits were classified as proper (≥ 3 times/week) or improper (≤ 2 times/week). Alcohol consumption was classified as proper (≤ 2 cups/day on average) or improper (> 2 cups/day on average). Subjects were classified as self-reported current smoker and self-reported current non-smoker according to the self-reported smoking status. Self-reported current smokers were the subjects who responded to the survey that they have smoked more than 100 cigarettes in their lifetime and are still smoking. Self-reported current non-smoker was a classification that includes self-reported ex-smokers and self-reported non-smokers. Self-reported ex-smokers were the subjects who responded to the survey that they have smoked more than 100 cigarettes in their lifetime, but currently do not smoke. Self-reported non-smokers were the subjects who answered “no” when asked if they have ever smoked more than 100 cigarettes in their life. Information about histories of hypertension, diabetes, dyslipidemia, stroke, or heart disease was obtained from the past medical history section of the self-report questionnaires. BMI was classified as underweight/normal (BMI < 23.0), overweight (23.0 ≤ BMI < 25.0), or obese (BMI ≥ 25.0) according to the World Health Organization's BMI classification for adult Asians [15].
Urine cotinine test
Cotinine is one of the widely used biochemical markers for detecting tobacco use. Cotinine can be measured in bodily fluids, such as urine, blood, or saliva [1617]. In this study, the COT One Step Cotinine Test Device (DCT-102; CLIAwaived Inc., San Diego, CA, USA), a qualitative test tool which results are displayed as positive or negative, was used for the urine cotinine test. This device is a urine cotinine test strip in cassette format based on immunoassay. The cut-off value of device used in this study was 200 ng/mL. Urine samples were collected in a clean and dry sample collection bottles and stored in a sample storage refrigerator that maintained at 4°C–5°C. The urine cotinine tests were conducted within 24 hours of sampling and were performed at room temperature. Using a pipette, the 2–4 drop of urine specimens was applied to the device placed on a clean surface, and the results was read after about 5 minutes [1819].
Validity analysis of the smoking questionnaires
Results from the urine cotinine test were used to assess the validity of self-reported smoking status on smoking questionnaires. Subjects who tested positive for urine cotinine test were assumed to be actual current smokers and subjects who tested negative were considered to be actual current non-smokers. To assess the validity of the smoking questionnaire, self-reported smoking status was compared to the result of the urine cotinine test. The sensitivity, specificity, positive predictive value (PPV), and negative predictive value (NPV) of the smoking questionnaire were analyzed and compared to subjects' characteristics. Additionally, subjects' characteristics associated with a discrepancy (misclassification) between self-reported smoking status and the results of the urine cotinine test were analyzed.
Since it is important to check the misclassification of actual current smokers as current non-smokers (non-smoker or ex-smoker) by self-report, subjects with positive urine cotinine test results (considered to be actual current smokers) were selected. Characteristics of these subjects were analyzed to identify their relations to misclassification (false negative on smoking questionnaires).
Statistical analysis
Statistical analysis was performed using SPSS version 22.0 for Windows (IBM corp., Armonk, NY, USA) A χ2 test was used to analyze whether subjects' characteristics were associated with self-reported smoking status or urine cotinine verified smoking status. The nonparametric Mann-Whitney and Kruskal-Wallis tests were used to analyze the validity (sensitivity, specificity, PPV, NPV) of smoking questionnaires according to subjects' characteristics. In all subjects and cotinine verified actual current smokers, the χ2 test was used to analyze the misclassification status according to the subject's characteristics. A logistic regression analysis was performed with the subjects' characteristics as independent variables and the misclassification status as a dependent variables.
RESULTS
Self-reported smoking status and the results of urine cotinine test compared to subjects' characteristics
Subjects' information obtained from urine cotinine test results and self-reported questionnaires are shown in Table 1. The average age was 40.12 ± 8.84 years and the average working duration was 11.91 ± 9.03 years. On self-reported smoking questionnaires, the self-reported current smoking rate was calculated as 22.5% (n = 100), a proportion of self-reported ex-smokers as 28.8% (n = 128), and a proportion of self-reported non-smokers as 48.8% (n = 217).
Table 1
Association of the self-reported smoking rate and actual smoking rate with subjects' characteristics
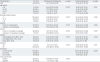
Values are presented as percentage (95% CI). The p-value calculated by χ2 test.
BMI: body mass index; CI: confidence interval.
aActual smoking rate defined by urine cotinine test (positive means actual current smoker, negative means actual current non-smoker); bMean p-value is statistically significant; cDiseases include hypertension, diabetes, dyslipidemia, stroke, and heart disease.
![]()
Urine cotinine test results classified 51.2% (n = 228) of total subjects as actual current smokers and 48.8% (n = 217) as actual current non-smokers. Self-reported smoking rates showed significant differences according to age, working duration, alcohol consumption, presence of disease, and results of the urine cotinine test. Smoking rate measured by the urine cotinine test showed significant differences with reference to alcohol consumption and self-reported smoking status. In the 228 subjects classified as actual current smokers by the urine cotinine test, only 42.98% (n = 98) responded that they were current smokers on self-report smoking questionnaires. 55.47% (n = 71) of the 128 self-reported ex-smokers and 27.19% (n = 59) of the 217 self-reported non-smokers tested positive on the urine cotinine test (Table 1).
Validity analysis of self-reported smoking questionnaires
The sensitivity of the smoking questionnaires was 42.98%, the specificity was 99.08%, the PPV was 98.00%, and the NPV was 62.32%. The sensitivity decreased with age and with longer working duration (p < 0.001). The sensitivity in subjects with a history of disease were lower than that in those without a history of disease (p < 0.001). The specificity, PPV, and NPV showed no significant differences according to subjects' characteristics (Table 2).
Table 2
Association of the validity of self-reported smoking status with subjects' characteristics
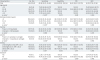
Values are presented as percentage (95% CI).
BMI: body mass index; CI: confidence interval; PPV: positive predictive value; NPV: negative predictive value.
aThe p-value calculated by Kruskal-Wallis test; bMean p-value is statistically significant; cThe p-value calculated by Mann-Whitney test; dDiseases include hypertension, diabetes, dyslipidemia, stroke, and heart disease.
![]()
Analysis of factors affecting misclassification of smoking status on questionnaires
Of the 445 total subjects, 29.66% (n = 132) were misclassified. Misclassification had a significant association with age and working duration. In the 228 subjects classified as actual current smokers by the urine cotinine test, 57.02% (n = 130) were misclassified on the questionnaires. In the actual current smokers, the misclassification increased with age and with longer working duration (p < 0.001). And subjects with a history of disease were more misclassified than those without a history of disease (p = 0.001) (Table 3).
Table 3
Association between misclassification of smoking status by self-report and characteristics in all subjects and actual current smokers
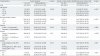
The p-value calculated by χ2 test.
BMI: body mass index; CI: confidence interval.
aMisclassification in actual smoker means false-negative in self-report; bMean p-value is statistically significant; cDiseases include hypertension, diabetes, dyslipidemia, stroke, and heart disease.
![]()
Correlation analysis were performed with the variables of age and working duration. The correlation coefficient (Spearman's rho) was 0.870 for all subjects (p < 0.001) and 0.846 for current smokers (p < 0.001). Because age and working duration were highly correlated with one another, only age was included as an independent variable in logistic regression analysis. In all subjects, the misclassification rate of those in their 30s, 40s and 50s was significantly higher, based on their 20s. But the misclassification rate did not show an increasing pattern with increasing age (odds ratios [ORs], 30–39 years = 3.003; 40–49 years = 3.162; ≥ 50 years = 2.880). In actual current smokers, the degree of misclassification increased with age, based on their 20s (OR, 30–39 years = 3.801; 40–49 years = 5.646; ≥ 50 years = 7.798). And the misclassification rate in subjects with a history of disease was higher than that in subjects without a history of disease (OR, 10.002) (Table 4).
Table 4
Adjusted OR for misclassification of smoking status by self-report according to characteristics in all subjects and actual current smokers

Values are adjusted for age, exercise, alcohol, obesity, and presence or history of disease. The p-value calculated by adjusted logistic-regression analysis.
OR: odds ratio; CI: confidence interval.
aReference; bMean p-value is statistically significant.
![]()
DISCUSSION
In the present study, the validity of firefighters' answers on smoking questionnaires was evaluated using the urine cotinine test and whether subjects' characteristics affected the validity of their self-reported smoking status were analyzed. This is the first study to assess the validity of firefighters' answers on smoking questionnaires. These types of assessments have been performed on populations such as the general population, certain genders, certain age groups (e.g., adolescents), and participants in smoking cessation programs, but there have been few studies conducted on specific occupational groups, like firefighters.
In a study of the general population, the validity of the self-reported smoking status was reported to be high [4520]. In a study using data from the Third National Health and Nutrition Examination in the United States, misclassification was observed in 7.5% of self-reported smokers and 1.4% of self-reported non-smokers [4]. In a study using data from the Canadian Health Measures Survey, the sensitivity of self-reported smoking status was higher than 90% in both men and women [5]. In a study that analyzed data from the Korean National Health and Nutrition Examination Survey (KNHANES), the sensitivity and specificity of self-reported smoking status in Korean adults were 95.4% and 95.9%, respectively [20]. However, in a study on high school students in Korea, the sensitivity of self-report smoking questionnaires was much lower (62.5%) [9]. In a study comparing the validity of smoking questionnaires between Korean men and women, the sensitivity of questionnaires answered by women was less than that of questionnaires answered by men (36.70% vs. 85.53%, respectively) [6]. The sensitivity and specificity of smoking questionnaires answered by smokers after participating in a smoking cessation program were found to be 46.43% and 91.67%, respectively [10]. A meta-analysis reported that the sensitivity of self-reported smoking status was 6%–100% (mean=87.5%) and that the specificity was 33%–100% (mean, 89.2%), which generally denote high validity. However, validity varies widely among these studies, which suggests that the subjects and the purpose of the study impact accuracy. It has also been suggested that biochemical assessment should be utilized in order to enhance the validity of the smoking status survey depending on the subjects and the purpose of the research [21].
In this study, the actual smoking rate (51.24%) reflected by the urine cotinine test was significantly higher than the self-reported smoking rate (22.47%). The sensitivity and specificity of self-reported smoking status were 42.98% and 99.08%, respectively. Of all the subjects, 29.66% (n = 132) were misclassified. Importantly, 57.02% (n = 130) of the 228 cotinine verified actual current smokers were misclassified. In actual current smokers, the misclassification rate increased with age. The degree of misclassification increased when subjects had a history of disease (OR, 10.002).
There are several factors that can explain the misclassification of smoking status and difference between the self-reported smoking rate and the cotinine verified smoking rate in this study. The social desirability bias (tendency to answer questions in manner that seems socially favorable) is a factor that is being discussed in several studies of the validity of the self-reported smoking status [42122]. Studies on the social desirability bias reported that social desirability increased with age [232425]. In this study, the misclassification rate increased with age, showing a similar pattern to the studies on social desirability bias.
As forementioned, in general population, the validity of the self-reported smoking status has been reported to be high. But, similar to this study, in a study using medical checkup data from Korean adult men, there was a discrepancy between the self-reported smoking rate of 22.5% and the urine cotinine-verified smoking rate of 33.6%. Face-to-face interviews and anonymity were mentioned as factors causing discrepancy [22]. The absence of anonymity is one of the factors affecting the validity of the self-reported questionnaires [38], and in this study, the lack of anonymity may have contributed to reducing the sensitivity of self-reported smoking status.
The subject's cognition, comprehension, and attention problems are factors that affect the validity of self-reported questionnaires [3]. This means that the carelessness of the subject could also be a factor that would reduce the validity of the survey. In a study using medical checkup data in Korea, the discrepancy between the self-reported smoking status and the cotinine verified smoking status was being greater after multiple medical checkups [22]. This can be attributed to the increasing carelessness of respondents when they respond to the same survey multiple times. Firefighters can also have similar effects because they receive medical checkups every year.
In the study of patients with acute coronary syndrome and the general population, the validity of self-reported smoking status of patients was lower than that of the general population [26]. In a study of patients with peripheral arterial disease, self-report was analyzed as unreliable for smoking status classification and smoking volume (amount) survey [27]. In adult survivors of childhood cancer, high misclassification rate was reported between self-reported smoking status and cotinine levels [28]. The misclassification of smoking status was larger in self-reported ex-smoker than self-reported non-smoker [2628]. Factors that cause misclassification was described as the guilty feeling to harm themselves, the shame on health care workers, and the concern that treatment may be withheld if it fails to follow smoking advice [26]. In this study, subjects with a history of disease had a higher rate of misclassification than those who did not. The cotinine verified actual current smoking rate (55.47%) of self-reported ex-smoker was higher than that of self-reported non-smoker (27.19%) and showed similar results to other studies.
Tobacco use is one of the factors that affects court's approval of occupational disease [2930]. The perception that smoking negatively affects occupational disease rulings in court can lead to invalid responses on smoking questionnaires. In fact, in South Korea, the decision to approve lung cancer as an occupational disease in a male firefighter was denied because of smoking [31]. Additionally, there was a case involving 2 people who worked in the same place and had the same disease but received different court rulings because of their smoking status [32]. These cases exemplify why employees, like firefighters, can provide invalid responses on smoking status questionnaires.
Since electronic cigarettes and nicotine substitutes also contain nicotine, they can be a factor that can increase the urine cotinine levels [3334]. Electronic cigarettes and nicotine replacement therapy are tools that tobacco users use to quit tobacco smoking [3536]. Electronic cigarettes or nicotine replacement therapy users could classified as ex-smokers by self-report, but it is possible that their results of urine cotinine test was positive. In a study of Koreans who had tried to quit smoking, 18.3% of the respondents said they had experience using nicotine replacement therapy and 13.6% had experience using tobacco substitutes [37]. To minimize the impact of electronic cigarettes and nicotine replacement therapy on the results of this study, it was assumed that 18.3% of self-reported ex-smoker use nicotine replacement therapy (n = 23) and 13.6% use tobacco substitutes (n = 17). And it was assumed that all self-reported ex-smokers using nicotine replacement therapy and tobacco substitutes (n = 40) were tested positive in the urine cotinine test. After excluding 40 subjects from the total subjects (n = 445) and cotinine verified actual current smokers (n = 228), self-reported smoking rate, cotinine verified smoking rate, and the sensitivity of the self-reported smoking status were calculated as 24.7%, 46.4%, and 53.2%, respectively.
The urine cotinine test strip (qualitative method) used in this study and the fixed cut-off value could have caused some discrepancy between self-reported smoking status and actual smoking status. In several studies that evaluated the validity of self-reported smoking status, the urine cotinine concentration was measured by quantitative method (e.g., gas chromatography, liquid chromatography) [459], and in some studies, the suitable cut-off value was set after analyzing the subject's urine cotinine level [38]. But, the disadvantage of quantitative methods is that it is relatively expensive and it take a longer time to get a result [39]. Several studies have suggested a relatively simple qualitative test tool like strip type test kit compared to quantitative methods. In studies that analyzed the validity of the strip type method for classifying smoking status, it was reported that the strip type test kit had high sensitivity (97.1%, 92.0%, 99.5%) and specificity (91.0%, 92.0%, 97.3%) [40414243]. The strip type urine cotinine test method has been used to study the validity of self-reported smoking status and to study relationship between smoking habits and metabolic syndrome [444546]. In a study using urine cotinine test strip in male commercial drivers, cotinine verified smoking rate (50.6%) was higher than self-reported smoking rate (42.0%) [44]. In the study of adolescents, the sensitivity of self-reported smoking status was 67.6% and specificity was 99.3% based on the urine cotinine test strip, and it is suggested that the urine cotinine test strip can measure true prevalence of smoking in adolescents [45]. Studies on metabolic syndrome suggested that actual smoking status assessment by urine cotinine test strip was effective in recommending smoking cessation and it could lead to education for parents by detecting children's passive smoking in household environments [46]. The sensitivity and specificity of cotinine for screening smokers depends on the cut-off value used in study. In a study of comparing the urine cotinine concentration in current firefighters, former firefighters and non-firefighters, it was analyzed to show no difference in the urine cotinine levels between the groups. The urine cotinine levels varied from 2,235–24,734 ng/ml in smokers and 0.9–158 ng/mL in non-smokers [47]. In the study of the cut-off value of cotinine for smoking status classification, the commonly used cut-off value of urine cotinine was reported as 50–200 ng/mL [48]. In a study using the KNHANES (n = 11,629), the optimum cut-off value of the urine cotinine for Korean adults was analyzed as 164 ng/mL [49]. The cut-off value of device used in this study was 200 ng/mL, which is somewhat higher than the optimum cut-off value (164 ng/mL) suggested by study that analyzed the data from the KNHANES, to prevent underestimation of the validity of the self-reported smoking status (increasing the discrepancy between the self-reported smoking rate and the cotinine verified smoking rate).
The smoking status classification criteria in medical checkup may be a factor causing discrepancy between the self-reported smoking rate and the cotinine-verified smoking rate. In the smoking status survey in medical checkups, self-reported non-smokers include those who have never used tobacco in their lifetime and those who have smoked less than 100 cigarettes in their lifetime. Subjects who have smoked less than 100 cigarettes in their lifetime were be classified as self-reported non-smokers by smoking questionnaire, but could be positive for urine cotinine tests. There are studies that analyzed data from the KNHANES using the same criteria as this study for the classification of self-reported smoking status [2050]. In one study, only 3.9% of self-reported current non-smokers (self-reported ex-smoker or self-reported non-smoker) (n = 4,341) was analyzed that their urine cotinine concentration exceeded 50 ng/mL [20]. In another study, urine cotinine levels in male self-reported non-smokers were median values of 5.31 ng/ml and interquartile range of 14.59 ng/mL [50]. Since the cut-off value of urine cotinine level in this study was 200 ng/mL, it is thought that the classification criteria for self-reported smoking status did not had a significant effect on the results of this study. To minimize the effect of the classification criteria on the results in this study, the self-reported smoking rate, cotinine verified smoking rate, and sensitivity of the self-reported smoking status were calculated after excluding the cotinine verified actual smokers among self-reported non-smokers (n = 59) from study subjects. The self-reported smoking rate, cotinine verified smoking rate, and the sensitivity of self-reported smoking status were 25.9%, 43.8%, and 59.2%, respectively.
There are several ways to increase the validity of smoking status surveys. First, biochemical markers can be used to increase validity. Biochemical markers that measure tobacco exposure include nicotine, cotinine, thiocyanate, exhaled carbon monoxide, and blood carboxyhemoglobin. Thiocyanate levels can be affected by diet and carbon monoxide or carboxyhemoglobin levels can be affected by environmental factors, such as traffic or domestic emissions. The half-life of cotinine (15–19 hours) is longer than that of nicotine (2–3 hours), and thus, cotinine is considered a more appropriate biochemical marker of tobacco exposure [1617]. Furthermore, the results of urine cotinine tests can be rapidly obtained as the test involves a strip-type assay, and these results can be applied in anti-smoking education at medical checkups. Second, the “bogus pipeline technique” can be used to enhance the validity of smoking status surveys. This is not an objective method: it involves falsely telling the subject that an objective examination will be conducted so that the subject responds honestly to the survey [51]. Third, information can be obtained from a third party, and not from the subject. The “bogus pipeline technique” can likely be used only once and obtaining information from third parties is difficult for a large number of subjects. Therefore, biochemical markers are a useful way to increase the validity of smoking status investigation.
This study has several limitations. First, there were not enough investigations into factors other than direct smoking that could affect the results of urine cotinine tests. Factors that can affect the results of urine cotinine test include second-hand smoking, food (e.g., black teas, instant teas), drugs (e.g., serotonin), the genetic structure of the subject, and cross-reactions between nicotine metabolites [5253545556]. Several studies have reported urine cotinine levels of < 100 ng/mL on exposure to second-hand smoke [5257]. In this study, the cut-off value for the urine cotinine test was 200 ng/mL, and thus, it is likely that second-hand smoke exposure would have little effect on the results. Foods such as tomato, potato, black tea, and instant tea can be dietary sources of nicotine. Nicotine content was reported as tomato 7.3 ng/g wet weight in average, potato 15 ng/g wet weight in average, black tea ranged from 0 to > 100 ng/g wet weight, instant tea up to 285 ng/g wet weight [53]. The plasma cotinine concentration of 1 ng/mL corresponds to an average daily intake of 100 μg (100,000 ng) of nicotine [58], and urine cotinine levels was reported to be 5 times higher than plasma cotinine levels [59]. Assuming that the black tea contains 100 ng/g wet weight of nicotine, the daily intake of black tea of 1,000 g wet weight corresponds to urine cotinine of 5 ng/mL. CYP2A6 is a major enzyme involved in the metabolism of nicotine into cotinine. In subjects with polymorphism of the CYP2A6 gene, cotinine production could be reduced. In South Korea, the incidence of polymorphism was reported to be about 1.9% [60]. Serotonin and cotinine have a cross-reactivity rate of about 1% and there is a cross-reactivity rate of less than 5% between nicotine metabolites [5456]. Second, the half-life of cotinine is about 19 hours [17], and cotinine reflects the recent (in 3–4 days) tobacco smoke exposure [59]. For self-reported ex-smokers who quit smoking few days ago, the results of the urine cotinine test can be positive. Conversely, in occasional (non-daily) smokers, the results of the urine cotinine test can be negative. Third, the cut-off value (200 ng/mL) of the urine cotinine test kit used in this study can be a limitation. As forementioned, a study analyzing the KNHANES data suggested the optimum cut-off value of 164 ng/mL [49]. However, the study using data from the Korean National Environmental Health Survey analyzed the appropriate cut-off value of Koreans as 53 ng/ml, which shows a difference between the results of the 2 studies [38]. The cut-off value applied in this study was set higher than the cut-off value proposed in the 2 studies that analyzed Korea's national data. This can reduce the discrepancy between the cotinine verified smoking rate and the self-reported smoking rate and prevent the validity of the self-reported smoking status from being underestimated. However, there can be a limitation that actual smokers with relatively low urine cotinine levels, such as occasional smokers, could be misclassified as cotinine verified non-smokers.
CONCLUSIONS
In present study, the validity of a self-report smoking questionnaire for firefighters was not found to be suitable for investigating smoking status due to low sensitivity. The validity decreased with age and was lower when subjects had a history of disease. To increase the validity of smoking status surveys in firefighters, consideration of the various factors like survey environment, subjects' characteristics (e.g., age, disease status), and occupational factors is needed. Because various factors can influence the response to the smoking questionnaire, attention should be paid to the interpretation of the low validity of self-reported smoking status in firefighters, and further research will be needed to identify the more accurate cause.
 XML Download