

 PDF
PDF ePub
ePub Citation
 Print
Print


INTRODUCTION
Odontogenic keratocysts (OKCs) are one of the most aggressive cysts in the oral and maxillofacial area because of their high recurrence rate and infiltrative behavior.1 OKCs frequently occur in patients aged between 10 and 40 years, with only rare cases reported in elderly patients.2 OKCs comprise 4% to 11% of odontogenic cysts,3 and approximately 70% of OKCs are located in the mandible.2 Notably, in 25% to 40% of cases, an unerupted tooth is associated with the lesion.4 An OKC typically appears as a well-defined unilocular radiolucent area with smooth or scalloped margins and a sclerotic border. However, multilocular lesions may also occur, particularly in the mandible.2 Importantly, OKCs exhibit a high recurrence rate, varying from 20% to 80%.567 Various treatment methods for OKCs have been proposed, including surgical approaches such as whole resection of the cyst, to avoid recurrence.8
However, in young, growing patients (aged less than 20 years), this radical approach might result in numerous complications, including the disturbance of jaw growth and loss of the involved tooth.9 An alternative method—marsupialization—involves the formation of a continuous interface between the outer surface and the cyst cavity; this allows free drainage and reduces the size of the cavity.10 The primary advantage of marsupialization, especially in young, growing patients, is that the surgery is minimally invasive. Thus, bony defects and resulting deformities are minimized, and the involved tooth has a greater probability of survival.111213
In this case report, we describe successful comprehensive orthodontic treatment combined with marsupialization of the cyst in a young girl who exhibited an OKC with an impacted mandibular left canine and first premolar. Written informed consent was obtained from the patient and the parent for publication of this case report and any accompanying images.
DIAGNOSIS AND ETIOLOGY
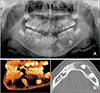
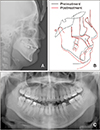
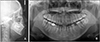
A 10-year-old girl was referred to our hospital with the chief complaint of a cystic lesion on the left side of the mandible. Clinical examination revealed a bony protuberance on the left mandible, which produced mild pain on palpation. Panoramic radiography revealed a radiolucent lesion extending from the mandibular symphysis through the left mandibular body, with ectopic impaction of the mandibular left canine and first premolar, as well as congenitally missing bilateral mandibular second premolars (Figure 1A). Computed tomography (CT) revealed a well-defined intraosseous lesion with a sclerotic border (Figure 1B). On the basis of an incisional biopsy of the lesion, the patient was diagnosed with an OKC.
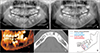
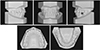
Considering the size of the lesion and the patient's young age, marsupialization of the cyst was performed, rather than excisional removal. Under local anesthesia, a mucoperiosteal flap was created and the bone lining the cyst was partially removed to insert a silastic drain into the cyst cavity. The drain was fixed with sutures around the oral mucosa, and the patient was instructed to self-irrigate the cyst cavity through the drain, and to maintain oral hygiene. A panoramic radiograph and CT images acquired after 9 months of decompression of the cyst revealed a remarkable reduction in the size of the cyst and spontaneously improved positions of the impacted permanent teeth (Figure 2A–2D). The patient was then referred to the orthodontic department for comprehensive orthodontic treatment.
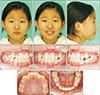
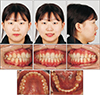
Pre-orthodontic treatment facial photographs showed a concave profile with mildly retrusive lips (Figure 3). Intraorally, the patient exhibited a 3.0-mm mandibular dental midline deviation towards the left side. She showed minor crowding on both the maxillary and mandibular dentitions; an apparent space deficiency was observed for the eruption of the impacted mandibular left canine and first premolar (Figure 4). Lateral cephalometric analysis showed that the patient had skeletal Class I malocclusion with a hyperdivergent profile, lingually inclined mandibular incisors, and mildly retruded upper and lower lips, with respect to the E-line (Figure 5 and Table 1). Panoramic radiograph revealed that the eruption path of the impacted mandibular left canine and first premolar was blocked by the distally tilted mandibular anterior teeth and mandibular right first deciduous molar. Both the mandibular second premolars were absent, and the mandibular left second deciduous molar showed mobility with short roots, whereas the mandibular right second deciduous molar was well maintained without mobility.
TREATMENT OBJECTIVES
On the basis of the clinical and radiographic findings, this patient was diagnosed with skeletal Class I malocclusion with crowding, congenitally missing teeth, and impacted teeth due to an OKC. The following treatment objectives were planned: (1) relief of crowding, (2) space management on the mandibular left dentition, and (3) correction of the dental midline.
TREATMENT ALTERNATIVES
On the basis of the treatment objectives to manage the mandibular left space with the impacted canine and first premolar, as well as the congenitally missing second premolar for tooth alignment, we considered the following treatment alternatives: (1) extraction of the impacted teeth and remaining deciduous teeth and space maintenance until the completion of growth for prosthodontic restoration of the missing area on the mandibular left side, or (2) orthodontic traction of the impacted mandibular left canine and first premolar after the extraction of the remaining deciduous teeth on the mandibular left side.
Option 1 would result in a substantial bony defect after the surgical extraction of the impacted teeth, and the patient might be required to maintain a lengthy edentulous area on the mandibular left side until growth was complete. Moreover, to correct the midline deviation of the mandibular dentition, extraction of the mandibular right second deciduous molar would be needed. However, considering the patient's concave profile, it was inappropriate to close the space in combination with the retraction of the mandibular anterior teeth. In contrast, by using orthodontic traction in option 2, bony trauma would be minimal, and by salvaging the impacted teeth, the edentulous area on the mandibular left side would be much shorter.
Considering the patient's young age and the immature root apex of both the impacted teeth, option 2 was chosen with the consent of the patient and her caregiver.
TREATMENT PROGRESS
Enucleation of the residual cyst was performed. Simultaneously, we attached a button with a 0.012-inch stainless steel ligature wire to the crown of the impacted teeth. We extracted the mandibular left first and second deciduous molars because of their mobility and short roots. Thereafter, we designed a removable appliance with a hook to apply upward and distal uprighting force to the impacted teeth. The patient was instructed to wear the appliance and engage the elastics to the ligature wire on the impacted teeth and the hook of the appliance (Figure 6). After 6 months, traction of the mandibular left canine and first premolar was successfully achieved to the level of the adjacent teeth.
When the eruption of all permanent premolars was completed, we placed a fixed appliance for comprehensive orthodontic treatment (Figure 7A). To correct the deviated midline of the mandibular dentition, interproximal disking of the mandibular right second deciduous molar was performed. We placed an open-coil spring between the mandibular left first premolar and first molar to correct the axis of the distally tipped mandibular incisors, as well as to obtain space for the restoration of the mandibular left second premolar (Figure 7B).
The appliances were removed after 34 months of active treatment. Fixed retainers were bonded to the lingual surfaces of the anterior teeth of both the arches, as well as the temporary buccal surfaces of the mandibular left first premolar and first molar, in order to maintain space for the restoration of the mandibular left second premolar before making a mandibular removable appliance. The maxillary and mandibular circumferential retainers were delivered with the resin plate between the mandibular left first premolar and first molar to maintain space for the restoration of the mandibular left second premolar; we instructed the patient to use them 24 hours per day for the following 6 months. We also instructed the patient to undergo implant treatment for the missing area on the mandibular left second premolar when she reached adulthood.
RESULTS
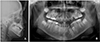
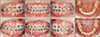
After orthodontic treatment, ideal alignment of the dental arches was achieved, with sufficient space for the restoration of the mandibular left second premolar (Figures 8 and 9). Although the dental midline was improved, the patient still showed a 1-mm deviation of the mandibular dentition to the left side; however, she was satisfied with the result. Panoramic radiography revealed new bone apposition at the site of the cyst, with successful eruption of the impacted teeth associated with the cyst (Figure 10). Periodontal support of the mandibular left canine and first premolar was favorable, including the gingival line and alveolar bone height; moreover, the vitality of the teeth was maintained. Cephalometric analysis showed no significant skeletal changes, and the mandibular incisor to mandibular plane angle improved from 86.4° to 95.5°. The patient has shown no signs of recurrence of the cystic lesion at the 2.5-year follow-up after debonding (Figure 11).
DISCUSSION
OKCs should be treated cautiously because of their neoplasm-like characteristics, such as aggressive invasion to adjacent tissues and high tendency of recurrence. Owing to these features, OKCs were once classified as neoplasms (keratocystic odontogenic tumors)14; however, recently, they have been referred to by their original name, OKCs.15 Potential contributing factors for the high recurrence rate of OKCs are the difficulty in complete removal of the epithelial lining of the cysts, and the possible existence of satellite cysts in the adjacent teeth after the surgery.16
The treatment strategies for OKCs remain controversial, and no uniform protocols are available. Because of the high potential of recurrence, most surgeons prefer complete excision of the cyst with extensive margins.17 However, cases involving large cysts may result in adverse side effects, including facial deformities, loss of the related tooth, sensory disturbance, and growth inhibition in growing patients.918 Therefore, more conservative treatments, such as decompression or marsupialization, are considered as alternative options for the treatment of OKCs, especially in growing patients.
Our patient was 10 years old and had two ectopic impacted teeth associated with the cystic lesion. Considering the patient's residual growth, and to save the affected teeth, we chose the conservative method, marsupialization. Several previous studies reported the successful eruption of an affected tooth following marsupialization of the cyst.101319 In this case, after marsupialization of the OKC, the positions of the ectopic impacted teeth showed spontaneous improvement, along with a reduction in the size of the cyst. Orthodontic traction was needed to expose these impacted teeth into the oral cavity, and residual cysts around the impacted teeth were enucleated for orthodontic traction while buttons with a 0.012-inch stainless steel ligature wire were attached to the crown. Orthodontic traction of the impacted teeth was easily achieved with simple mechanics by using a removable appliance. After treatment, the affected teeth showed normal vitality and fully developed roots.
In our patient, the initial size of the cyst was considerably wide, with margins that extended from the mandibular symphysis to the mesial side of the mandibular left first molar. If enucleation of the whole cyst with extensive marginal ostectomy had been performed at the beginning of treatment, it would have resulted in a severe bony defect on the affected area, resulting in facial deformities related to growth inhibition; further, there would have been difficulty in placing dental implants at the missing area. In contrast, a previous study reported that marsupialization of the cyst can stimulate bone formation by decreasing the intracystic pressure.20 Considering the findings of this prior report, we chose marsupialization for our patient. The size of the cyst was dramatically reduced and remodeling of the bone was successfully achieved. Furthermore, because of the orthodontic traction of the impacted teeth, the alveolar bone in the affected area recovered to its normal state. At the 2.5-year follow-up, plain radiography also revealed no remarkable facial deformities or disturbance of jaw growth.
Some clinicians have suggested that marsupialization might lead to the recurrence of the cyst, owing to the possibility of incomplete removal of the epithelial lining.17 However, a meta-analysis performed by Wushou et al.21 indicated that marsupialization could reduce the recurrence rate of OKCs better than enucleation or surgical resection could. In the present case, the patient showed no signs of recurrence at 2.5 years after debonding, and the teeth appeared normal. In these controversial circumstances, performing periodic radiographic imaging throughout the follow-up period, regardless of the surgical method, is generally recommended for patients with OKCs.
CONCLUSION
This case showed successful results of marsupialization followed by orthodontic traction of the impacted teeth in a growing patient with an OKC. This approach made it possible to save the affected teeth and minimize facial deformities, growth disturbance, and nerve damage. Moreover, we expect spontaneous improvement of the positions of the ectopic impacted teeth, along with a reduction in the size of the cyst after marsupialization of the OKC. We speculate that comprehensive orthodontic treatment combined with marsupialization can be an effective treatment strategy for OKCs, especially in growing patients with impacted teeth.


 XML Download