

 PDF
PDF ePub
ePub Citation
 Print
Print


INTRODUCTION
Precise diagnosis and meticulous treatment planning are essential in orthodontic treatment. Patients with facial asymmetry frequently exhibit three-dimensional (3D) compound problems of the jaw, such as vertical rotation on the coronal plane (roll), horizontal rotation (yaw) on the axial plane, and vertical rotation (pitch) on the sagittal plane.1 Therefore, establishment of the midsagittal plane (MSP) as the reference plane is important for quantitative evaluation of the asymmetry modality.
Previous methods for determining MSPs include landmark-based,2 shape-analysis,3 surface-model-based,4 and voxel-based superimposition methods.5 Of these, the landmark-based method is advantageous as its implementation is easier and more familiar to clinicians than the other methods. Moreover, landmark plotting on cone beam computed tomography (CBCT) images was demonstrably precise and reliable,6 regardless of the head orientation.7 Therefore, various studies have proposed different landmark-based MSPs: Damstra et al.8 suggested the MSP perpendicular to the Frankfort horizontal (FH) plane passing through the nasion (N) and sella; Green et al.9 recommended the MSP that passes through N, incisive foramen (IF), and basion (Ba); and Shin et al.10 proposed the MSP that features the N, anterior nasal spine (ANS), and posterior nasal spine (PNS). Although these diverse planes can be used to diagnose facial asymmetry, it is necessary to define one reference plane that can best approximate the true symmetrical MSP.
Traditionally, in two-dimensional (2D) cephalometric analysis, variations in head posture were considered to affect the locations of landmarks,11 and vertical head rotation can cause projection errors in posteroanterior cephalography.12 Hence, the natural head posture (NHP)1314 was adopted as a physiologic and reproducible posture in 2D cephalometrics. However, the validity of such standardization of head posture in CBCT was contested, despite the reproducibility of the NHP in 3D.15 Reorientation of CBCT images has become a common process for 3D analysis recently, but only few studies have used coordinate systems to consider the changes in the locations of cephalometric landmarks according to head orientation.
Therefore, the aims of this study were to investigate (1) the plane that best approximates the true symmetric MSP among three prominent landmark-based MSPs and (2) the influence of different CBCT reorientations on the positional changes of landmarks.
MATERIALS AND METHODS
This study consisted of 43 patients (21 male and 22 female; mean age, 23.0 ± 8.20 years), and CBCT scans were taken for evaluation and treatment of dentofacial problems at Korea University Anam Hospial between 2016 and 2017. Exclusion criteria were the presence of systemic disease, craniofacial deformity, prior orthodontic or surgical treatment, and facial trauma. The initial radiographs were obtained from the patients' diagnostic records and CBCT images.
On the basis of Angle's classification and the extent of menton (Me) deviation of the mandible on posteroanterior cephalography, patients were divided into four groups as follows.16 Group 1 consisted of 10 patients with skeletal Class I malocclusion and a Me deviation of less than 2 mm, group 2 included 11 patients with skeletal Class III malocclusion and a Me deviation of less than 2 mm, group 3 consisted of nine patients with skeletal Class III malocclusion and a Me deviation of 2 to less than 4 mm, and group 4 included 13 patients with skeletal Class III malocclusion and a Me deviation of more than 4 mm (Table 1). The experimental protocols were reviewed and approved by the Institutional Review Board of Korea University Anam Hospial (2017AN0397).
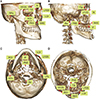
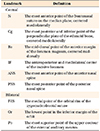
CBCT images were obtained with the patients in a sitting position. The CBCT scanner (KaVo 3D eXam; KaVo Dental, Bismarckring, Germany) was set to 120 kVp, 7 mA, with a 0.2-mm voxel size, scan time of 24 seconds, and a field of view of 230 × 170 mm. We performed 3D reconstructions of DICOM data using the Invivo 5.4 software (Anatomage, San Jose, CA, USA). The 12 cephalometric landmarks were indicated on the CBCT images: the six central landmarks included the crista galli (Cg), Ba, N, IF, ANS, and PNS, and the six bilateral landmarks included the right frontozygomatic suture (RFZS), left frontozygomatic suture (LFZS), right orbitale (ROr), left orbitale (LOr), right porion (RPo), and left porion (LPo) (Table 2 and Figure 1).17 The landmarks selected on the volume-rendered views were corrected on the multiplanar views: anteroposteriorly on the sagittal view, superoinferiorly on the coronal view, and mediolaterally on the axial view.
The three prominent reorientation methods (RMs) used for CBCT images were as follows. RM 1: After constructing the horizontal plane that included the ROr, RPo, and LOr, the MSP perpendicular to this horizontal plane18 while passing through the Cg and Ba, was established. RM 2: After constructing the MSP that included the N, IF, and Ba, the horizontal plane was set perpendicular to this MSP11 while passing through the ROr and RPo. RM 3: After constructing the MSP that included the N, ANS, and the PNS,10 the horizontal plane was set perpendicular to this MSP while passing through the ROr and RPo (Figure 2).
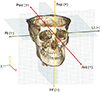
From the selected 12 cephalometric landmarks on 129 CBCT images obtained in 43 patients by the three RMs, 1,548 points were obtained. The x, y, and z coordinates of the 1,548 points were recorded and exported to Excel (Microsoft, Redmond, WA, USA). For the 3D coordinate system, the reference axes on the CBCT image were established with N as the origin (coordinates:10 0, 0, 0). In the transverse direction, the x-axis ran from the right to left sides of the image and passed through the N, where the coordinates to the right and left of the N corresponded to negative and positive values, respectively. For the sagittal direction, the y-axis projected from the anterior to the posterior poles, where the coordinates anterior and posterior to the N corresponded to negative and positive values, respectively. In the vertical direction, the z-axis ran between the inferior and superior sides of the image, where the coordinates inferior and superior to the N corresponded to negative and positive values, respectively (Figure 3).
Additionally, the x, y, z coordinates of the midpoints of the three pairs of bilateral landmarks were derived: the midpoint of the bilateral FZS (MidFZS), the midpoint of the bilateral Or (MidOr), and the midpoint of the bilateral Po (MidPo).
The mean absolute distance (MAD)9 was defined as the average distance of the nine landmarks, six central landmarks (N, Cg, Ba, IF, ANS, PNS) and the midpoints of three bilateral landmarks (MidFZS, MidOr, and MidPo), to the MSP–i.e., the value obtained by dividing the sum of the distances from those landmarks to the MSP by nine–and was calculated by the generalized Euclidean equation.

The MSP with the smallest MAD value9 was investigated as the one best approximating the ideal true symmetrical MSP where the craniofacial region's central landmarks and midpoints of the bilateral landmarks would theoretically be placed.
The perpendicular distances from each landmark to the three different MSPs according to the RMs were acquired. The means and standard deviations of the MADs for the groups were obtained and compared. The means and standard deviations of the x, y, and z coordinate values of each landmark on each reoriented CBCT image were acquired, and the difference in the values of the coordinates among the RMs were compared within and between groups.
Statistical analysis
The SPSS WIN ver. 17.0 (SPSS Inc., Chicago, IL, USA) program was used for statistical analysis. In the MAD comparison, a two-way repeated-measures analysis of variance (ANOVA) with a Bonferroni correction was used. To compare the differences in the x, y, and z coordinates of the landmarks among the RMs, one-way ANOVA and Tukey's post-hoc tests were used. Reorientation procedures were implemented and repeated 2 weeks later according to random selection by the same operator. Systematic intraexaminer errors were evaluated using a paired t-test, and intraclass correlation coefficients (ICC) were assessed for the magnitude of measurement errors. Statistical significance was considered at the level of 0.05.
RESULTS
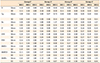
The data were confirmed to show a normal distribution by using the Shapiro–Wilk test (p > 0.05). The means and standard deviations of the distances of each landmark to the three MSPs according to the RMs were acquired for the groups (Table 3). In terms of MAD, there were no significant differences among the groups (Table 4). However, the RMs for the MADs showed significant differences (Tables 4 and 5). After pooling the subjects together, the MAD by RM 1 was 0.20 ± 0.10 mm; that by RM 2 was 0.51 ± 0.20 mm; and that obtained by RM 3 was 0.59 ± 0.25 mm (Table 4).
With respect to the mean values of the x, y, and z coordinates of the 12 landmarks according to the three RMs, there were no significant differences among the groups except for the z coordinate of the Ba between group 1 and 4 in RM1 (p < 0.05).
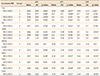
In within-group comparisons, eight of the 180 central landmark coordinates (4.4%), at the Cg, IF, and ANS, demonstrated significant differences among the RMs, but there were no significant differences in the Ba and PNS (Table 6). For the bilateral landmarks, 13 of the 216 coordinates (6.0%), at the RFZS, LFZS, ROr, LOr, RPo, and LPo, demonstrated significant differences (Table 6). For between-group comparisons, while a few Cg and ANS coordinates showed significant differences, all the coordinates corresponding to the Ba, IF, PNS, RFZS, LFZS, ROr, LOr, RPo, and LPo showed no significant differences (Table 7).
The systemic intraexaminer errors for repeated measurements were found to be statistically insignificant using a paired t-test. Intraexaminer reliability was good; the ICC was 0.984 for both RMs 1 and 2, and 0.948 for RM 3.
DISCUSSION
We compared the three prominent landmark-based MSPs. Naji et al.19 reported that the anatomic structures in the 3D cephalometric analysis were reliable, and Gribel et al.20 observed that craniofacial measurements in CBCT were sufficiently precise to be used for quantitative diagnosis.
Hwang et al.21 used the MSP passing through the Cg, ANS, and opisthion for analysis of facial asymmetry, and Kim et al.22 reported that MSPs with landmarks located on the skull base were stable. The MSP of RM 1 in the present study consisted of the plane that included landmarks on the cranial base such as the Cg and Ba. Recently, An et al.23 advanced the plane perpendicular to the FH plane for asymmetry diagnosis; our findings agreed with this designation of the plane perpendicular to the FH plane as the optimal MSP. On the other hand, the MSPs of RMs 2 and 3 used the landmarks situated on the maxillae: the IF, ANS, and PNS. For the identification of these landmarks, Lagravère et al.24 reported that the ANS and PNS were less reliable in the 3D reconstruction images because of their low density, and Lou et al.25 reported that the IF showed a superoinferior variation rather than mediolateral direction.
Although all three MSPs achieved small MAD scores in terms of absolute values, the MADs of RMs 2 and 3 were approximately 2 to 3 times larger than that of RM 1 (Table 4). The MAD of RM 3 was the largest, which might be attributable to the area of the MSP in RM 3 using the PNS as a posterior landmark being smaller than those of RMs 1 and 2 including the Ba; hence, the MSP of RM 3 was likely be more affected by reorientation. However, the proximity in the distances among the three MSPs was surprising, and could be due to the fact that our candidate planes were not derived from arbitrary combinations of landmarks in the craniofacial region but investigated as potential optimal MSPs according to the screening processes used in previous studies.
As mentioned previously, although statistically significant differences were shown among the RMs, the minor differences in values among the MSPs could mean that all three planes would approximate the true symmetrical MSP–i.e., the three MSPs could be accepted as the reference planes for diagnosis of facial asymmetry. Nevertheless, we occasionally encounter cases where the ANS or central landmarks of the maxillae are inconsistent and unaligned with the center of the face. In such cases, asymmetry evaluation based on maxillary central landmarks may result in distorted outcomes; hence, it is thought to be significant that the MSP of RM 1 was found to best approximate the ideal true symmetric MSP.
However, the definition of the horizontal plane should be performed with caution when determining the MSP, as this plane could be affected by the roll (vertical asymmetry) of bilateral landmarks. The establishment of each horizontal plane of the three RMs in the present study was informed by the Or and the Po, which together form the FH plane. While the FH plane is widely employed as a reference in cephalometric analysis, and is considered the most acceptable anatomic plane to approximate the true horizontal plane (THP), it has shortcomings, including individual variability of the Or and the Po and difficulties in landmark identification: the FH plane does not always synchronize with the THP,26 and it's errors are frequently much greater than those involved in locating NHP27 because of individual variability of the landmarks.
In this study, we also obtained the ICCs of the horizontal plane in RM 1 by comparing the coordinates of the three landmarks comprising the horizontal plane. The ICCs of the x, y, and z coordinates of ROr were 0.918 (p < 0.05), 0.865 (p < 0.05), and 0.984 (p < 0.001), respectively. Those of the LOr were 0.962 (p < 0.05), 0.990 (p < 0.001), and 0.984 (p < 0.001), and those of the RPo were 0.995 (p < 0.001), 0.975 (p < 0.05), and 0.999 (p < 0.001), respectively.
The subjects in group 1 had different skeletal patterns than those in groups 2 through 4. Additionally, groups 1 and 2 were symmetric groups; group 3, a mild to moderate asymmetric group; and group 4, a severe asymmetric group. According to Severt and Proffit,28 a higher prevalence of facial asymmetry was reported in patients with skeletal Class III than in those with Class II malocclusions. Since one of the aims of this study was to find the applicability of the optimal MSP–regardless of the severity of chin deviation, we selected skeletal Class III subjects who had a high incidence of asymmetry as the experimental group. Skeletal Class I samples were chosen as the control group, and further studies involving skeletal Class II samples will be needed. There were no significant differences in MAD among the groups (Table 4). This may be due to the fact that the differences in asymmetry of the maxillae among groups might not be significant. Kwon et al.29 reported that growth compensated for or aggravated the intrinsic asymmetry of the mandible. The landmarks of the mandible were excluded in our study, since they can be misestimated by the asymmetry modality of the maxillae that attach to the cranium.
Our results indicate that the MSP of RM 1 could be used as the reference plane regardless of the extent of chin deviation. However, according to Green et al.,9 central landmarks tended to show better agreement than lateral landmarks on a given MSP. In this study, the central landmarks were used to establish the MSPs as RMs, and to obtain the outcome measures for calculation of the MAD scores. Hence, additional studies on identification of the MSP as determined by independent landmarks not on the sagittal plane will be required. Furthermore, while we expected that the MAD of group 4 with severe Me deviation would be the largest, it was not. This may indicate that the severity of maxillary asymmetry in group 4 might not be proportional to the amount of chin deviation.
With respect to the within-group comparisons among the three reorientations, most of differences in the values of the x, y, z coordinates of the 12 landmarks did not show significant differences. Significant differences were mainly observed in group 2 between RMs 2 and 3 (Table 6). Considering the bilateral landmarks showing significant differences in the values of those coordinates, the positions of the landmarks tended to move contralateral to each other between the two RMs; the right landmarks moved in an anteroinferior direction, while the left landmarks moved in a posterosuperior direction (Table 6). These trajectories might be related to asymmetry patterns of the maxillae in group 2, such as roll, yaw, and pitch.
Ruellas et al.30 reported that 3D difference was not affected by the use of CBCT landmarks but found that the amount of directional change was affected by head orientation. Similarly, the within- and between-group comparisons conducted in the present study demonstrated that 3D differences in most of the landmark coordinates among the RMs were not significant. However, it is thought that if more samples had been used in this study, the group comparisons could have found significant results in the difference values of the landmark coordinates among RMs. Moreover, to overcome the limitations imposed by the small sample size of the present study, 40 to 50 additional subjects comprising a total of 80 to 90 would be required to obtain sufficient power (80–90% by G-power calculation).
Future studies are required to verify the optimal MSP according to severity of maxillary asymmetry or presence of cranial asymmetry. Additionally, in diagnosis of facial asymmetry, not only skeletal analysis but also soft tissue examination are important; therefore, it will be necessary to investigate the MSP by a combination of skeletal and soft tissue landmarks. Most importantly, it will be crucial to investigate how the severity of asymmetry can be changed by different MSPs by examining the differences in the landmarks coordinates in asymmetric regions.
CONCLUSION
Although the distance differences among the three prominent landmark-based MSPs were minor, the vertical plane perpendicular to the horizontal plane including the ROr, RPo, and LOr while passing through the Cg and Ba best approximated the true symmetrical MSP. This MSP could be implemented as the reference plane for the diagnosis of facial asymmetry regardless of the extent of chin deviation. Additionally, the influence of different CBCT head reorientations on the positional changes in cephalometric landmarks in 3D spaces were mostly insignificant.


 XML Download