

 PDF
PDF ePub
ePub Citation
 Print
Print


INTRODUCTION
Dental study models in plaster have been an essential part of patient records in orthodontics. They are valuable tools for diagnosis and treatment planning and enable dynamic assessment of treatment progress in clinical cases.1 However, plaster models present some problems such as storage, breakage, and loss.23 The use of digital models in orthodontics has increased because of their advantages, and they would probably replace the traditional plaster models in the future. In the last two decades, the methods, techniques, and software programs used for three-dimensional scanning of plaster models and dental impressions have been continuously improved. Plaster models can now be scanned using different scanning methods, such as laser scanning, structured light scanning, or computed tomography (CT) scanning. In laser scanning systems, receivers capture laser beams that reach the object. These systems typically operate with three, four, or more different laser beams. The scanning software can record the time interval between the emission and reflection of the laser beams to capture images of objects such as dental impressions or plaster models. CT scanners provide information about both superficial and deep structures of the plaster models, dental impressions, and wax bite registrations. CT scanners are more often used to scan impressions of alginate or polyvinylsiloxane materials than to scan plaster models,345 but their disadvantages include the absence of color value and radiation risk for the operator.6 The accuracy of digital dental models generated using laser scanning of plaster models has been evaluated.2789101112131415161718192021222324 However, the accuracy of digital models generated by scanning plaster casts or impressions with structured light and CT scanners has not been studied intensively.7252627
An orthodontist who uses digital models for diagnosis and treatment planning needs to use specific software programs to perform measurements, execute the dental analyses, and make a virtual setup. Training is needed to master each program.28 In general, software used for analyzing digital models can show the model in different planes; moreover, the model can be enlarged using the zoom function, and the images can be segmented using clipping functions. Most software programs for analyzing digital models are able to show the occlusal contacts and can be used to make point-to-point or point-to-plane measurements. Moreover, some of these software programs automatically provide the peer assessment rating index or the index of the American Board of Orthodontics analysis.
Several software programs are available for performing measurements on digital dental models, such as E-models (GeoDigm Corporation Inc., Falcon Heights, MN, USA), Ortho Analyzer™ (3Shape, Copenhagen, Denmark), SureSmile (OraMetrix, Richardson, TX, USA), Maestro3D (AGE Solutions, Pisa, Italy), NemoCast (Nemotec, Madrid, Spain), and DigiModel (OrthoProof, Nieuwegein, The Netherlands). Although the measuring tools used in these software programs are almost identical, their accuracy has to be compared. In this study, we selected two software programs (Ortho Analyzer® and Digimodel®) and evaluated the accuracy of their digital model measurement tools.
To digitize the plaster models, several types of scanners and different scanning methods are available. The stereolithographic (STL) output files of the laser scanner and the Digital Imaging and Communications in Medicine (DICOM) output files of the CT scanner can both be used with different measurement software programs. Previous studies have compared the measurements on plaster models obtained using calipers and digital models with different software programs, but no study has compared the measurement accuracy of different software programs.789101113 The aim of this study was to evaluate and compare both the accuracy and reliability of digital models generated using laser and CT scanners to those of plaster models, as well as to assess the measurement accuracy of two different software programs. The null hypothesis of this study was that there would be no clinically relevant difference in the accuracy and reliability of measurements obtained using two different software programs on digital models generated using two plaster model scanning methods.
MATERIALS AND METHODS
Sample
A sample of 10 plaster models was used to determine the power for this study. The formula described by Pandis,29 assuming a 90% power test with an α of 0.05 to detect a difference of 1 mm and a standard deviation of 1.16 mm, was used. The sample size calculation revealed the need for a sample of at least 29 plaster models, which was similar to or larger than the sample size of previous studies.791011131415171921232530 The final research sample consisted of dental models of 30 students at the Orthodontic Department of Universidade Federal Fluminense, who volunteered to participate in this study. The inclusion criterion was the presence of fully erupted permanent dentition including all upper and lower first permanent molars. The exclusion criteria were as follows: dental anomalies in size and shape, presence of severe gingival recessions, dental crown abrasions, attritions and erosions, or presence of fixed orthodontic retention. The age of the volunteers at the time of impression taking was between 21 and 39 years; their average age was 27 years and 9 months.
Ethical approval was obtained for the study (No. 221.664, 01/02/2013) from Universidade Federal Fluminense, and each volunteer signed an informed consent form before the start of this research.
Methods
Alginate impressions of the upper and lower arches were made (Hydrogum®, Zhermack, Badia Polesine, Rovigo, Italy) following the manufacturer's guidelines. A bite registration was made using number 7 dental wax (Clássico®, São Paulo, Brazil). According to the guidelines of the manufacturer, the impressions were stored in a humidified storage cabin for 20 minutes to complete alginate setting, and then, the impressions of the teeth and the alveolar ridge were filled with type IV plaster (Vigodent®, Rio de Janeiro, Brazil). The base of the plaster model was filled with white plaster (Mossoró®, Rio de Janeiro, Brazil).
Each set of plaster models was scanned using two scanners, a laser scanner R700® (3Shape) with a maximum resolution of 20 microns and a Flash CT scanner (model FCT-1600; Hytec Inc., Los Alamos, NM, USA). The tube voltage of the CT scanner was constant and set at 160 kV, and the voxel resolution was 0.05 mm (50 microns). The scanner produced 780 slices in a rotation of 360°, and the scanning time was approximately 28 seconds. In the laser scanner, the upper and lower models were scanned separately. Then, the plaster models were scanned in occlusion to obtain the interarch relationship. In the CT scanner, the upper and lower models and the bite registration were scanned simultaneously. The occlusion of the digital models was adjusted by the technician with the Digimodel software by using the scanned wax bite registration as a reference.
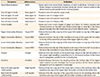
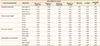
For analysis, 42 parameters with clinical orthodontic relevance were defined (Table 1). Two trained and calibrated examiners performed the measurements on the plaster and digital models. Examiner 1 was an orthodontist with 10 years of experience and familiar with measuring digital models, and examiner 2 was an orthodontic resident with 2 years of experience in measuring digital models. For measurements on plaster models, a digital caliper (IP67; Tesa SA®, Renens, Switzerland) was used. Each pair of digital models was measured with two different software programs: Ortho Analyzer (OA) software (version 1.5.1.7; updated May 13, 2015; 3Shape) and Digimodel (DM) software (version 3.25.0; updated Mar 6, 2015; OrthoProof). According to the manufacturers, the digital caliper and both software programs could be used with an accuracy of 0.01 mm.
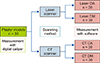
The digital models produced by CT scanning (DICOM files) were converted to STL files to be opened in OA, and the digital models scanned in the laser scanner (STL files) were converted to Quadrox Digital CCTV System Components (OPM files), to be opened in DM. Figure 1 illustrates the design of the study. Two examiners measured the plaster models and the digital models from both scanners and by using both software programs, thereby creating four different series of models: models from the laser scanner measured with OA (Laser OA), models from the laser scanner measured with DM (Laser DM), models from the CT scanner measured with OA (CT OA), and models from the CT scanner measured with DM (CT DM). Examiner 1 performed all the measurements and examiner 2 performed the measurements of 25 selected parameters to evaluate the reliability of the measurement method.
Statistical analysis
Statistical analyses were performed using IBM SPSS Statistics for Windows, version 20.0 (IBM Co., Armonk, NY, USA). To calculate the intraexaminer performance, measurements were repeated by examiner 1 after 15 days on one-third of the samples, selected randomly. The difference in intraexaminer and interexaminer performance was quantified using the paired t-test. The comparison of measurements made on different types of dental models was evaluated using ANOVA with Bonferroni correction. The intraclass coefficient correlation (ICC) for consistency was calculated to establish examiner 1's reliability in all comparisons performed. The p-values < 0.05 were considered statistically significant. Measurement agreement of all comparisons was also assessed using the Bland-Altman method through means, standard deviations, and 95% limits of agreement, which were available as a table.
For evaluating clinically relevant differences, we used the values described in the literature.303132 Differences of more than 0.3 mm for the overjet, overbite, and tooth size (tooth diameter and tooth height) and more than 0.4 mm for the transverse and sagittal parameters were considered clinically relevant.3031 For differences in the sum of the mesiodistal diameter of 6 anterior teeth in the upper or lower dental arch, a threshold of 0.75 mm was used. For the sum of the mesiodistal diameter of 12 teeth in the upper or lower arch, a difference of 1.5 mm was used to register clinically relevant differences.32
RESULTS
Reliability
The intraexaminer performance for examiner 1 was evaluated. The mean difference was 0.07 mm for all measurements on the plaster models. For the Laser OA measurements, the mean difference was −0.06 mm. For the CT OA measurements, the mean difference was −0.05 mm. The intraexaminer mean difference for the Laser DM measurements was −0.01 mm and that for the CT DM measurements was 0.02 mm. The largest intraexaminer differences were found in the sum of the 12 upper teeth for plaster models (0.87 mm) for CT OA (−0.53 mm) and for CT DM (0.81 mm). The highest intraexaminer difference found on Laser OA was −0.83 mm for the sum of the 12 lower teeth. In Laser DM, the highest intraexaminer difference was 0.42 mm for the sum of the 6 upper teeth.
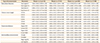
According to the paired t-test, examiners 1 and 2 presented excellent interexaminer reliability, with only a few statistically significant differences in the parameters selected. The highest difference was found in the right sagittal relationship, especially in CT OA and CT DM. The other parameters did not present any clinically relevant differences (Table 2). The average ICC of all parameters on the plaster models and on all combinations of digital models was 0.95, which showed excellent reliability for the measurements performed by examiner 1 (Table 3).
Measurements of all parameters
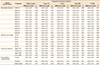
Measurements on 30 plaster models were compared with the measurements on each digital model by examiner 1 (Table 3). Positive values of average differences indicated that the measurements on the digital models were smaller than those on the plaster models, and negative values indicated that the measurements on the digital models were larger than those on the plaster models. None of the measurements showed statistically significant differences according to ANOVA with Bonferroni correction, but only a few measurements presented clinically relevant differences (Table 3). When the measurements of the mesiodistal diameter performed on digital models were compared to the same measurements performed on plaster models, none of the measurements presented any clinically relevant difference, except for Laser DM, which showed a clinically relevant difference (lower values) in the sum of the upper 6 teeth.
Clinically relevant differences were found in the crown height of tooth 16 on Laser OA and CT OA models. Among the transverse parameters, only the upper intercanine distance showed clinically relevant differences on the Laser DM and CT DM models. Among the intermaxillary measurements, only Laser OA presented clinically relevant differences in overbite. Only Laser DM presented a clinically relevant difference in the sagittal relationship parameters (Table 3).
Table 4 presents the Bland-Altman statistics, including the 95% limits of agreement, for the comparison between the plaster models and the different types of digital models. These results showed wider limits for the sum of dental diameters (2.93 mm on average) and the sagittal relationship parameters (2.59 mm on average), and narrower limits for the tooth crown height parameters (1.07 mm on average) and the overjet and overbite parameters (1.48 mm on average). The transverse parameters presented an average value of 1.98 mm on the 95% limits of agreement. The smallest 95% limit of agreement was 0.69 mm for the crown height of tooth 13 on the comparison between the plaster models and the CT OA models, while the largest 95% limit of agreement was 5.09 mm for the sum of the 12 lower teeth on the comparison between the plaster models and the Laser OA models. The higher difference in the latter comparison could be considered proportional to the measurements, because the average value of this parameter was 84.50 mm.
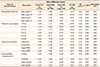
Table 5 presents the differences in measurements between the digital models from two different plaster models and measured using two different software programs. The results showed no statistically significant differences in any parameter according to ANOVA with Bonferroni's correction. Clinically relevant differences in mesiodistal diameters were found in the measurements of the sum of the 6 upper teeth (CT DM and Laser DM models), the sum of the 6 lower teeth (CT OA), and the sum of the 12 lower teeth (CT OA). No clinically relevant differences were found in the clinical crown height, transverse, and intermaxillary measurements (Table 5).
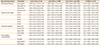
Table 6 presents the Bland-Altman statistics, including the 95% limits of agreement, between all comparisons of the different types of digital models. These results showed wider limits for the sum of dental diameters (3.12 mm on average) and the sagittal relationship parameters (2.52 mm on average), and narrower limits for the tooth crown height (1.22 mm on average) and the overjet and overbite parameters (1.09 mm on average). The transverse parameters presented an average value of 2.21 mm on the 95% limits of agreement. The smallest 95% limit of agreement was 0.30 mm for the overbite on the comparison between the Laser OA and Laser DM models, while the largest 95% limit of agreement was 5.12 mm for the sum of the 12 lower teeth on the comparison between the Laser OA and CT OA models, which was also considered proportional to the average value of the measurements.
DISCUSSION
Nowadays, orthodontists can use several types of plaster models and impression scanners with different technologies in combination with several measuring software programs. In this study, we used a laser scanner and a CT scanner to generate digital models from 30 plaster models. Although the laser scanner generates a digital model with subjectively better texture and greater detail than does the CT scanner, the accuracy of measurements on both digital models was similar. Several earlier studies have evaluated the accuracy of digital models generated by laser scanning plaster models,2789101112131415161718192021222324 and of digital models generated by CT scanning,72526 but only one study has compared the differences in the accuracy of measurements between these two processing methods. That study concluded the digital models generated by CT scanning were more accurate and reliable than the ones generated by laser scanning.7
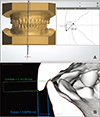
As shown in Table 3, Laser DM presented three measurements with clinically relevant differences compared to the plaster models: the sum of the 6 upper teeth, the upper intercanine distance, and the right sagittal relationship. For the measurements on Laser OA, only two parameters presented clinically relevant differences. For the CT OA and CT DM models, only one parameter showed clinically relevant differences. It can be concluded that the dental diameters and dental crown heights on digital models were reliable. The measurements of the upper intercanine distance and the overbite showed the largest differences. These differences could be caused not only by actual differences between the models but also by the subjectivity of the measurement method. For instance, the intercanine distance measurement can be hampered by some attrition of the canine, which can lead to misinterpretation of the cuspid landmark. Regarding the overbite, the thickness of the tip of the calipers may have contributed to inaccuracies in this measurement on plaster models.23 For measurements on digital models, the models could be magnified and a model cross-section (by “clipping the model”) could be made, which improves the accuracy of point identification compared to the measurement procedure on plaster models (Figure 2). Bland-Altman analysis showed acceptable 95% limits of agreement on the comparisons between the plaster models and different types of digital models. The sum of dental diameters presented wider limits of agreement, which is reasonable because these parameters presented the largest values (Table 4).
In the comparisons of the digital models, the crown height, transverse, and intermaxillary parameters did not present any clinically relevant difference, suggesting that it is easier to mark these points on digital models than on plaster models. Only the sum of the mesiodistal diameters presented clinically relevant differences for the four parameters (Table 5). On digital models, the user can fix the selected marking point with the click of the cursor, while on plaster models, mistakes can happen during measurement with the caliper, because there is no fixed marking of the landmarks.9 The results show that it is possible to use both software programs to measure a digital model generated using two different scanning methods, with no significant changes in the measurement outcomes. Although it seems easier to select the reference points on digital models when performing measurements using both software programs, because of the options to magnify, section, and rotate the images, some problems can occur when interpreting the reference points. Therefore, it is necessary to gain experience in performing accurate measurements by using the measurement software. Bland-Altman analysis showed acceptable 95% limits of agreement (1.99 mm on average) on the comparisons between the different types of digital models (Table 6).
For the laser-scanned models, the occlusion was acquired during the scanning process and could be adjusted if needed in the software, while the occlusion on the CT-scanned models was determined after the scanning process by dental technicians, who adjusted the relationship of the upper and lower models by using a dedicated software program that considered the scanned bite registration. The method used to obtain the interarch relationship in the CT models may cause some errors because of the subjectivity of the operator,532 but according to the results of this study, the interarch relationship measurements presented no clinically relevant differences.
As orthodontists can decide to make the records of a patient in their own clinic or refer a patient to a clinical diagnostic center, new technologies such as the fabrication of digital models and the analysis of these models with software programs must be accurate and reproducible. Different methods to make digital models and different software programs to analyze these models, to make treatment plans, and to perform computer-aided design/computer-aided manufacturing procedures to design and fabricate orthodontic appliances will be used. Moreover, the same software must be able to generate outputs in different file formats for the digital models because the files will be used for different purposes and by different professionals, such as orthodontists, maxillofacial surgeons, implantologists, and lab technicians. Therefore, it is important that all users irrespective of their background can measure similar distances with different software programs.
In our study, interexaminer reliability was excellent in most cases and good for some others; this finding is in accordance with that of previous studies.7914 The largest difference in the measurement values was for the sagittal relationship parameter for both the plaster and digital models, which could be caused by the misinterpretation of the location of the reference points by the different examiners, and could mainly have been due to attrition on the upper canines.
Finally, both plaster-scanning techniques and both software programs used can be considered accurate and interchangeable. Considering the magnitude of differences and all comparisons performed, the number of parameters with clinically relevant differences was very low; moreover, the differences were reasonable given the subjectivity of the measurement method and were similar to those described in previous studies. Furthermore, the differences were distributed across different parameters without being predominant in a specific parameter, and this could have happened by chance.
CONCLUSION
The null hypothesis of this study was confirmed. The digital models generated from a series of plaster models by using the R700 laser scanner and the Flash CT scanner are accurate and reliable and can replace conventional plaster models. Only a few clinically relevant differences in measurements were found. Measurements on these digital models performed using two different software programs are accurate; therefore, both fabrication methods and software programs can be used interchangeably.
 XML Download