Journal List > Yonsei Med J > v.61(2) > 1141541

Lee: Sociodemographic Factors Associated with Participation in Diabetes Education among Community-Dwelling Adults with Diabetes

Abstract

Purpose

This study investigated the sociodemographic factors associated with participation in diabetes self-management education (DSME) among community-dwelling adults with diabetes.

Materials and Methods

Data from 23400 people aged ≥30 years who were diagnosed with diabetes from the nationwide 2016 Korea Community Health Survey were analyzed. The relationship between sociodemographic factors and participation in DSME was examined by logistic regression analysis. The study sample was classified according to the type of institution providing DSME: hospitals/medical clinics (HMCs) and/or public health institutions (PHIs).

Results

Of the total sample population with diabetes, 27.2% had attended DSME programs, including 21.9% at HMCs, 4.0% at PHIs, and 1.3% at both types of institutions. As age increased and educational level and monthly household income decreased, the odds ratios (ORs) of participation in DSME decreased in a fully adjusted model. Respondents living in rural areas had lower ORs for attending DSME compared to those living in urban areas [OR, 0.85; 95% confidence interval (CI), 0.80–0.91]. Service/sales workers and mechanical/manual workers had lower ORs for attending DSME (OR, 0.84; 95% CI, 0.71–0.99; and OR, 0.81; 95% CI, 0.69–0.94, respectively) compared to professional/managerial workers. However, in the subgroup of participants receiving education at PHIs, the likelihood of participation in DSME increased as age increased, and respondents living in rural areas had higher ORs compared to those living in urban areas (OR, 1.73; 95% CI, 1.51–1.98).

Conclusion

Customized DSME programs targeting socioeconomically vulnerable groups, including residential region and reimbursement of DSME by public insurance, are needed to resolve the inequalities in participation in DSME.

INTRODUCTION

Diabetes mellitus is a serious health problem, and its global burden is continually increasing. The International Diabetes Federation estimated that the number of people with diabetes was 451 million in 2017, and that the figure is expected to increase to 693 million worldwide by 2045.1 In Korea, the prevalence of diabetes has been increasing rapidly, reaching 13.4% and 28.0% in individuals older than 30 and 65 years, respectively, in 2017.2 However, the treatment rate of Korean population with diabetes is 66.7%, and the control rate (hemoglobin A1c <6.5%) is only 32.9%, indicating the absence of adequate control.2
The effective management of diabetes can reduce the risk of complications in affected individuals. Diabetes self-management education (DSME) empowers people with diabetes to control the disease through education programs, including regular physical activity, nutrition therapy, smoking cessation, adherence to drug therapy, and preventive care practices. DSME has become essential as diabetes care has increasingly become the responsibility for people with diabetes, their families, and healthcare professionals. The American Diabetes Association recommends that people with diabetes should engage in DSME to improve their knowledge, skills, and the ability to control the disease.3 DSME can improve health status, clinical outcomes, and quality of life and reduce diabetes-related costs.4567 However, recent studies have shown that the rate of participation in DSME in Korea ranges from 15% to 53%.8910
Identifying sociodemographic factors related to attendance in DSME programs is crucial to achieve equality and increase the involvement of socioeconomically vulnerable groups in these programs. However, few studies have investigated these factors. This study investigated these factors in community-dwelling adults with diabetes using data from a nationwide Korean survey, and assessed whether these variables differed according to the type of institutions providing DSME.

MATERIALS AND METHODS

Study population

Data from the 2016 Korea Community Health Survey (KCHS) conducted by the Korean Centers for Disease Control and Prevention were analyzed. KCHS is an ongoing annual cross-sectional, nationwide survey that started in 2008. A sample of 900 participants from 253 community health centers was selected to obtain a sampling error of ±3% with a 95% confidence interval (CI) for each major health index in each center. KCHS used a two-stage sampling design and created a sample extraction frame by linking registered population data from the Ministry of Public Administration and Security with housing data from the Ministry of Land, Infrastructure, and Transport. In the first stage, the sampling area (Tong · Ban/Ri) was extracted as the probability proportional to size based on the number and types of households in the smallest administrative units (Dong/Eup · Myeon). In the second stage, the number of sample households was extracted from the sampling area using a systematic sampling method. All participants older than 19 years were interviewed by trained researchers using computer-assisted personal interviewing process. Using multistage stratified cluster sampling, the 2016 KCHS survey included 228452 family residents. Of the total respondents aged ≥30 years, 23862 were diagnosed with diabetes. After excluding 462 subjects with missing sociodemographic information, the final sample consisted of 23400 people. Written consent was obtained from all participants. The study protocol was approved by the Institutional Review Board of Wonkwang University Hospital (WKUH 2019-05-008).

Data

Information on sociodemographic variables, health behaviors, and health status were collected using standardized questionnaires. The evaluated variables were age group (30–39, 40–49, 50–59, 60–69, and ≥70 years of age), place of residence (rural or urban), marital status (married, divorced/separated, widowed, or single), educational level (informal education, primary school, middle school, high school, or college or higher), monthly household income (<1000, 1000–2999, 3000–4999, or ≥5000 thousand KRW), and type of occupation (professional/managerial worker, clerk, service/sales worker, agricultural/forestry/fishery worker, mechanical/manual worker, or homemaker/student).
Confounding variables included smoking status (never, former, or current smoker), alcohol consumption frequency (never, ≤1 time/month, or ≥2 times/month), previous diagnosis of hypertension (yes or no), self-perception of blood glucose level (yes or no), and insulin treatment (yes or no). The outcome variable (attendance to DSME programs) was evaluated using the following questions: “Have you ever participated in education on diabetes care (excluding consultations with doctors, nurses, or other professionals lasting less than 10 minutes)?” The respondents who answered “Yes” to this question were classified according to the type of institutions: hospitals/medical clinics (HMCs) and/or public health institutions (PHIs).

Statistical analysis

Variables were presented as frequency (percentages), and differences in sociodemographic variables related to participation in DSME were assessed using chi-square test. Logistic regression analysis was used to examine the association between these variables and involvement in DSME. Model 1 was unadjusted; model 2 was adjusted for sociodemographic variables; and model 3 was adjusted for sociodemographic variables, smoking status, frequency of alcohol consumption, previous diagnosis of hypertension, self-perception of blood glucose level, and insulin treatment. Odds ratios (ORs) with 95% CIs for participation in DSME according to the abovementioned variables were calculated. All statistical analyses were performed using SPSS software version 22.0 (IBM Co., Armonk, NY, USA). A p-value less than 0.05 was considered statistically significant.

RESULTS

Distribution of participation in DSME

Of the 23400 respondents with diabetes, 27.2% (n=6368) had attended DSME. Among them, 21.9% (n=5124) received education at HMCs, 4.0% (n=930) at PHIs, and 1.3% (n=314) at both types of institutions.

Characteristics of study population

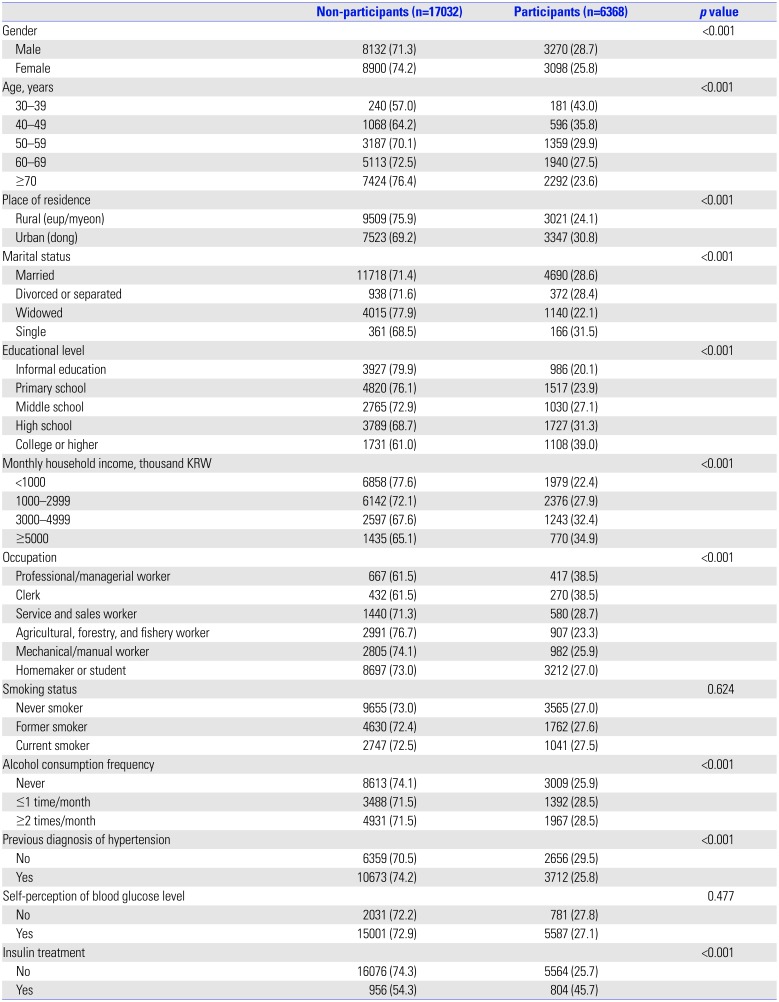
Sample characteristics are shown in Table 1. Gender, age, place of residence, marital status, educational level, monthly household income, and type of occupation significantly influenced the rate of participation in DSME (p<0.001). The proportion of DSME participants was significantly higher among males than in females. Urban residents (30.8%) also participated more in DSME than rural residents (24.1%) did. The percentage of people participating in DSME tended to decrease with increasing age, and tended to increase in parallel with increased education level and household income. Concerning different occupations, the proportion of DSME participants was the highest among professional/managerial workers and the lowest among agricultural/forestry/fishery workers. The percentage of participants was also higher among people receiving insulin treatment (Table 1). Participants in DSME were more likely to measure and know their HbA1c level, and to undergo screening for diabetic complications than non-participants. Participants also had relatively high rates of daily walking activity and moderate physical activity, while current drinking was higher (Supplementary Table 1, only online).
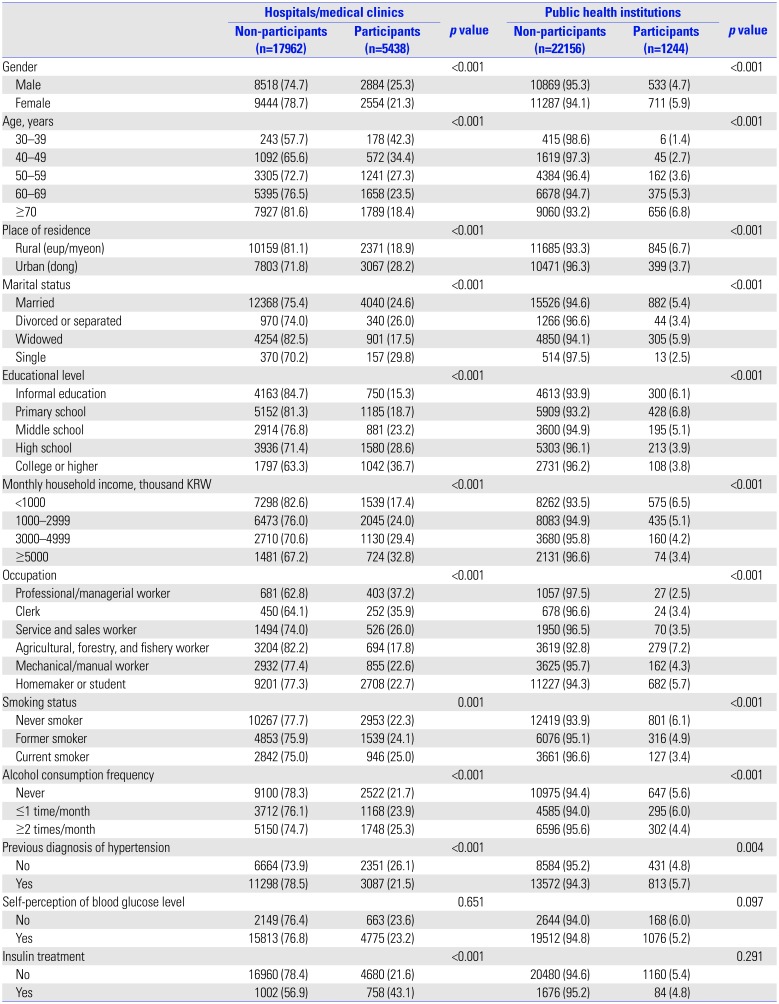
The general characteristics of subjects according to the type of institutions (HMCs or PHIs) are shown in Table 2. At HMCs and PHIs, all analyzed variables (gender, age, place of residence, marital status, educational level, monthly household income, and type of occupation) were significantly associated with the percentage of participation in DSME (p<0.001).

Factors associated with participation in DSME

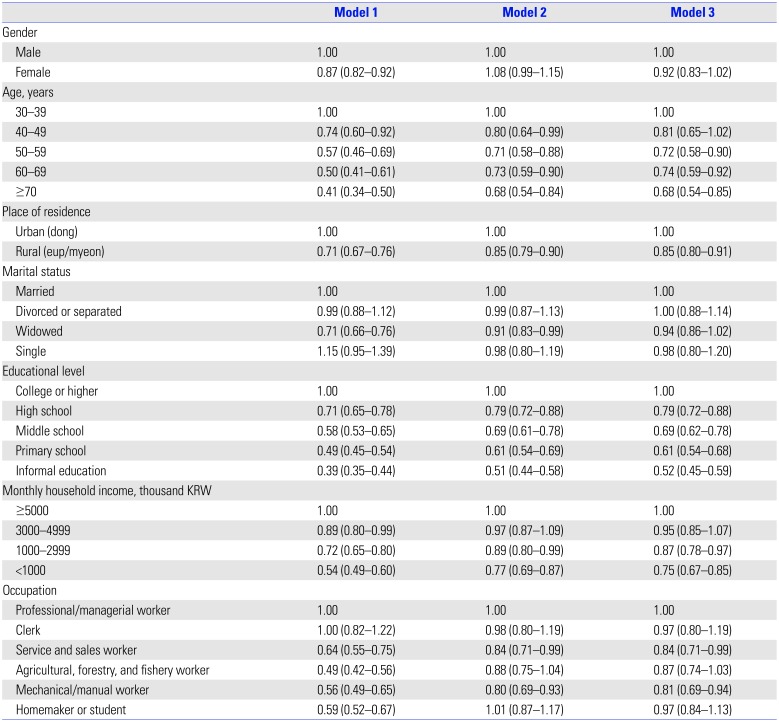
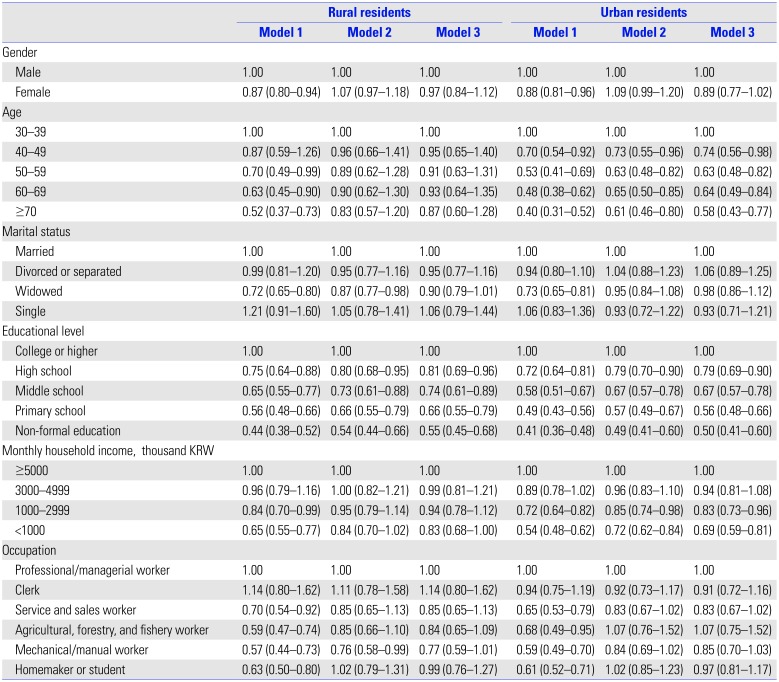
The relationship between sociodemographic factors and involvement in DSME was assessed by logistic regression analysis (Table 3). As age increased, the ORs for attending DSME decreased in models 1, 2, and 3: 50–59 years (ORmodel3, 0.72; 95% CI, 0.58–0.90), 60–69 years (ORmodel3, 0.74; 95% CI, 0.59–0.92), ≥70 years (ORmodel3, 0.68; 95% CI, 0.54–0.85) using the age group of 30–39 years as a reference. In all models, respondents living in rural areas had lower ORs for attending DSME compared to those living in urban areas (ORmodel3, 0.85; 95% CI, 0.80–0.91). In all models, as education level decreased, the ORs for attending DSME significantly decreased: high school (ORmodel3, 0.79; 95% CI, 0.72–0.88), middle school (ORmodel3, 0.69; 95% CI, 0.62–0.78), primary school (ORmodel3, 0.61; 95% CI, 0.5–0.68), and informal education (ORmodel3, 0.52; 95% CI, 0.4–0.59) compared to college or higher education. As the monthly household income decreased, the likelihood of attending DSME decreased in all models: 1000–2999 thousand KRW (ORmodel3, 0.87; 95% CI, 0.78–0.97), <1000 thousand KRW (ORmodel3, 0.75; 95% CI, 0.67–0.85) compared to ≥5000 thousand KRW. In model 1, the ORs were lower in four occupational groups (service/sales worker, agricultural/forestry/fishery worker, mechanical/manual worker, and homemaker/student) compared to professional/managerial worker group. However, after adjusting models 2 and 3, only service/sales worker (ORmodel3, 0.84; 95% CI, 0.71–0.99) and mechanical/manual worker (ORmodel3, 0.81; 95% CI, 0.69–0.94) groups had lower ORs. Gender and marital status were significantly associated with participation in DSME in models 1 and 2, but not in model 3 (Table 3). After dividing the study participants according to place of residence, the relationship between sociodemographic factors and DSME attendance was further evaluated separately for urban and rural residents (Table 4). Among rural residents, although significant associations between many sociodemographic factors and attending DSME were identified in models 1 and 2, only the OR for attending DSME significantly decreased with a lower educational level in model 3. On the other hand, among urban residents, age, educational level, and monthly household income were persistently associated with DSME attendance in all models.

Factors associated with participation in DSME by institution type

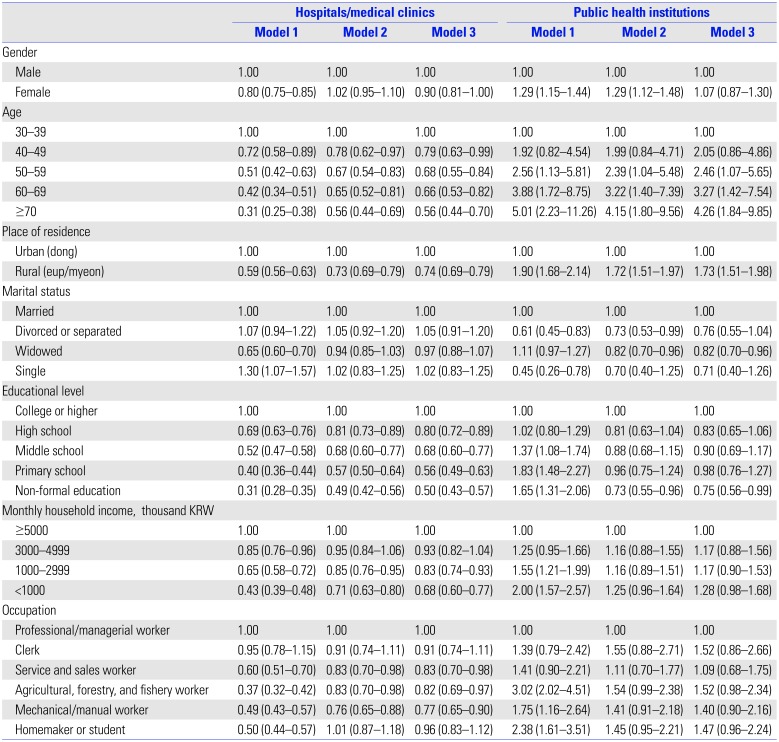
The relationship between sociodemographic factors and involvement in DSME according to the type of institutions (HMCs or PHIs) is shown in Table 5. Sociodemographic factors related to participation in DSME through HMCs were similar to those related to participation in DSME with total sample of participants (any participants in DSME through HMCs and/or PHIs) (Table 3). Older age, living in rural areas, lower education level, lower monthly household income, and type of occupation (service/sales worker, agricultural/forestry/fishery worker, mechanical/manual worker) had lower ORs for participation in DSME.
However, the factors associated with attendance to DSME programs were different between PHIs and HMCs. The ORs for attending DSME at PHIs increased as age increased: 50–59 years (ORmodel3, 2.46; 95% CI, 1.07–5.65), 60–69 years (ORmodel3, 3.27; 95% CI, 1.42–7.54), and ≥70 years (ORmodel3, 4.26; 95% CI, 1.84–9.85) using the age group of 30–39 years as a reference. Moreover, respondents living in rural areas had higher ORs for engaging in DSME at PHIs compared to those living in urban areas (ORmodel3, 1.73; 95% CI, 1.51–1.98). Widowed receiving education at PHIs had lower ORs than married people (ORmodel3, 0.82; 95% CI, 0.70–0.96) did. The ORs for attending DSME at PHIs in the group with informal education was lower (ORmodel3, 0.75; 95% CI, 0.56–0.99) than in the group with college or higher education. In addition, the likelihood of participation in DSME among agricultural/forestry/fishery worker and homemaker/student was higher at PHIs, with borderline significance (0.05≤p<0.10).

DISCUSSION

We identified the sociodemographic factors associated with participation in DSME in a large community-dwelling population with diabetes. Older age, living in rural areas, lower education level, lower monthly household income, and the type of occupation were significantly associated with lower overall attendance to DSME programs. However, older age, living in rural areas, and the type of occupation (agricultural/forestry/fishery worker and homemaker/student) were significantly associated with higher participation in DSME at PHIs.
Younger adults with diabetes showed lower diabetes self-efficacy for self-management, poorer self-management, and poorer glycemic control than older adults.11 Furthermore, given that the number of young adults with diabetes is increasing, higher engagement of younger people with diabetes in DSME is essential. Epidemiological studies have shown that older people with diabetes are less likely to engage in DSME.1213 Although previous studies in Korea reported that age was not an independent factor for attending DSME,810 the present results have shown that overall enrollment in DSME was relatively lower in older age groups. Furthermore, older people were more likely to attend DSME at PHIs than at HMCs. Therefore, the participation of older adults was lower as the overall percentage of people enrolling in DSME at HMCs was more than four times higher than at PHIs (23.2% vs. 5.3%).
Consistent with previous studies, education level was one of the most significant factors associated with enrollment in DSME.8101214 Compared to individuals with diabetes with college or higher education, people with diabetes with informal education were nearly half as likely to attend DSME. People with higher education may have more knowledge about diabetes and higher access to information on the importance of long-term management of diabetes.810 Moreover, educational level was inversely associated with the risk of cardiovascular disease and all-cause mortality.15
There are 33394 HMCs in Korea (3237 hospitals and 30157 clinics) and 3492 PHIs (252 health centers, 1336 secondary health care facilities, and 1904 primary healthcare facilities).16 In this study, residents living in rural areas participated less in DSME compared to those living in urban areas. Moreover, rural residents were 0.74 times less likely to engage in DSME at HMCs and 1.73 times more likely to attend DSME at PHIs. Since the proportion of people engaging in DSME at HMCs (23.2%) was approximately four times higher than that at PHIs (5.3%), the overall rate of participation in rural areas was significantly lower than that in urban areas, since most PHIs in Korea are located in rural areas. Among PHIs in Korea, there is one health center in each municipal-level administrative division (city, county, and district). Nonetheless, primary healthcare facilities (sub-health centers and primary healthcare posts) are located predominantly in rural areas (eup – myeon) across counties, which are vulnerable areas for medical services. Therefore, 93.5% of PHIs are distributed mainly in rural areas.16 Although the development of DSME programs at PHIs helps close the educational gap in rural and urban areas, the overall enrollment in DSME in rural areas is significantly lower than that in urban areas, since the proportion of PHIs in healthcare institutions is very small (9.5%).
Among the occupational groups, service/sales worker and manual worker groups engaged less in DSME. Agricultural/forestry/fishery worker group participated less in DSME at HMCs and more at PHIs (borderline significance). There were no significant differences in the attendance between agricultural/forestry/fishery worker and professional/managerial worker (reference) groups. Most (94.9%) of the agricultural/forestry/fishery workers lived in rural areas. Therefore, expanding DSME at both HMCs and PHIs located in rural areas is crucial to reduce the disparity in participation by region and occupation.
Comprehensive community education programs should be improved and expanded at HMCs and PHIs. In addition, diabetes education programs can be developed in the evenings and weekends to increase attendance by socioeconomically disadvantaged individuals with diabetes.12 The use of technology enables the rapid development of person-centered interventions that support self-management to improve access to education, especially for rural residents and people with low socioeconomic status.1718 A recent review article demonstrated that utilizing technology-enabled DSME significantly improved health outcomes.17 In addition, physician recommendation or encouragement may increase attendance at DSME.1920 Receiving regular primary care was the strongest predictor of participation in DSME, suggesting that DSME is not a substitute for diabetes treatment for people without a regular primary care physician.21
The present study showed that 27.2% of people with diabetes participated in DSME, which is lower than that in countries that provide reimbursement of costs for DSME by insurance. According to the Behavioral Risk Factor Surveillance System in the United States,12 more than half (53.7%) of people with diabetes reported engaging in DSME, among whom those without health insurance had a significantly lower DSME participation rate. A population-based study in Germany showed that 47% of type 2 diabetes patients participated in DSME.22 In Ontario, Canada, 30% of survey participants reported attending a diabetes education center.21 In countries like the United States and Germany, DSME for diabetes patients is an insurance benefit covered by both public and private health insurance services, since data indicate that the education of diabetes patients can reduce diabetes-related social costs. Reimbursement for DSME costs in the United States is available through the Centers for Medicare and Medicaid Services (CMS) and most private insurances policies, if the DSME program meets the standards set by a CMS-designed national accreditation organization. In Germany, diabetes education is fully compensated by German statutory health insurance. In Canada, in addition to medical treatment, health insurance benefits apply to both education and counselling. This means that patients with diabetes can receive integrated care from team-based health resources, including dieticians, nurses, and educators. Health insurance coverage is an important factor affecting diabetes education.1223 Therefore, in Korea, DSME should be reimbursed by the Korea National Health Insurance system to improve the healthcare of people with diabetes, and to reduce complications and costs.
There is one problem that must be discussed. Hypoglycemia is a common complication in both type 2 and type 1 diabetes patients that has serious clinical, social, and economic consequences, the frequency of which is likely to increase with the increasing prevalence of diabetes.24 Our results have shown that more than half (54.3%) of the people with diabetes using insulin do not participate in DSME. Since insulin users have a much higher risk of developing hypoglycemia,25 the lack of DSME participation among insulin users can be particularly dangerous. Careful titration of insulin therapy can achieve good glycemic control without the risk of hypoglycemia.26 Mitigation of hypoglycemic risks should include strategies for raising awareness of risks and prevention through education of patients and families. It is also important to take hypoglycemic risks into account when selecting medications and therapies for individual patients.27
This study had some limitations. First, the study's cross-sectional design did not allow for establishing a causal relationship. Second, the type of educators (doctors, nurses, or other specialists) and type of education (individual or group) were not identified,28 which limited the analysis of differences in sociodemographic factors according to the type of DSME. Third, recall bias may have affected the results, since information about enrollment in DSME was self-reported. Despite these limitations, our study had several strengths. First, data from a national survey were analyzed to study a large sample of community-based adults with diabetes. Second, several sociodemographic factors that could affect attendance at DSME were assessed to identify disparities in participation. Third, both the percentage of participation in DSME programs and type of institution providing these programs were determined to identify inequalities between institutions.
In conclusion, the rate of participation in DSME among community-dwelling adults with diabetes was 27.2%, including 21.9% at HMCs, 4.0% at PHIs, and 1.3% at both types of institution. Overall, older age, living in rural areas, lower education level, lower household income, and type of occupation were significantly correlated with lower participation in this program. DSME is a useful tool for managing diabetes, and it has been shown to improve health status, clinical outcomes, and the quality of life of patients. DSME implementation strategies that take into account the differences in regional characteristics and the distribution of medical care institutions in urban and rural areas are needed. In urban areas, DSME is needed for middle-aged and elderly, low-educated, and low-income people with diabetes, and it could be provided by actively utilizing HMCs. On the other hand, in rural areas, HMCs and PHIs should work together to provide DSME, especially for people with low level of education. Therefore, customized DSME programs targeting socioeconomically vulnerable groups, including residential region and reimbursement of DSME by public insurance, are needed to solve the inequalities in participation.

ACKNOWLEDGEMENTS

This research was supported by Wonkwang University in 2019.

Notes

The authors have no potential conflicts of interest to disclose.

References

1. Cho NH, Shaw JE, Karuranga S, Huang Y, da Rocha Fernandes JD, Ohlrogge AW, et al. IDF Diabetes Atlas: global estimates of diabetes prevalence for 2017 and projections for 2045. Diabetes Res Clin Pract. 2018; 138:271–281. PMID: 29496507.
crossref
2. Korea Centers for Disease Control and Prevention. The Seventh Korea National Health and Nutrition Examination Survey (KNHANES VII-2). 2017. accessed on 2019 April 9. Available at: https://knhanes.cdc.go.kr/knhanes/sub04/sub04_03.do?classType=7.
3. American Diabetes Association. 5. Lifestyle management: standards of medical care in diabetes-2019. Diabetes Care. 2019; 42:S46–S60. PMID: 30559231.
4. He X, Li J, Wang B, Yao Q, Li L, Song R, et al. Diabetes self-management education reduces risk of all-cause mortality in type 2 diabetes patients: a systematic review and meta-analysis. Endocrine. 2017; 55:712–731. PMID: 27837440.
crossref
5. Chrvala CA, Sherr D, Lipman RD. Diabetes self-management education for adults with type 2 diabetes mellitus: a systematic review of the effect on glycemic control. Patient Educ Couns. 2016; 99:926–943. PMID: 26658704.
crossref
6. Cochran J, Conn VS. Meta-analysis of quality of life outcomes following diabetes self-management training. Diabetes Educ. 2008; 34:815–823. PMID: 18832286.
crossref
7. Strawbridge LM, Lloyd JT, Meadow A, Riley GF, Howell BL. Oneyear outcomes of diabetes self-management training among medicare beneficiaries newly diagnosed with diabetes. Med Care. 2017; 55:391–397. PMID: 27753746.
crossref
8. Kim JM, Hong JW, Noh JH, Kim DJ. Factors associated with participation in diabetes education: The Korea National Health and Nutrition Examination Survey 2007 to 2009. Diabetes Metab J. 2016; 40:447–453. PMID: 27766791.
crossref
9. Jung JH, Lee JH, Noh JW, Park JE, Kim HS, Yoo JW, et al. Current status of management in type 2 diabetes mellitus at general hospitals in South Korea. Diabetes Metab J. 2015; 39:307–315. PMID: 26301192.
crossref
10. Kim HT, Lee K, Jung SY, Oh SM, Jeong SM, Choi YJ. Barrier factors to the completion of diabetes education in Korean diabetic adult patients: Korea National Health and Nutrition Examination Surveys 2007-2012. Korean J Fam Med. 2015; 36:203–209. PMID: 26435809.
crossref
11. Hessler DM, Fisher L, Mullan JT, Glasgow RE, Masharani U. Patient age: a neglected factor when considering disease management in adults with type 2 diabetes. Patient Educ Couns. 2011; 85:154–159. PMID: 21112720.
crossref
12. Adjei Boakye E, Varble A, Rojek R, Peavler O, Trainer AK, Osazuwa-Peters N, et al. Sociodemographic factors associated with engagement in diabetes self-management education among people with diabetes in the United States. Public Health Rep. 2018; 133:685–691. PMID: 30223759.
crossref
13. Cauch-Dudek K, Victor JC, Sigmond M, Shah BR. Disparities in attendance at diabetes self-management education programs after diagnosis in Ontario, Canada: a cohort study. BMC Public Health. 2013; 13:85. PMID: 23360373.
crossref
14. Rhee MK, Cook CB, El-Kebbi I, Lyles RH, Dunbar VG, Panayioto RM, et al. Barriers to diabetes education in urban patients: perceptions, patterns, and associated factors. Diabetes Educ. 2005; 31:410–417. PMID: 15919641.
crossref
15. Wu H, Lau ES, Kong AP, Ma RC, Ozaki R, Cheung KK, et al. Association between educational level and cardiovascular disease and all-cause mortality in patients with type 2 diabetes: a prospective study in the Joint Asia Diabetes Evaluation Program. Clin Epidemiol. 2018; 10:1561–1571. PMID: 30464636.
crossref
16. Ministry of Health and Welfare. Health and Welfare Statistical Yearbook 2017. accessed on 2019 April 10. Available at: http://www.mohw.go.kr/react/jb/sjb030301vw.jsp?PAR_MENU_ID=03&MENU_ID=032901&CONT_SEQ=343458.
17. Greenwood DA, Gee PM, Fatkin KJ, Peeples M. A systematic review of reviews evaluating technology-enabled diabetes self-management education and support. J Diabetes Sci Technol. 2017; 11:1015–1027. PMID: 28560898.
crossref
18. Mulvaney SA, Ritterband LM, Bosslet L. Mobile intervention design in diabetes: review and recommendations. Curr Diab Rep. 2011; 11:486–493. PMID: 21960031.
crossref
19. Peyrot M, Rubin RR, Funnell MM, Siminerio LM. Access to diabetes self-management education: results of national surveys of patients, educators, and physicians. Diabetes Educ. 2009; 35:246–263. PMID: 19208816.
20. Schäfer I, Pawels M, Küver C, Pohontsch NJ, Scherer M, van den Bussche H, et al. Strategies for improving participation in diabetes education. A qualitative study. PLoS One. 2014; 9:e95035. PMID: 24733428.
crossref
21. Shah BR, Booth GL. Predictors and effectiveness of diabetes selfmanagement education in clinical practice. Patient Educ Couns. 2009; 74:19–22. PMID: 18805668.
crossref
22. Icks A, Rathmann W, Haastert B, Mielck A, Holle R, Löwel H, et al. [Quality of care and extent of complications in a population-based sample of patients with type 2 diabetes mellitus. The KORA Survey 2000]. Dtsch Med Wochenschr. 2006; 131:73–78. PMID: 16418944.
23. Shaw K, Killeen M, Sullivan E, Bowman P. Disparities in diabetes self-management education for uninsured and underinsured adults. Diabetes Educ. 2011; 37:813–819. PMID: 22021026.
crossref
24. Silbert R, Salcido-Montenegro A, Rodriguez-Gutierrez R, Katabi A, McCoy RG. Hypoglycemia among patients with type 2 diabetes: epidemiology, risk factors, and prevention strategies. Curr Diab Rep. 2018; 18:53. PMID: 29931579.
crossref
25. Misra-Hebert AD, Pantalone KM, Ji X, Milinovich A, Dey T, Chagin KM, et al. Patient characteristics associated with severe hypoglycemia in a type 2 diabetes cohort in a large, integrated health care system from 2006 to 2015. Diabetes Care. 2018; 41:1164–1171. PMID: 29549082.
crossref
26. Barnett A. Dosing of insulin glargine in the treatment of type 2 diabetes. Clin Ther. 2007; 29:987–999. PMID: 17692716.
crossref
27. Ahrén B. Avoiding hypoglycemia: a key to success for glucoselowering therapy in type 2 diabetes. Vasc Health Risk Manag. 2013; 9:155–163. PMID: 23637538.
28. Steinsbekk A, Rygg LØ, Lisulo M, Rise MB, Fretheim A. Group based diabetes self-management education compared to routine treatment for people with type 2 diabetes mellitus. A systematic review with meta-analysis. BMC Health Serv Res. 2012; 12:213. PMID: 22824531.
crossref

SUPPLEMENTARY MATERIAL

Supplementary Table 1

Relating Characteristics of the Study Population According to Participation in Diabetes Self-Management Education
ymj-61-169-s001.pdf
Table 1

General Characteristics of the Study Population According to Participation in Diabetes Self-Management Education

ymj-61-169-i001
Non-participants (n=17032) Participants (n=6368) p value
Gender <0.001
 Male 8132 (71.3) 3270 (28.7)
 Female 8900 (74.2) 3098 (25.8)
Age, years <0.001
 30–39 240 (57.0) 181 (43.0)
 40–49 1068 (64.2) 596 (35.8)
 50–59 3187 (70.1) 1359 (29.9)
 60–69 5113 (72.5) 1940 (27.5)
 ≥70 7424 (76.4) 2292 (23.6)
Place of residence <0.001
 Rural (eup/myeon) 9509 (75.9) 3021 (24.1)
 Urban (dong) 7523 (69.2) 3347 (30.8)
Marital status <0.001
 Married 11718 (71.4) 4690 (28.6)
 Divorced or separated 938 (71.6) 372 (28.4)
 Widowed 4015 (77.9) 1140 (22.1)
 Single 361 (68.5) 166 (31.5)
Educational level <0.001
 Informal education 3927 (79.9) 986 (20.1)
 Primary school 4820 (76.1) 1517 (23.9)
 Middle school 2765 (72.9) 1030 (27.1)
 High school 3789 (68.7) 1727 (31.3)
 College or higher 1731 (61.0) 1108 (39.0)
Monthly household income, thousand KRW <0.001
 <1000 6858 (77.6) 1979 (22.4)
 1000–2999 6142 (72.1) 2376 (27.9)
 3000–4999 2597 (67.6) 1243 (32.4)
 ≥5000 1435 (65.1) 770 (34.9)
Occupation <0.001
 Professional/managerial worker 667 (61.5) 417 (38.5)
 Clerk 432 (61.5) 270 (38.5)
 Service and sales worker 1440 (71.3) 580 (28.7)
 Agricultural, forestry, and fishery worker 2991 (76.7) 907 (23.3)
 Mechanical/manual worker 2805 (74.1) 982 (25.9)
 Homemaker or student 8697 (73.0) 3212 (27.0)
Smoking status 0.624
 Never smoker 9655 (73.0) 3565 (27.0)
 Former smoker 4630 (72.4) 1762 (27.6)
 Current smoker 2747 (72.5) 1041 (27.5)
Alcohol consumption frequency <0.001
 Never 8613 (74.1) 3009 (25.9)
 ≤1 time/month 3488 (71.5) 1392 (28.5)
 ≥2 times/month 4931 (71.5) 1967 (28.5)
Previous diagnosis of hypertension <0.001
 No 6359 (70.5) 2656 (29.5)
 Yes 10673 (74.2) 3712 (25.8)
Self-perception of blood glucose level 0.477
 No 2031 (72.2) 781 (27.8)
 Yes 15001 (72.9) 5587 (27.1)
Insulin treatment <0.001
 No 16076 (74.3) 5564 (25.7)
 Yes 956 (54.3) 804 (45.7)

Data are presented as number (percentage).

Table 2

General Characteristics of the Study Population According to Participation in Diabetes Self-Management Education and the Type of Institution

ymj-61-169-i002
Hospitals/medical clinics p value Public health institutions p value
Non-participants (n=17962) Participants (n=5438) Non-participants (n=22156) Participants (n=1244)
Gender <0.001 <0.001
 Male 8518 (74.7) 2884 (25.3) 10869 (95.3) 533 (4.7)
 Female 9444 (78.7) 2554 (21.3) 11287 (94.1) 711 (5.9)
Age, years <0.001 <0.001
 30–39 243 (57.7) 178 (42.3) 415 (98.6) 6 (1.4)
 40–49 1092 (65.6) 572 (34.4) 1619 (97.3) 45 (2.7)
 50–59 3305 (72.7) 1241 (27.3) 4384 (96.4) 162 (3.6)
 60–69 5395 (76.5) 1658 (23.5) 6678 (94.7) 375 (5.3)
 ≥70 7927 (81.6) 1789 (18.4) 9060 (93.2) 656 (6.8)
Place of residence <0.001 <0.001
 Rural (eup/myeon) 10159 (81.1) 2371 (18.9) 11685 (93.3) 845 (6.7)
 Urban (dong) 7803 (71.8) 3067 (28.2) 10471 (96.3) 399 (3.7)
Marital status <0.001 <0.001
 Married 12368 (75.4) 4040 (24.6) 15526 (94.6) 882 (5.4)
 Divorced or separated 970 (74.0) 340 (26.0) 1266 (96.6) 44 (3.4)
 Widowed 4254 (82.5) 901 (17.5) 4850 (94.1) 305 (5.9)
 Single 370 (70.2) 157 (29.8) 514 (97.5) 13 (2.5)
Educational level <0.001 <0.001
 Informal education 4163 (84.7) 750 (15.3) 4613 (93.9) 300 (6.1)
 Primary school 5152 (81.3) 1185 (18.7) 5909 (93.2) 428 (6.8)
 Middle school 2914 (76.8) 881 (23.2) 3600 (94.9) 195 (5.1)
 High school 3936 (71.4) 1580 (28.6) 5303 (96.1) 213 (3.9)
 College or higher 1797 (63.3) 1042 (36.7) 2731 (96.2) 108 (3.8)
Monthly household income, thousand KRW <0.001 <0.001
<1000 7298 (82.6) 1539 (17.4) 8262 (93.5) 575 (6.5)
 1000–2999 6473 (76.0) 2045 (24.0) 8083 (94.9) 435 (5.1)
 3000–4999 2710 (70.6) 1130 (29.4) 3680 (95.8) 160 (4.2)
 ≥5000 1481 (67.2) 724 (32.8) 2131 (96.6) 74 (3.4)
Occupation <0.001 <0.001
 Professional/managerial worker 681 (62.8) 403 (37.2) 1057 (97.5) 27 (2.5)
 Clerk 450 (64.1) 252 (35.9) 678 (96.6) 24 (3.4)
 Service and sales worker 1494 (74.0) 526 (26.0) 1950 (96.5) 70 (3.5)
 Agricultural, forestry, and fishery worker 3204 (82.2) 694 (17.8) 3619 (92.8) 279 (7.2)
 Mechanical/manual worker 2932 (77.4) 855 (22.6) 3625 (95.7) 162 (4.3)
 Homemaker or student 9201 (77.3) 2708 (22.7) 11227 (94.3) 682 (5.7)
Smoking status 0.001 <0.001
 Never smoker 10267 (77.7) 2953 (22.3) 12419 (93.9) 801 (6.1)
 Former smoker 4853 (75.9) 1539 (24.1) 6076 (95.1) 316 (4.9)
 Current smoker 2842 (75.0) 946 (25.0) 3661 (96.6) 127 (3.4)
Alcohol consumption frequency <0.001 <0.001
 Never 9100 (78.3) 2522 (21.7) 10975 (94.4) 647 (5.6)
 ≤1 time/month 3712 (76.1) 1168 (23.9) 4585 (94.0) 295 (6.0)
 ≥2 times/month 5150 (74.7) 1748 (25.3) 6596 (95.6) 302 (4.4)
Previous diagnosis of hypertension <0.001 0.004
 No 6664 (73.9) 2351 (26.1) 8584 (95.2) 431 (4.8)
 Yes 11298 (78.5) 3087 (21.5) 13572 (94.3) 813 (5.7)
Self-perception of blood glucose level 0.651 0.097
 No 2149 (76.4) 663 (23.6) 2644 (94.0) 168 (6.0)
 Yes 15813 (76.8) 4775 (23.2) 19512 (94.8) 1076 (5.2)
Insulin treatment <0.001 0.291
 No 16960 (78.4) 4680 (21.6) 20480 (94.6) 1160 (5.4)
 Yes 1002 (56.9) 758 (43.1) 1676 (95.2) 84 (4.8)

Data are presented as number (percentage).

Table 3

Relationship between Sociodemographic Factors and Participation in Diabetes Self-Management Education

ymj-61-169-i003
Model 1 Model 2 Model 3
Gender
 Male 1.00 1.00 1.00
 Female 0.87 (0.82–0.92) 1.08 (0.99–1.15) 0.92 (0.83–1.02)
Age, years
 30–39 1.00 1.00 1.00
 40–49 0.74 (0.60–0.92) 0.80 (0.64–0.99) 0.81 (0.65–1.02)
 50–59 0.57 (0.46–0.69) 0.71 (0.58–0.88) 0.72 (0.58–0.90)
 60–69 0.50 (0.41–0.61) 0.73 (0.59–0.90) 0.74 (0.59–0.92)
 ≥70 0.41 (0.34–0.50) 0.68 (0.54–0.84) 0.68 (0.54–0.85)
Place of residence
 Urban (dong) 1.00 1.00 1.00
 Rural (eup/myeon) 0.71 (0.67–0.76) 0.85 (0.79–0.90) 0.85 (0.80–0.91)
Marital status
 Married 1.00 1.00 1.00
 Divorced or separated 0.99 (0.88–1.12) 0.99 (0.87–1.13) 1.00 (0.88–1.14)
 Widowed 0.71 (0.66–0.76) 0.91 (0.83–0.99) 0.94 (0.86–1.02)
 Single 1.15 (0.95–1.39) 0.98 (0.80–1.19) 0.98 (0.80–1.20)
Educational level
 College or higher 1.00 1.00 1.00
 High school 0.71 (0.65–0.78) 0.79 (0.72–0.88) 0.79 (0.72–0.88)
 Middle school 0.58 (0.53–0.65) 0.69 (0.61–0.78) 0.69 (0.62–0.78)
 Primary school 0.49 (0.45–0.54) 0.61 (0.54–0.69) 0.61 (0.54–0.68)
 Informal education 0.39 (0.35–0.44) 0.51 (0.44–0.58) 0.52 (0.45–0.59)
Monthly household income, thousand KRW
 ≥5000 1.00 1.00 1.00
 3000–4999 0.89 (0.80–0.99) 0.97 (0.87–1.09) 0.95 (0.85–1.07)
 1000–2999 0.72 (0.65–0.80) 0.89 (0.80–0.99) 0.87 (0.78–0.97)
 <1000 0.54 (0.49–0.60) 0.77 (0.69–0.87) 0.75 (0.67–0.85)
Occupation
 Professional/managerial worker 1.00 1.00 1.00
 Clerk 1.00 (0.82–1.22) 0.98 (0.80–1.19) 0.97 (0.80–1.19)
 Service and sales worker 0.64 (0.55–0.75) 0.84 (0.71–0.99) 0.84 (0.71–0.99)
 Agricultural, forestry, and fishery worker 0.49 (0.42–0.56) 0.88 (0.75–1.04) 0.87 (0.74–1.03)
 Mechanical/manual worker 0.56 (0.49–0.65) 0.80 (0.69–0.93) 0.81 (0.69–0.94)
 Homemaker or student 0.59 (0.52–0.67) 1.01 (0.87–1.17) 0.97 (0.84–1.13)

Data are presented as odds ratio (95% confidence interval). Model 1 was unadjusted; model 2 was adjusted for sociodemographic factors; and model 3 was adjusted for sociodemographic factors, smoking status, alcohol consumption frequency, previous diagnosis of hypertension, self-perception of blood glucose level, and insulin treatment.

Table 4

Relationship between Sociodemographic Factors and Participation in Diabetes Self-Management Education According to Residential Region

ymj-61-169-i004
Rural residents Urban residents
Model 1 Model 2 Model 3 Model 1 Model 2 Model 3
Gender
 Male 1.00 1.00 1.00 1.00 1.00 1.00
 Female 0.87 (0.80–0.94) 1.07 (0.97–1.18) 0.97 (0.84–1.12) 0.88 (0.81–0.96) 1.09 (0.99–1.20) 0.89 (0.77–1.02)
Age
 30–39 1.00 1.00 1.00 1.00 1.00 1.00
 40–49 0.87 (0.59–1.26) 0.96 (0.66–1.41) 0.95 (0.65–1.40) 0.70 (0.54–0.92) 0.73 (0.55–0.96) 0.74 (0.56–0.98)
 50–59 0.70 (0.49–0.99) 0.89 (0.62–1.28) 0.91 (0.63–1.31) 0.53 (0.41–0.69) 0.63 (0.48–0.82) 0.63 (0.48–0.82)
 60–69 0.63 (0.45–0.90) 0.90 (0.62–1.30) 0.93 (0.64–1.35) 0.48 (0.38–0.62) 0.65 (0.50–0.85) 0.64 (0.49–0.84)
 ≥70 0.52 (0.37–0.73) 0.83 (0.57–1.20) 0.87 (0.60–1.28) 0.40 (0.31–0.52) 0.61 (0.46–0.80) 0.58 (0.43–0.77)
Marital status
 Married 1.00 1.00 1.00 1.00 1.00 1.00
 Divorced or separated 0.99 (0.81–1.20) 0.95 (0.77–1.16) 0.95 (0.77–1.16) 0.94 (0.80–1.10) 1.04 (0.88–1.23) 1.06 (0.89–1.25)
 Widowed 0.72 (0.65–0.80) 0.87 (0.77–0.98) 0.90 (0.79–1.01) 0.73 (0.65–0.81) 0.95 (0.84–1.08) 0.98 (0.86–1.12)
 Single 1.21 (0.91–1.60) 1.05 (0.78–1.41) 1.06 (0.79–1.44) 1.06 (0.83–1.36) 0.93 (0.72–1.22) 0.93 (0.71–1.21)
Educational level
 College or higher 1.00 1.00 1.00 1.00 1.00 1.00
 High school 0.75 (0.64–0.88) 0.80 (0.68–0.95) 0.81 (0.69–0.96) 0.72 (0.64–0.81) 0.79 (0.70–0.90) 0.79 (0.69–0.90)
 Middle school 0.65 (0.55–0.77) 0.73 (0.61–0.88) 0.74 (0.61–0.89) 0.58 (0.51–0.67) 0.67 (0.57–0.78) 0.67 (0.57–0.78)
 Primary school 0.56 (0.48–0.66) 0.66 (0.55–0.79) 0.66 (0.55–0.79) 0.49 (0.43–0.56) 0.57 (0.49–0.67) 0.56 (0.48–0.66)
 Non-formal education 0.44 (0.38–0.52) 0.54 (0.44–0.66) 0.55 (0.45–0.68) 0.41 (0.36–0.48) 0.49 (0.41–0.60) 0.50 (0.41–0.60)
Monthly household income, thousand KRW
 ≥5000 1.00 1.00 1.00 1.00 1.00 1.00
 3000–4999 0.96 (0.79–1.16) 1.00 (0.82–1.21) 0.99 (0.81–1.21) 0.89 (0.78–1.02) 0.96 (0.83–1.10) 0.94 (0.81–1.08)
 1000–2999 0.84 (0.70–0.99) 0.95 (0.79–1.14) 0.94 (0.78–1.12) 0.72 (0.64–0.82) 0.85 (0.74–0.98) 0.83 (0.73–0.96)
 <1000 0.65 (0.55–0.77) 0.84 (0.70–1.02) 0.83 (0.68–1.00) 0.54 (0.48–0.62) 0.72 (0.62–0.84) 0.69 (0.59–0.81)
Occupation
 Professional/managerial worker 1.00 1.00 1.00 1.00 1.00 1.00
 Clerk 1.14 (0.80–1.62) 1.11 (0.78–1.58) 1.14 (0.80–1.62) 0.94 (0.75–1.19) 0.92 (0.73–1.17) 0.91 (0.72–1.16)
 Service and sales worker 0.70 (0.54–0.92) 0.85 (0.65–1.13) 0.85 (0.65–1.13) 0.65 (0.53–0.79) 0.83 (0.67–1.02) 0.83 (0.67–1.02)
 Agricultural, forestry, and fishery worker 0.59 (0.47–0.74) 0.85 (0.66–1.10) 0.84 (0.65–1.09) 0.68 (0.49–0.95) 1.07 (0.76–1.52) 1.07 (0.75–1.52)
 Mechanical/manual worker 0.57 (0.44–0.73) 0.76 (0.58–0.99) 0.77 (0.59–1.01) 0.59 (0.49–0.70) 0.84 (0.69–1.02) 0.85 (0.70–1.03)
 Homemaker or student 0.63 (0.50–0.80) 1.02 (0.79–1.31) 0.99 (0.76–1.27) 0.61 (0.52–0.71) 1.02 (0.85–1.23) 0.97 (0.81–1.17)

Data are presented as odds ratio (95% confidence interval). Model 1 is unadjusted; model 2 is adjusted for sociodemographic factors; and model 3 is adjusted for sociodemographic factors, smoking status, drinking frequency, diagnosis of hypertension, self-perception of blood glucose level, and insulin treatment.

Table 5

Relationship between Sociodemographic Factors and Participationin Diabetes Self-Management Education According to Institution Type

ymj-61-169-i005
Hospitals/medical clinics Public health institutions
Model 1 Model 2 Model 3 Model 1 Model 2 Model 3
Gender
 Male 1.00 1.00 1.00 1.00 1.00 1.00
 Female 0.80 (0.75–0.85) 1.02 (0.95–1.10) 0.90 (0.81–1.00) 1.29 (1.15–1.44) 1.29 (1.12–1.48) 1.07 (0.87–1.30)
Age
 30–39 1.00 1.00 1.00 1.00 1.00 1.00
 40–49 0.72 (0.58–0.89) 0.78 (0.62–0.97) 0.79 (0.63–0.99) 1.92 (0.82–4.54) 1.99 (0.84–4.71) 2.05 (0.86–4.86)
 50–59 0.51 (0.42–0.63) 0.67 (0.54–0.83) 0.68 (0.55–0.84) 2.56 (1.13–5.81) 2.39 (1.04–5.48) 2.46 (1.07–5.65)
 60–69 0.42 (0.34–0.51) 0.65 (0.52–0.81) 0.66 (0.53–0.82) 3.88 (1.72–8.75) 3.22 (1.40–7.39) 3.27 (1.42–7.54)
 ≥70 0.31 (0.25–0.38) 0.56 (0.44–0.69) 0.56 (0.44–0.70) 5.01 (2.23–11.26) 4.15 (1.80–9.56) 4.26 (1.84–9.85)
Place of residence
 Urban (dong) 1.00 1.00 1.00 1.00 1.00 1.00
 Rural (eup/myeon) 0.59 (0.56–0.63) 0.73 (0.69–0.79) 0.74 (0.69–0.79) 1.90 (1.68–2.14) 1.72 (1.51–1.97) 1.73 (1.51–1.98)
Marital status
 Married 1.00 1.00 1.00 1.00 1.00 1.00
 Divorced or separated 1.07 (0.94–1.22) 1.05 (0.92–1.20) 1.05 (0.91–1.20) 0.61 (0.45–0.83) 0.73 (0.53–0.99) 0.76 (0.55–1.04)
 Widowed 0.65 (0.60–0.70) 0.94 (0.85–1.03) 0.97 (0.88–1.07) 1.11 (0.97–1.27) 0.82 (0.70–0.96) 0.82 (0.70–0.96)
 Single 1.30 (1.07–1.57) 1.02 (0.83–1.25) 1.02 (0.83–1.25) 0.45 (0.26–0.78) 0.70 (0.40–1.25) 0.71 (0.40–1.26)
Educational level
 College or higher 1.00 1.00 1.00 1.00 1.00 1.00
 High school 0.69 (0.63–0.76) 0.81 (0.73–0.89) 0.80 (0.72–0.89) 1.02 (0.80–1.29) 0.81 (0.63–1.04) 0.83 (0.65–1.06)
 Middle school 0.52 (0.47–0.58) 0.68 (0.60–0.77) 0.68 (0.60–0.77) 1.37 (1.08–1.74) 0.88 (0.68–1.15) 0.90 (0.69–1.17)
 Primary school 0.40 (0.36–0.44) 0.57 (0.50–0.64) 0.56 (0.49–0.63) 1.83 (1.48–2.27) 0.96 (0.75–1.24) 0.98 (0.76–1.27)
 Non-formal education 0.31 (0.28–0.35) 0.49 (0.42–0.56) 0.50 (0.43–0.57) 1.65 (1.31–2.06) 0.73 (0.55–0.96) 0.75 (0.56–0.99)
Monthly household income, thousand KRW
 ≥5000 1.00 1.00 1.00 1.00 1.00 1.00
 3000–4999 0.85 (0.76–0.96) 0.95 (0.84–1.06) 0.93 (0.82–1.04) 1.25 (0.95–1.66) 1.16 (0.88–1.55) 1.17 (0.88–1.56)
 1000–2999 0.65 (0.58–0.72) 0.85 (0.76–0.95) 0.83 (0.74–0.93) 1.55 (1.21–1.99) 1.16 (0.89–1.51) 1.17 (0.90–1.53)
 <1000 0.43 (0.39–0.48) 0.71 (0.63–0.80) 0.68 (0.60–0.77) 2.00 (1.57–2.57) 1.25 (0.96–1.64) 1.28 (0.98–1.68)
Occupation
 Professional/managerial worker 1.00 1.00 1.00 1.00 1.00 1.00
 Clerk 0.95 (0.78–1.15) 0.91 (0.74–1.11) 0.91 (0.74–1.11) 1.39 (0.79–2.42) 1.55 (0.88–2.71) 1.52 (0.86–2.66)
 Service and sales worker 0.60 (0.51–0.70) 0.83 (0.70–0.98) 0.83 (0.70–0.98) 1.41 (0.90–2.21) 1.11 (0.70–1.77) 1.09 (0.68–1.75)
 Agricultural, forestry, and fishery worker 0.37 (0.32–0.42) 0.83 (0.70–0.98) 0.82 (0.69–0.97) 3.02 (2.02–4.51) 1.54 (0.99–2.38) 1.52 (0.98–2.34)
 Mechanical/manual worker 0.49 (0.43–0.57) 0.76 (0.65–0.88) 0.77 (0.65–0.90) 1.75 (1.16–2.64) 1.41 (0.91–2.18) 1.40 (0.90–2.16)
 Homemaker or student 0.50 (0.44–0.57) 1.01 (0.87–1.18) 0.96 (0.83–1.12) 2.38 (1.61–3.51) 1.45 (0.95–2.21) 1.47 (0.96–2.24)

Data are presented as odds ratio (95% confidence interval). Model 1 is unadjusted; model 2 is adjusted for sociodemographic factors; and model 3 is adjusted for sociodemographic factors, smoking status, drinking frequency, diagnosis of hypertension, self-perception of blood glucose level, and insulin treatment.

TOOLS
Similar articles