Journal List > Korean J Radiol > v.21(2) > 1141497

Peng, Zhao, Chang, Bai, Xu, and Ju: Quantification of Fat Concentration and Vascular Response in Brown and White Adipose Tissue of Rats by Spectral CT Imaging

Abstract

Objective

The purpose of the study was to non-invasively characterize and discriminate brown adipose tissue (BAT) from white adipose tissue (WAT) in rats using spectral computed tomography (CT) with histological validation.

Materials and Methods

A lipid-containing phantom (lipid fractions from 0% to 100%) was imaged with spectral CT. An in vivo, non-enhanced spectral CT scan was performed on 24 rats, and fat concentrations of BAT and WAT were measured. The rats were randomized to receive intraperitoneal treatment with norepinephrine (NE) (n = 12) or saline (n = 12). Non-enhanced and enhanced spectral CT scans were performed after treatment to measure the elevation of iodine in BAT and WAT. The BAT/aorta and WAT/aorta ratios were calculated and compared, after which isolated BAT and WAT samples were subjected to histological and uncoupling protein 1 (UCP1) analyses.

Results

The ex-vivo phantom study showed excellent linear fit between measured fat concentration and the known gravimetric reference standard (r2 = 0.996). In vivo, BAT had significantly lower fat concentration than WAT (p < 0.001). Compared to the saline group, the iodine concentration of BAT increased significantly (p < 0.001) after injection of NE, while the iodine concentration of WAT only changed slightly. The BAT/aorta ratio also increased significantly after exposure to NE compared to the saline group (p < 0.001). Histological and UCP1 expression analyses supported the spectral CT imaging results.

Conclusion

The study consolidates spectral CT as a new approach for non-invasive imaging of BAT and WAT. Quantitative analyses of BAT and WAT by spectral CT revealed different characteristics and pharmacologic activations in the two types of adipose tissue.

INTRODUCTION

Two types of adipose tissue with essentially antagonistic functions are found in mammals; white adipose tissue (WAT) serves as a major energy reserve, while brown adipose tissue (BAT) dissipates energy through the production of heat. BAT is abundant in small mammals (e.g., mice, rats) and newborns (1), providing a vital source of heat to maintain their body temperature. The structural and metabolic characteristics of WAT and BAT are quite different (2). WAT is characterized by large adipocytes that contain unilocular lipid droplets, a displaced peripheral nucleus, and limited cytoplasm (3). In contrast, BAT contains smaller adipocytes with multiple intracellular lipid droplets, a centrally located nucleus, an abundance of iron-rich mitochondria, and uncoupling protein 1 (UCP1) (45). BAT is also densely vascularized by capillaries, which transport and disperse the produced heat (46). From a clinical perspective, BAT is of great interest as a potential target in the treatment of obesity and associated metabolic disorders (7). Therefore, it is to adopt a technique that accurately detects and distinguishes BAT from WAT.
In adult humans, BAT has long been considered absent; however, some investigations have shown that BAT also exists in adult human bodies and plays an important role in energy homeostasis in adults (789). Several studies using 18F-fluorodeoxyglucose positron emission tomography scans coupled with computed tomography (18F-FDG-PET/CT) have non-invasively confirmed the presence of metabolically active BAT in adult humans in vivo (10111213). However, one main drawback of using PET/CT in the detection of BAT is the risk associated with using radioactive trackers (e.g., FDG in PET). Moreover, it could yield confounding results. For example, a malignant neoplasm in the neck and upper chest region also leads to increased uptake of 18F-FDG (10), similar to that which occurs in the hypermetabolism of BAT, and therefore, produces images which are indistinguishable from those of BAT.
The present study was designed to demonstrate the potential of spectral CT in characterizing BAT and discriminating it from WAT. Contrary to traditional CT, spectral CT enables the simultaneous acquisition of imaging data with two different energy levels (i.e., 80/140 kVp). Such imaging allows the differentiation of material due to differences in the photo and Compton effect on CT attenuation at different photon energies (1415), also known as materials decomposition (MDs).
The purpose of this study was twofold. During the ex-vivo stage, a lipid-containing phantom was employed to evaluate the feasibility of using spectral CT for the characterization of fat content. At the in vivo stage, fat-water MD images provided by a baseline non-enhanced spectral CT were used to estimate the fat concentrations in BAT and WAT. Furthermore, we evaluated BAT and WAT activations after the injection of norepinephrine (NE) by comparing the results from a non-enhanced and enhanced spectral CT. Due to the abundance of capillaries in BAT, we expected the increase in blood flow with the injection of NE injection to lead to an increase in iodine concentration and to be reflected in the enhanced spectral CT.

MATERIALS AND METHODS

Lipid/Water Phantoms

Lipid-containing phantoms were made by mixing calibrated amounts of water (doped with 0.2 mM MnCl2) and extra virgin olive oil (Olivoila, Shanghai, China) using the protocol published by Peng et al. (16). Percentages of oil ranged from 0% to 100% by volume with an interval of 10% in a set of phantoms. Additional details about phantoms have been described in our previous study (16).

Animals

This animal study was approved by the Institutional Animal Care and Use Committee of the Medical School of Southeast University (approval ID: SYXK-2010.4987). Thirty Wistar rats (male, 14 weeks old, weighing 308 ± 27 g) were obtained from the Laboratory Animal Center of the Academy of Military Medical Science. Twenty-four of the rats were used in the main experiment (12 in the NE group and 12 in the saline group), while the other six were only used to obtain the time-enhancement curve after injection of the contrast agent. All the rats were fed a normal diet and maintained at a normal room temperature of 20–24℃ before the experiment. At the beginning of the experiment, the rats were anesthetized with an intraperitoneal injection of ketamine (100 mg/kg) and xylazine (10 mg/kg). Their core body temperatures were kept constant at 24℃ (normothermia to ensure the normal function of BAT) in the CT scan room during the entire experiment.

Spectral CT Examinations and Image Analysis

Figure 1 illustrates the schematic representation of the procedure of the in vivo study. Spectral CT images were taken before sacrificing each rat to obtain samples for histology. CT examinations were conducted using a Discovery CT750 HD scanner (GE Healthcare, Milwaukee, WI, USA). Two rats were placed in the prone position on the scanner bed side-by-side (Fig. 1). The scan coverage spanned the head to the proximal end of the tail.
A non-enhanced spectral CT scan was performed using the following parameters: fast tube voltage switching between 80 and 140 kVp, tube current of 260 mA, rotation speed of 0.8 seconds, helical pitch of 0.984, collimation thickness of 1.25 mm at an interval of 1.25 mm, image slice thickness of 1.25 mm, a 20-cm field-of-view, and a 512 × 512 reconstruction matrix. The spectral CT data were transmitted to workstation AW 4.6 (GE Healthcare, Boston, MA, USA), and a set of MD images were reconstructed using the GSI Viewer software (GE Healthcare, Boston, MA, USA). MD is achieved by mathematically decomposing the unknown imaged subject at each voxel into combinations of pre-selected pairs of known basis materials. Fat-water was selected as a basis material pair for this scan.
Two circular regions of interest (ROIs) of approximately 4 mm2 were precisely drawn in the BAT over the interscapular region and in the WAT over the perigonadal region, while avoiding muscle and other tissues as much as possible. The selection of the ROIs was based on the anatomical locations of BAT and WAT (17). Material concentrations (in milligrams per cm3) of the basic materials within the ROIs were obtained from GSI Viewer. Next, the animals were randomly divided into two groups. Twelve rats were injected with NE (Norepinephrine Bitartrate Injection, Bedford Laboratories, Bedford, OH, USA) while the other 12 were injected with saline. The injections in both groups were performed using 26 G catheters placed in the tail veins at a rate of 1 µg/kg/min for 10 minutes. Another non-enhanced spectral CT was performed immediately after the administration of the NE/saline injection and was used as the baseline scan.
After the non-enhanced scan, contrast agent (iopromide 300, 2 g iodine/kg) was injected into the tail vein of the rats at a dosage of 6 mL/kg and a rate of 0.2 mL/sec (Injection system, Mallinckrodt Pharmaceuticals, Cincinnati, OH, USA). An enhanced spectral CT was performed within 24–26 seconds to evaluate the blood flow changes of BAT and WAT after NE injection. To ensure that the timing of the enhanced spectral CT scan was in the ‘up-slope’ and not in the equilibrium phase of the time-enhancement curve, six additional rats were used to obtain the full time-enhancement curve at BAT with the following settings: tube current of 40 mA, monitoring inter-scan delay of 1 second, rotation time of 1 second, measurement of 30 and slice thickness of 1.25 mm. As shown in Figure 2, the time-enhancement curve of BAT did not reach plateau until 30 seconds after injection of the contrast agent, which confirmed that the timing of the enhanced spectral CT scan was in the ‘up-slope’ phase. Other CT scanning parameters were identical to those of non-enhanced CT exam.
MD images of iodine-water were reconstructed for the NE and saline groups from the baseline non-enhanced and enhanced spectral CT data. We used the increase in iodine concentration above baseline in WAT and BAT as a surrogate measure of perfusion. Additionally, the iodine concentrations in BAT and WAT were normalized to that in the aorta to minimize inter-subject variations in arterial iodine concentration. The iodine concentration ratios such as BAT/aorta and WAT/aorta were then calculated.

Histopathology

After completion of all the CT examinations, each rat was perfused transcardially with phosphate-buffered saline, followed by freshly prepared 4% paraformaldehyde in 0.1 M phosphate buffer (pH 7.4). A portion of the visceral WAT and BAT in the interscapular region were fixed, dehydrated, embedded, and transversely sectioned into 5-µm-thick slices for hematoxylin and eosin (H&E) staining, as well as immunohistochemistry for UCP1, CD31, and alpha-smooth muscle actin (α-SMA). All histopathology slides were then examined, and fat content and UCP1 analyses were performed using the histological semi-automatic vacuole segmentation procedure (HIS-S) developed with the MATLAB software (The MathWorks, Inc., Natick, MA, USA) (18). A pathologist manually excluded artificial areas, such as blood vessels. The percentages of fat and UCP1 identified using HIS-S were calculated with the following formulae:
Fat content by HIS-S = area of fat / total tissue area
UCP1 content by HIS-S = the area of UCP1-positive zone / the total tissue area
The microvessel densities of WAT and BAT were calculated from serial sections stained with the anti-rat CD31 (Santa Cruz Biotechnology Inc, Dallas, TX, USA) antibody. Small vessels were identified with positive α-SMA staining.

Statistical Analysis

All statistical analyses were performed using SPSS for Windows, version 11.0 (SPSS Inc., Chicago, IL, USA). Numerical data were reported as means ± standard deviation. The Pearson correlation test was performed between lipid concentrations from the spectral CT and the known gravimetric reference standard of the phantoms. Independent sample t tests were performed to analyze the fat concentrations between BAT and WAT using the spectral CT and histopathology results. Paired t tests were also performed to differentiate between the iodine concentrations of BAT and WAT before and after contrast enhancement. Independent-sample t tests were also implemented to analyze the iodine concentrations of BAT and WAT between the NE and saline groups. A p value of less than 0.05 was considered statistically significant.

RESULTS

Quantification of Lipid in Phantoms Using Non-Enhanced Spectral CT

Figure 3A shows the spectral CT imaging of the phantoms at different lipid concentrations. The measured fat fraction has a strong linear correlation with the known gravimetric reference standard (fat: r2 = 0.996, p < 0.001) (Fig. 3B).

Characterization of BAT in Rats Using Non-Enhanced Spectral CT

The differences in the fat fraction between WAT and BAT were evaluated by non-enhanced spectral CT imaging (Fig. 4A). Quantitative results indicated that the fat concentration of BAT was significantly lower than that of WAT (603.17 ± 148.10 mg/cm3 vs. 1434.53 ± 155.50 mg/cm3, p < 0.001) (Fig. 4B).
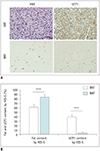
Histopathology results confirmed the findings from the non-enhanced spectral CT. H&E staining (Fig. 5A, left column) revealed that WAT contained mature adipocytes, which were uniformly characterized by the presence of large, unilocular lipid droplets. BAT contained multilocular lipid droplets and a brightly eosinophilic cytoplasm. The fat content of BAT was significantly lower than that of WAT as determined by HIS-S (p < 0.001) (Fig. 5B). The immunohistochemical staining for the detection of UCP1 (Fig. 5A, right column) showed that BAT has mitochondria-rich and strongly UCP1-positive multilocular adipocytes. The UCP1 content of BAT was significant higher compared to WAT as determined by HIS-S (p < 0.001) (Fig. 5B).

Quantification of the Vascular Response in Rodent BAT Using Enhanced Spectral CT

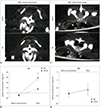
Since BAT has abundant β3-adrenergic receptors and NE is the β3-adrenergic receptor agonist, we hypothesized that BAT was activated after the injection of NE (19). As shown in Figure 6A and B, iodine concentration of BAT at baseline was the same between the NE and saline groups (−3.92 ± −2.3 mg/cm3 vs. −4.81 ± −2.59 mg/cm3, p > 0.05). After the injection of contrast media, the iodine concentration increased in both groups, with a more remarkable enhancement in the NE group; the iodine concentration of BAT in the NE group was significantly higher than that in the saline group (NE: 28.75 ± 5.70 mg/cm3; saline: 7.49 ± 3.70 mg/cm3, p < 0.001) (Fig. 6B).
For WAT, however, there was no significant difference in iodine concentration between the NE and saline groups either in the non-enhanced or enhanced spectral CT phases (NE: from −13.36 ± −2.09 mg/cm3 to −11.13 ± 3.29 mg/cm3; saline: from −13.77 ± 2.05 mg/cm3 to −11.10 ± 4.25 mg/cm3, p > 0.05) (Fig. 6C, D).
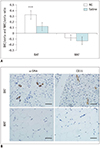
To minimize the inter-subject variations in arterial iodine concentration, we calculated the BAT/aorta and WAT/aorta ratios to reflect the vascular response more accurately. The BAT/aorta ratio of the iodine concentration in the NE group (0.32 ± 0.07) was significantly higher compared to that in the saline group (0.12 ± 0.07; p < 0.001) (Fig. 7A). In contrast, there was no significant difference in the WAT/aorta ratio between the NE and saline groups (−0.08 ± 0.03 vs. −0.13 ± 0.07, p > 0.05) (Fig. 7A).
Immunohistochemical staining with CD31 and α-SMA showed that the number of small vessels and capillaries in the BAT samples was significantly higher than that in the WAT samples (Fig. 7B), supporting the vascular response after NE infusion in contrast-enhanced spectral CT.

DISCUSSION

In our study, the quantification of fat concentration by non-enhanced spectral CT revealed the different characteristics between BAT and WAT. Furthermore, the iodine concentration obtained from contrast-enhanced spectral CT detected a different vascular response to pharmacologic activation of BAT.
Spectral CT has offered direct and accurate quantification of fat in phantoms (10%, 20%, 30%, 50%, 100%) using MD (20), similar to what we found in phantoms (percentages of fat ranged from 0% to 100% by volume with an interval of 10%). A number of magnetic resonance (MR) methods have been proposed for the fat quantification as follows: Dixon, chemical shift selective images, and 1H-MR spectroscopy (17). However, the scan time for spectral CT was much shorter than that for MR methods. Some studies conducted liver fat quantification using spectral CT and compared them to the results of MR methods (2021).
Adipocytes in BAT contain many multilocular and small lipid droplets and a lower content of triglycerides (4). BAT adipocytes also have a relatively high number of mitochondria that contain red-brownish iron content and a sufficient amount of the mitochondrial protein UCP1 to regulate non-shivering thermogenesis (5). Spectral CT imaging presented us with a quantifiable parameter, namely the material density values. The density value of all materials can be expressed as the weighted sum of the densities of two base material pairs, for example, fat and water or iodine and water. Base material pairs are used to potentially represent the material compositions of the ROI. These density values are expressed mathematically and reflect the measured attenuation in projection (22). In our study, we selected fat-water as the base material pairs which closely represent the fat/water concentrations in both types of adipose tissue to improve the detection sensitivity. This was confirmed with the less fat content of BAT compared to WAT in the histological analysis. However, it's also interesting to evaluate WAT by spectral CT, such as quantitative analysis of creeping fat to assess the severity of inflammation in patients with ileo-colonic Crohn's disease (23).
BAT has abundant β3-adrenergic receptors and NE is the β3-adrenergic receptor agonist. The effect of NE was verified by an increase in systemic blood pressure and heart rate (1924). The abundant number of blood capillaries in BAT ensures adequate exposure to nutrients and oxygen (25). Activation of BAT by the sympathetic nervous system results in increased blood flow to the tissue, which is necessary to provide a sufficient supply of oxygen, lipids, and glucose to BAT (26). Additionally, the increased blood flow helps dissipate the heat produced in BAT throughout the rest of the body. One objective of this study was to investigate whether the changes in BAT blood flow are coupled to the changes in BAT activation. BAT activation was demonstrated by an increase in iodine concentration of BAT after the injection of NE in the contrast enhanced spectral CT in our study. In contrast, WAT was expected to be inert and unresponsive to NE. Cypess et al. (27) demonstrated the relationship between the increase in tissue perfusion and glucose uptake of BAT after pharmacological stimulation with a β3-adrenergic receptor agonist using 99m Tc-methoxyisobutylisonitrile single-photon emission CT and 18F-FDG PET/CT. Lau et al. (28) demonstrated that BAT metabolic conversion of pre-polarized pyruvate was observed using hyperpolarized 13C imaging at baseline and under NE-stimulated conditions. Although contrast-enhanced ultrasound using microbubbles can measure the increase 15-fold in blood flow associated with NE-induced BAT stimulation (29), other differences and changes between BAT and WAT cannot be evaluated. In our study, we assessed the changes of an increased iodine content in BAT after injecting NE using contrast-enhanced spectral CT imaging, but WAT failed to increase iodine content after NE injection. To minimize the inter-subject variations in arterial iodine concentration, the BAT/aorta and WAT/aorta ratios were calculated, also demonstrating the higher vascular response in BAT compared to WAT.
We recognize several limitations in our study. Firstly, based on the results from Baron et al. (29), the use of a jugular venous line for the infusion of contrast agent has been found to be feasible. In our study, contrast agent was injected via the tail vein, as well as through the less invasive approach of infusion. Future studies should demonstrate the differences between using the two venous lines. Secondly, Park et al. (30) also reported that the BAT uptake was substantially increased by a single stimulation with β3 agonist using 18F-FDG-PET/CT. However, their results demonstrated that uptake in inguinal WAT was gradually increased to BAT levels by prolonged stimulation for 10 days. Our study only observed the difference after the first stimulation by β3 agonist using spectral CT, but the long effect was not investigated. Thirdly, BAT has abundant blood capillaries and β3-adrenergic receptors. It is also feasible to combine perfusion-weighted CT imaging to monitor the responses of β3 agonists in BAT and WAT.
In conclusion, we have characterized BAT, WAT, and muscle tissues in rats using spectral CT imaging techniques. MD demonstrated that BAT had a lower fat content, a higher water fraction, and higher vascularization compared to WAT. The histology and UCP1 measurements supported our imaging results. Spectral CT, thus, provides a new, non-invasive method that can be translated to the clinical setting for evaluating the differences between BAT and WAT. Clinical validation of this method will most likely expand the scope and flexibility of future BAT studies.

Figures and Tables

Fig. 1

Schematic procedure of study.

First, non-enhanced spectral CT scan was performed on all animals, and fat concentration and baseline iodine concentration of BAT and WAT were measured. Rats were then randomly divided into NE group (n = 12) and saline group (n = 12) injected with NE and saline, respectively. NE infusion was performed, followed by contrast-enhanced spectral CT, which measured changes in iodine concentrations of BAT and WAT. BAT = brown adipose tissue, NE = norepinephrine, WAT = white adipose tissue
kjr-21-248-g001
Fig. 2

Time-enhancement curve in BAT with injection of contrast medium.

A. ROI (red circle) was placed on BAT of interscapular region. B. Zero point on x-axis is starting point of contrast medium injection. Vertical gray bar indicates time of contrast-enhanced spectral CT scan. ROI = region of interest
kjr-21-248-g002
Fig. 3

Lipid-containing phantom imaging by spectral CT (lipid fraction ranging from 0% to 100%).

A. Fat-base imaging of phantom. B. Graph showing strong correlation between known lipid content (%) and fat concentration measured by spectral CT (r2 = 0.996, p < 0.001).
kjr-21-248-g003
Fig. 4

Examples of fat-based material decomposition image of BAT and WAT.

A. Red circles indicate positions of ROIs used to calculate material concentrations. B. Fat concentrations of selected ROIs on BAT and WAT. Fat concentration was significantly lower in BAT than in WAT. ***p < 0.001.
kjr-21-248-g004
Fig. 5

Histological characteristics of BAT and WAT.

A. Histological analysis of BAT and WAT sections, including H&E staining and immunohistochemistry of UCP1 (× 400; scale bar, 50 µm). B. Adipocyte size of WAT was significantly larger than that of BAT. UCP1 content of BAT was significantly higher than that of WAT. ***p < 0.001. H&E = hematoxylin and eosin, HIS-S = histological semi-automatic vacuole segmentation procedure, UCP1 = uncoupling protein 1
kjr-21-248-g005
Fig. 6

Quantification of iodine concentration in BAT and WAT after NE injection by contrast-enhanced spectral CT.

A, B. Changes in iodine concentration in BAT (yellow circle) after saline or NE injection. B. Although iodine concentration was not different between two groups at baseline, it increased considerably greater in NE group than in saline group in contrast-enhanced spectral CT imaging. C, D. Changes in iodine concentration in WAT (yellow circle) after saline or NE. D. No significant changes in iodine concentration was observed in WAT in both groups. Limited increase in iodine concentration from baseline to contrast-enhanced spectral CT was observed. ***p < 0.001.
kjr-21-248-g006
Fig. 7

Comparisons of vasculization of BAT and WAT.

A. BAT/aorta ratio of iodine concentration in NE group (0.32 ± 0.07) was significantly higher compared to saline group (0.12 ± 0.07; p < 0.001). In contrast, there was no significant difference in WAT/aorta ratio between NE (−0.08 ± 0.03) and saline (−0.13 ± 0.07) groups (p > 0.05). B. Immunohistochemical analysis of BAT and WAT for α-SMA and CD31 (× 400; scale bar, 50 µm) demonstrated larger number of micro-vessels in BAT. ***p < 0.001. α-SMA = alpha-smooth muscle actin
kjr-21-248-g007

Notes

This study has received funding by National Nature Science Foundation of China (NSFC, No. 81871412, No. 81601547, and No. 81501523), Jiangsu Provincial Science and Technique Program (BK20151423, BK20160703), Fundamental Research Funds for the Central Universities (No. 2242018k30004).

Conflicts of Interest The authors have no potential conflicts of interest to disclose.

References

1. Dawkins MJ, Scopes JW. Non-shivering thermogenesis and brown adipose tissue in the human new-born infant. Nature. 1965; 206:201–202.
crossref
2. Cannon B, Nedergaard J. Brown adipose tissue: function and physiological significance. Physiol Rev. 2004; 84:277–359.
crossref pmid
3. Oelkrug R, Polymeropoulos ET, Jastroch M. Brown adipose tissue: physiological function and evolutionary significance. J Comp Physiol B. 2015; 185:587–606.
crossref pmid
4. Giralt M, Villarroya F. White, brown, beige/brite: different adipose cells for different functions? Endocrinology. 2013; 154:2992–3000.
crossref pmid
5. Kalinovich AV, de Jong JM, Cannon B, Nedergaard J. UCP1 in adipose tissues: two steps to full browning. Biochimie. 2017; 134:127–137.
crossref pmid
6. Park A, Kim WK, Bae KH. Distinction of white, beige and brown adipocytes derived from mesenchymal stem cells. World J Stem Cells. 2014; 6:33–42.
crossref pmid pmc
7. Enerbäck S. Human brown adipose tissue. Cell Metab. 2010; 11:248–252.
crossref pmid
8. Lean ME. Brown adipose tissue in humans. Proc Nutr Soc. 1989; 48:243–256.
crossref pmid
9. Lidell ME, Betz MJ, Dahlqvist Leinhard O, Heglind M, Elander L, Slawik M, et al. Evidence for two types of brown adipose tissue in humans. Nat Med. 2013; 19:631–634.
crossref pmid
10. van Marken Lichtenbelt WD, Vanhommerig JW, Smulders NM, Drossaerts JM, Kemerink GJ, Bouvy ND, et al. Cold-activated brown adipose tissue in healthy men. N Engl J Med. 2009; 360:1500–1508.
crossref pmid
11. Virtanen KA, Lidell ME, Orava J, Heglind M, Westergren R, Niemi T, et al. Functional brown adipose tissue in healthy adults. N Engl J Med. 2009; 360:1518–1525.
crossref pmid
12. Cypess AM, Lehman S, Williams G, Tal I, Rodman D, Goldfine AB, et al. Identification and importance of brown adipose tissue in adult humans. N Engl J Med. 2009; 360:1509–1517.
crossref pmid pmc
13. Bahler L, Holleman F, Booij J, Hoekstra JB, Verberne HJ. Interobserver and intraobserver variability for the assessment of brown adipose tissue activity on 18F-FDG PET-CT. Nucl Med Commun. 2016; 37:363–371.
crossref pmid
14. Zainon R, Ronaldson JP, Janmale T, Scott NJ, Buckenham TM, Butler AP, et al. Spectral CT of carotid atherosclerotic plaque: comparison with histology. Eur Radiol. 2012; 22:2581–2588.
crossref pmid
15. Qian LJ, Zhu J, Zhuang ZG, Xia Q, Cheng YF, Li JY, et al. Differentiation of neoplastic from bland macroscopic portal vein thrombi using dual-energy spectral CT imaging: a pilot study. Eur Radiol. 2012; 22:2178–2185.
crossref pmid
16. Peng XG, Ju S, Qin Y, Fang F, Cui X, Liu G, et al. Quantification of liver fat in mice: comparing dual-echo Dixon imaging, chemical shift imaging, and 1H-MR spectroscopy. J Lipid Res. 2011; 52:1847–1855.
pmid pmc
17. Peng XG, Ju S, Fang F, Wang Y, Fang K, Cui X, et al. Comparison of brown and white adipose tissue fat fractions in ob, seipin, and Fsp27 gene knockout mice by chemical shiftselective imaging and (1)H-MR spectroscopy. Am J Physiol Endocrinol Metab. 2013; 304:E160–E167.
crossref
18. d'Assignies G, Ruel M, Khiat A, Lepanto L, Chagnon M, Kauffmann C, et al. Noninvasive quantitation of human liver steatosis using magnetic resonance and bioassay methods. Eur Radiol. 2009; 19:2033–2040.
pmid
19. Ramseyer VD, Granneman JG. Adrenergic regulation of cellular plasticity in brown, beige/brite and white adipose tissues. Adipocyte. 2016; 5:119–129.
crossref pmid pmc
20. Mendonça PR, Lamb P, Kriston A, Sasaki K, Kudo M, Sahani DV. Contrast-independent liver-fat quantification from spectral CT exams. Med Image Comput Comput Assist Interv. 2013; 16(Pt 1):324–331.
crossref pmid
21. Cao Q, Shang S, Han X, Cao D, Zhao L. Evaluation on heterogeneity of fatty liver in rats: a multiparameter quantitative analysis by dual energy CT. Acad Radiol. 2019; 26:e47–e55.
22. Yang CB, Zhang S, Jia YJ, Duan HF, Ma GM, Zhang XR, et al. Clinical application of dual-energy spectral computed tomography in detecting cholesterol gallstones from surrounding bile. Acad Radiol. 2017; 24:478–482.
crossref pmid
23. Feng Q, Xu XT, Zhou Y, Yan YQ, Ran ZH, Zhu J. Creeping fat in patients with ileo-colonic Crohn's disease correlates with disease activity and severity of inflammation: a preliminary study using energy spectral computed tomography. J Dig Dis. 2018; 19:475–484.
crossref pmid
24. Géloën A, Collet AJ, Guay G, Bukowiecki LJ. Beta-adrenergic stimulation of brown adipocyte proliferation. Am J Physiol. 1988; 254(1 Pt 1):C175–C182.
25. Rutkowski JM, Davis KE, Scherer PE. Mechanisms of obesity and related pathologies: the macro- and microcirculation of adipose tissue. FEBS J. 2009; 276:5738–5746.
crossref pmid pmc
26. Rosen ED, Spiegelman BM. What we talk about when we talk about fat. Cell. 2014; 156:20–44.
crossref pmid pmc
27. Cypess AM, Doyle AN, Sass CA, Huang TL, Mowschenson PM, Rosen HN, et al. Quantification of human and rodent brown adipose tissue function using 99mTc-methoxyisobutylisonitrile SPECT/CT and 18F-FDG PET/CT. J Nucl Med. 2013; 54:1896–1901.
crossref pmid pmc
28. Lau AZ, Chen AP, Gu Y, Ladouceur-Wodzak M, Nayak KS, Cunningham CH. Noninvasive identification and assessment of functional brown adipose tissue in rodents using hyperpolarized 13C imaging. Int J Obes (Lond). 2014; 38:126–131.
29. Baron DM, Clerte M, Brouckaert P, Raher MJ, Flynn AW, Zhang H, et al. In vivo noninvasive characterization of brown adipose tissue blood flow by contrast ultrasound in mice. Circ Cardiovasc Imaging. 2012; 5:652–659.
crossref pmid pmc
30. Park JW, Jung KH, Lee JH, Quach CH, Moon SH, Cho YS, et al. 18F-FDG PET/CT monitoring of β3 agonist-stimulated brown adipocyte recruitment in white adipose tissue. J Nucl Med. 2015; 56:153–158.
crossref pmid
TOOLS
ORCID iDs

Xin-Gui Peng
https://orcid.org/0000-0003-2988-5984

Zhen Zhao
https://orcid.org/0000-0001-6911-2797

Di Chang
https://orcid.org/0000-0003-4790-3402

Yingying Bai
https://orcid.org/0000-0003-1492-3597

Qiuzhen Xu
https://orcid.org/0000-0002-8622-0850

Shenghong Ju
https://orcid.org/0000-0001-5041-7865

Similar articles