

 PDF
PDF ePub
ePub Citation
 Print
Print


INTRODUCTION
Diffusion-weighted imaging (DWI) and apparent diffusion coefficient (ADC) are useful for evaluating and characterizing the primary tumor in cervical cancer (1), assessing metastatic lymph node involvement (2), and monitoring treatment response (345). However, the diffusional signal in cervical cancer is thought to be better ascribed to the intravoxel incoherent motion (IVIM) model (6789). Previous studies have demonstrated that IVIM could be used to monitor treatment response (10), evaluate hemotoxicity in the bone marrow (11), and predict survival after chemoradiotherapy (1012).
It was found that the choice of b-values is the most crucial parameter affecting ADC calculation (613141516). Furthermore, finding the b-value at which the contribution of perfusion-effects to the diffusional signal is negligible (the so-called fractional b-value) is critical in obtaining a perfusion-insensitive ADC (1718). Due to the multi-step estimation process of estimating IVIM parameters, the choice of b-value threshold in the initial estimation of the pure diffusion coefficient (D) and perfusion fraction (f) affects the final fitting (1920). Furthermore, the optimal b-value distribution (BVD) and choice of the b-value threshold are organ-specific (1920212223).
IVIM protocols typically require more than eight b-values (2425). However, these require long acquisition times and are not clinically practical. Hence, for clinical integration, there is a need to reduce the number of b-values acquired. Two strategies have been explored: optimized subsampling and a simplified model. Optimized subsampling takes a subsample of b-values and attempts a biexponential curve fitting; this method has shown good concordance with reference IVIM parameters (26). However, there have been no reports regarding an optimal number of b-values in IVIM in cervical cancer. The simplified model uses a linear fitting, which reduces the number of b-values needed and has demonstrated good concordance with biexponential IVIM. However, the simplified model cannot estimate the pseudo-diffusion coefficient (D*) (2728293031).
The purpose of this study was to determine the fractional b-value and explore methods to reduce the number of b-values without sacrificing IVIM estimation accuracy and discriminative ability in cervical cancer.
MATERIALS AND METHODS
Simulations
Simulations were used to evaluate idealized signals for cervical cancer patients and were generated using the IVIM biexponential equation (equation 1a).

Where b is the b-value, S0 represents the signal obtained at b = 0 s/mm2, and Sb represents the signal at a given b-value. IVIM parameters of cervical cancer in the literature (710323334) were used to calculate the pooled parameter means to approach the real case (Table 1).
Two components of Gaussian noise with the same standard deviation (SD) were then added to the signal to simulate a Rician distribution (equation 2).

Where rb is the total signal value, sb is the simulated signal, b is the b-value, and n1 and n2 are the two noise components. Two noise levels, SD = 0.1 and 0.01—estimated signal-to-noise ratios (SNR) of 150 and 15 respectively (25)—were analyzed, and 100 signals were generated per noise level (25). The b-values from 0–1000 s/mm2 with 25 s/mm2 intervals were used. These signals were analyzed with the same pipeline as in vivo data.
In Vivo
This retrospective study was approved and performed per the regulations set by the local Institutional Review Board. This study involved anonymized patient data without identifying information that had already been collected, and thus, the need for informed consent was waived.
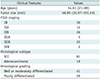
Data from patients with newly diagnosed cervical cancer (International Federation of Gynecology and Obstetrics [FIGO] stages IB–IVB) with squamous cell carcinoma (SCC) and adenocarcinoma from March 2012 to January 2018 were collected for this study. Exclusion criteria were small tumor size (short axis < 10 mm) and substantial image artifacts shown in the primary tumor. One hundred consecutive patients were included in this study. Portions of the cohort have been reported in previous studies (7911203536). Detailed patient demographics can be found in Table 2. In vivo, data were analyzed separately according to the histologic subtypes.
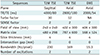
Patients selected for the study were those that had fasted at least six hours before the examination, and 20 mg hyoscine butyl bromide (Buscopan, Boehringer Ingelheim, Ingelheim am Rhein, Germany) had been given intravenously to reduce bowel peristalsis. Images were acquired with a 3T MRI system (Achieva 3T TX, Philips Healthcare, Best, the Netherlands) using a dedicated 16-channel phased-array torso coil. DWI utilizing single-shot spin-echo echo-planar imaging was acquired in free-breathing with background body signal suppression. Thirteen b-values (0, 10, 20, 30, 40, 50, 75, 100, 150, 300, 500, 800, and 1000 s/mm2) were acquired, and the total scan time for DWI was 436 seconds. Detailed acquisition parameters can be found in Table 3.
Volumetric regions of interest (VOI) were manually drawn by a board-certified radiologist with 13 years of experience in female pelvic cross-sectional imaging. Areas of hyperintensity on the b1000 maps were taken as the primary tumor, and the radiologist segmented the tumor by referring to a co-registered T2-weighted image and ADC map. These were then copied to a co-registered parametric map. The same task was repeated after a three-month interval for all patients by the same radiologist to test intraobserver reproducibility. The patient order was randomized to reduce recall bias. Another radiologist with two years of experience in pelvic cross-sectional imaging was similarly asked to draw VOIs for all patients to test interobserver reproducibility.
IVIM Analysis Pipeline
Fractional b-Value
An adaptive b-value biexponential fitting algorithm was used to compute the fractional b-value and has been described in detail (19). Briefly, the first step is to calculate D from the highest b-values using a first-order polynomial fit (equation 1b), then calculate f (equation 1c), and finally calculate D*, fixing the computed values of D and f, for all b-values by using a non-linear least squares (NNLS) algorithm and measuring the sum of squared residuals (RSS). These three steps are repeated with the next lower b-value eliminated until only the two highest b-values remain. The b-value threshold with the lowest RSS was considered the fractional b-value.


Optimal Subsampling
Biexponential IVIM analysis (equation 1a) was performed with the segmented fitting using NNLS. The fractional b-value calculated in the previous section was used as the optimal b-value threshold. The first three b-values were determined by testing all combinations of three b-values, and the combination with the lowest total parameter error (TPE) was then fixed for subsequent iterations. TPE is defined by equation 3a.

Where N represents the number of signals, Ds, fs, and Ds* represent the subsampled IVIM estimates and Dp, fp, and Dp* represent the pooled parameter means. Then, for each incremental distribution size, the optimal b-values were determined by feed forward selection. Unfixed b-values were sampled, and the b-value whose inclusion led to the lowest TPE was fixed for subsequent iterations; this was repeated until all b-values were added. TPE for in vivo data is defined by equation 3b.

Where N represents the number of patients, Di, fi, and Di* represent the subsampled IVIM estimates, and Dr, fr, and Dr* represent the reference IVIM estimates from the full 13 b-value distribution. Fit quality per unit time (FQPUT) for in vivo data was also measured and was defined as the decrease of parameter error divided by the increase in scan time.

Statistical Analysis
All simulations, IVIM, and statistical analysis were done using MATLAB (The Mathworks Inc., Natick, MA, USA). The two-sample Mann-Whitney U test was used to compare the optimal b-value thresholds between the SCC and adenocarcinoma and to compare the IVIM parameters between histological grading and FIGO staging. FIGO stages were dichotomized into low (IB–IIA) and high (IIA–IVB) stages.
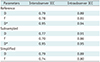
For simulated data, the estimated biexponential parameters (denoted as Dsubsampled, fsubsampled, and D*subsampled) and simplified parameters (denoted as Dlinear and flinear) were compared with the pooled means IVIM parameters (denoted as Dreference, freference, D*reference) using the one-sample Mann-Whitney U test at all subsample sizes. For in vivo data, the estimated biexponential and simplified parameters were compared with the reference IVIM parameters calculated by the full 13 BVD (denoted as Dreference, freference, D*reference) using the two-sample Mann-Whitney U test at all subsample sizes.
Intraclass correlation coefficient (ICC) was used to assess interobserver and intraobserver reproducibility of parameters derived from the reference, subsampled, and simplified models. Values of 0.50–0.75, 0.76–0.90, and > 0.90 are considered to indicate moderate, good, and excellent consistency, respectively.
RESULTS
Optimal b-Value Threshold
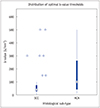
For simulated data, the optimal b-value threshold was 25 s/mm2. For SCC, the median threshold was 40 s/mm2, and it was 100 s/mm2 for adenocarcinoma (Fig. 1). Thus, 100 s/mm2 was taken as the optimal in vivo threshold.
Optimal Subsampling
The optimal three BVD was (0, 200, 1000) s/mm2 for simulated data and (0, 300, 1000) s/mm2 for in vivo data, regardless of the histological subtype (Supplementary Fig. 1).
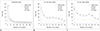
In both simulated and in vivo data, the TPE of biexponential IVIM (TPEbIVIM) decreased as more b-values were added (Fig. 2). Perfusion-related parameter errors were acceptable in low-noise simulated and in vivo data but were high in high-noise simulated data, with errors over 500%. Hence, high-noise simulations were deemed not representative of the clinical routine and excluded from further analysis.
In low-noise simulations, subsampled parameters were not significantly different from the respective pooled means parameters at all distribution sizes greater than four (Supplementary Table 1). The optimal protocol included six b-values, (0, 25, 100, 175, 200, 1000) s/mm2, which had D, f, and D* errors of 3.63%, 0.36%, and 0.09%, respectively and were not significantly different from the reference parameters (p = 0.141, p = 0.907, p = 0.474).
In vivo, subsampled parameters in SCC were not significantly different from reference parameters from a distribution size of six. FQPUT also plateaued at six b-values (Supplementary Fig. 2). The optimal subsampled protocol included six b-values, (0, 10, 30, 75, 300, 1000) s/mm2 and had D, f, and D* errors of 0.33%, 4.11%, and 3.49%, respectively, that were not significantly different from the reference parameters (p = 1.000, p = 0.378, p = 0.981). This scan time decreased to 198 seconds, representing a 55% scan time reduction. For adenocarcinoma, Dsubsampled was not significantly different from Dreference at all distribution sizes greater than 4 (Supplementary Table 1), but the trends for fsubsampled and D*subsampled were not consistent, leaving no optimal subsampled BVD.
Simplified IVIM
For low noise simulations, the optimal three BVD was (0, 200, 1000) s/mm2, which achieved D and f errors of 167.25% and 546.61%, respectively (Supplementary Fig. 3). However, the TPE of the simplified IVIM model (TPEsIVIM) was high, and consequently, the simplified parameters were significantly different from the pooled mean parameters (p < 0.001) at all distribution sizes (Supplementary Table 2).
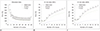
For in vivo data, the TPEsIVIM was low when only high b-values, i.e., b-values greater than the fractional b-value, were sampled (Fig. 3). In SCC, the optimal choice for a three BVD was (0, 300, 1000) s/mm2, which achieved D and f errors of 1.10% and 6.30%, respectively, and was not significantly different from the reference parameters (p = 0.229, p = 0.089). Adenocarcinoma also had the same optimal choice of BVD and had D and f errors of 1.18% and 10.59%, respectively, and was also not significantly different from the reference parameters (p = 0.623, p = 0.212). The scan time decreased to 99 seconds, representing a 77% scan time reduction.
Interobserver and Intraobserver Reproducibility
Interobserver reproducibility of IVIM parameters was good, while intraobserver reproducibility was excellent (Table 4). Values of f were slightly less reproducible compared to values of D while D* had the highest reproducibility.
Associations with Clinicopathologic Factors
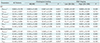
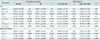
In SCC, freference and fsubsampled were found to be significantly different between histological grades, and D*reference and D*subsampled were found to be significantly different between FIGO groups (Table 5). In adenocarcinoma, flinear was significantly different between histological grades. In both SCC and adenocarcinoma, neither the subsampled nor simplified IVIM parameters were significantly different from the reference parameters regardless of histological and staging groups (Table 6).
DISCUSSION
In the current study, we examined whether the number of b-values can be reduced without sacrificing the precision of the IVIM parameter estimates in DWI of cervical cancer. We found that a subsampled distribution of six b-values yielded IVIM parameters with an error of around 4% while preserving the discriminative ability between histological grades and FIGO groups in patients with SCC. Even though three b-values were enough for a simplified model and Dlinear and flinear had an error rate of 1% and 8%, respectively, in our study, this model could not retain its discriminative property.
In the estimation of IVIM parameters, segmented fitting is used to reduce error (38). This multi-step process requires a b-value threshold to be selected, and several studies have demonstrated the importance of choosing an appropriate threshold (2239). However, it was also found that the threshold is dependent on the organs, with values ranging from 20 s/mm2 in the healthy liver (19) to 300 s/mm2 in breast cancer (23). In the present study, we found that the optimal threshold for SCC was 40 s/mm2 and 100 s/mm2 for adenocarcinoma, which was similar to a previous report (20).
For the determination of an optimal BVD for cervical cancer using simulations, acceptable TPEbIVIM was achieved after 4 b-values were sampled and reached a minimum with 18 b-values. Two other optimization simulation studies suggested a distribution size of 8 to 16 b-values (2425). In high noise simulated signals, SNR of 15, perfusion parameters could not be accurately estimated, in contrast with a study that suggested a minimum SNR of 8 (24). The feed forward algorithm used in this study determined a clustered distribution to produce the lowest errors in concordance with a study in which clustered distributions had better measurement consistency compared with equally-spaced distributions (25).
Considering that one limiting factor for the clinical translation of IVIM is the long scan time, reducing the number of b-values needed could promote the clinical integration of IVIM. It was found that the TPEbIVIM steadily decreased in SCC, and parameter errors were below 5% using six b-values. Furthermore, both freference and fsubsampled were significantly different between histological grading and that both D*reference and D*subsampled were significantly different between FIGO stages in SCC, implying that the subsampled parameters had similar discriminative abilities as the reference parameters. While it was observed that the TPEbIVIM decreased in adenocarcinomas, the trends for the perfusion parameters were erratic, and errors remained high up to 10 b-values, suggesting that IVIM imaging may not be a proper modality to assess cervical adenocarcinoma.
In selecting the minimum number of b-values, FQPUT balances accuracy with acquisition time (2440). In SCC, FQPUT plateaued at six b-values, which potentially represents a minimum acquisition for biexponential analysis, reducing the scan time by as much as 55%. In comparison, liver studies have found that the FQPUT plateaus at around eight b-values (2426). However, it has been suggested that the liver was better described by a multiexponential model (41) due to the dual flow nature of the liver (42), so more b-values may be required.
Another approach for reducing the acquisition and post-processing time of IVIM is the use of a simplified model (30). Linear fitting requires fewer sampled b-values and lower post-processing intensity. Even though this simplified method precludes the calculation of D*, it is unclear whether D* can serve as a clinically relevant parameter due to its high variability (31).
The simulation experiments demonstrated that TPEsIVIM was high regardless of distribution size. In contrast, in vivo experiments could estimate parameters that were not significantly different from those calculated by the biexponential model. In the case of simulated signals, Gaussian noise was added, so sampling more b-values was a compensatory step to reduce the disparity between the estimated and the pooled means parameters. However, in the case of in vivo data, the reference values were from the 13 b-values using a biexponential fit, so sampling more b-values was not needed. Previous studies have also shown that the simplified method yields estimates close to biexponential fitting with only three b-values in brain pathologies (28) and pancreatic (31) and head and neck cancers (27).
In choosing the b-values for simplified IVIM, the choice of bLow affected TPEsIVIM more than the choice of bHigh. It was also observed that sampling low b-values increased parameter error as it pushed the slope to be artificially steeper due to perfusion effects. It was previously suggested that all non-zero b-values be greater than the fractional b-value (17). Sampling more high b-values appeared to slightly increase TPEsIVIM in contrast with a previous study (28). Despite the low errors achieved using this model, flinear could not be used to separate histological grades in SCC. Though flinear was shown to be significantly different between grades in adenocarcinoma, this is a false positive as freference was not significantly different, suggesting that the simplified model may not be clinically relevant in cervical cancer.
ICC testing of reference, subsampled, and simplified IVIM parameters demonstrated good interobserver and intraobserver reproducibility. Interestingly, D* was shown to have high reproducibility, which may be because many voxels had calculated values that were beyond the constraints set.
This study has several limitations. First, interscanner and interprotocol variations have not been tested. Therefore, a multi-center study may be necessary to generalize these results. Second, as this was a retrospective study, the choice of b-values for patients was not guided by simulation results. Lastly, the feed forward approach used in this study saves computation time by reducing the search space compared to an exhaustive grid search but may not find the true minimum at a given subsample size.
In summary, by using the optimized BVD, the proposed method could reduce IVIM scan time by 55% with a low error rate, estimating parameters that were not significantly different from reference parameters. Furthermore, both freference and fsubsampled were significantly different between histological grades, while both D*reference and D*subsampled were significantly different between FIGO stages in patients with SCC. Therefore, optimized subsampling may potentially allow the integration of IVIM in a clinical setting for patients with cervical cancer.

 XML Download