

 PDF
PDF ePub
ePub Citation
 Print
Print


INTRODUCTION
Shear-wave elastography (SWE) is a popular ultrasound (US) elastography technique that generates shear waves by applying a push pulse (1). By depicting tissue stiffness, the shear-wave velocity (SWV) can characterize breast lesions as malignant or benign (23). A variety of SWV parameters, including max SWV (SWVmax), mean SWV (SWVmean), and standard deviation (SD) have been used to improve the diagnostic performances of SWE for breast lesions (4567) and predict the biological characteristics of invasive cancers (89). One study reported that mean stiffness values were influenced by tumor size, histologic grade, and molecular subtype independently and that the human epidermal growth factor receptor (HER2)-positive and triple-negative subtype showed higher stiffness than did the estrogen receptor (ER)-positive subtype (9). However, another study showed that mean stiffness value was not associated with the molecular subtype of breast cancer (10). The inconsistent results for the relationship between SWE and the biological characteristics of breast cancer might result from inaccuracies in SWE measurements.
A previous study demonstrated that in 63% of breast cancers, some regions of the cancer did not code on SWE, resulting in no identification of shear waves, or coded with a low SWV (11). Preliminary explanations for this finding suggested that shear waves might not propagate as expected in breast cancers (12) and significant noise was generated in this process (2). Incorrect interpretation of shear waves in some regions of breast cancer might result from heterogeneity of breast cancer (hemorrhage, necrosis, and different distribution of cancer components) and acoustic attenuation and improper data collection (probe movement and tissue movement) (13). Therefore, in order to measure SWV correctly, the region of interest (ROI) for measurement of SWV should not be placed in the regions where SWE was not generated properly.
Some SWE techniques provide a quality map (QM) to indicate the reliability of SWV measurements. Virtual touch tissue imaging quantification (VTIQ), a two-dimensional (2D) SWE technique, calculates SWV quantitatively with a color-coded map showing its distribution and also produces a 2D shear-wave QM (5). By allowing evaluation of the shear waves propagated and determining the accuracy of SWV, the addition of QM might help avoid some cases of misdiagnosis (13).
One previous study suggested that in SWV measurements, regions showing poor quality in the QM should be avoided (5). Another study demonstrated that in comparison with the diagnostic performance without QM guidance, the diagnostic performance of SWE under QM guidance was improved significantly by using low QM as an indicator of malignancy (13). However, the actual SWV parameters that are affected by the addition of QM remain unknown, and therefore, the effect of QM guidance in avoiding poor-quality areas on the diagnostic performance and prediction of biological characteristics in cases of invasive breast cancer remains unknown.
Our study aimed to determine the added value of QM with respect to the diagnostic performance of SWE for assessment of breast lesions and for predicting the biological characteristics of invasive breast cancer.
MATERIALS AND METHODS
This prospective study was approved by the Institutional Review Board. Informed consent was obtained verbally from all patients. With all pivotal raw data uploaded to the Research Data Deposit (RDD) public platform (www.researchdata.org.cn), the RDD number RDDA2019001042 was assigned to this registered study.
Participants
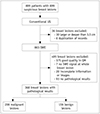
Between January 2016 and February 2019, 899 consecutive female patients with 899 breast lesions were studied at our institution. The inclusion criteria for breast lesions were as follows: 1) visible breast lesions that were suspected to indicate malignancy in conventional US; 2) solid lesions; 3) presence of poor-quality regions (yellow or red components) in QM. The exclusion criteria were as follows: 1) no pathological findings; 2) incomplete images or information, repeated cases; 3) lesions deeper than 3.5 cm or larger than 3.5 cm in diameter; 4) no SWE signal for the whole breast lesion; 5) breast lesions showing good-quality regions (evenly green) in QM. The patients underwent conventional breast US first. Thirty patients were excluded because they showed breast lesions larger or deeper than 3.5 cm, while six patients underwent repeat examinations. Then, SWE of the targeted breast lesions was performed in 863 patients; among these, 488 (56.5%) breast lesions showed poor-quality regions in QM, while 375 (43.5%) breast lesions showed good-quality regions (evenly green) in QM. The 375 breast lesions showing good-quality regions in QM and seven lesions that showed no SWE signal were excluded. Among the remaining 481 patients, 20 patients had incomplete information or images and 93 patients had no pathological results. Finally, 368 female patients with 368 pathologically proven breast lesions were included in our study (Fig. 1).
Image Acquisition
Conventional US and SWE of VTIQ are performed using a 9L4 linear array probe by one of two board-certified radiologists with at least 2 years of experience in performing US elastography with SCUSON S2000 ultrasound scanner (Siemens Healthineers, Mountain View, CA, USA).
With the patients in a supine position, a conventional breast US examination including B-mode and color Doppler evaluations was performed initially. On the basis of the expected likelihood of malignancy of the target breast lesion (4), the final US Breast Imaging Reporting and Data System (BI-RADS) evaluation was provided and recorded.
SWE of VTIQ is carried out at the longest diameter of the target lesion. To minimize pre-compressions, extremely slight pressure is applied to the lesion with gel filled between skin and probe (14). When the acoustic radiation force impulse (ARFI) was initiated, patients were required to hold their breath for several seconds.
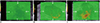
The QM of SWE, displayed as a 2D-color image, is acquired to assess the quality of SWE. The scale of this QM could not be altered, and a cut-off confidence level has been set to indicate whether the SWV measurement was valid (13). A reliable SWV measurement was color-coded evenly green in QM while an unreliable measurement was color-coded yellow or red (Fig. 2).
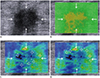
Next, a velocity map of SWE showing the distribution of SWV in a 2D-color image was obtained. The different colors ranging from blue, green, and yellow to red represent the increasing value of SWV. The numeric SWV value is acquired by placing the 2 × 2 mm ROI and is displayed in meter per second (m/s). For each lesion, seven ROIs are placed in each lesion with and without the guidance of QM. Without the guidance of QM, two ROIs are placed at two areas of the lowest stiffness and two areas of the highest stiffness, while the remaining three ROIs were placed randomly on the target lesion (5). Under the guidance of QM, poor-quality areas were avoided.
Histopathological Evaluation
The pathological results of US-guided core needle biopsy or surgery are recorded when available. For invasive cancers, histological grade, lymphovascular invasion, axillary lymph node status, and immunohistochemistry findings, including ER, progesterone receptor (PR), HER2, and Ki-67 status were determined by pathological examination of the resected specimen. On the basis of our immunohistochemistry results, the invasive cancers are divided into four molecular subtypes: luminal A, luminal B, HER2-enriched, and triple-negative breast cancer (15).
Statistical Analysis
Different SWV parameters, including the SWVmean, SWVmax, and SD with (SWVmean + QM, SWVmax + QM, and SD + QM, respectively) and without the guidance of QM (SWVmean − QM, SWVmax − QM, and SD − QM, respectively) were calculated for each breast lesion.
MedCalc (version 15.2.2 for windows; MedCalc Software bvba, Mariakerke, Belgium) and SPSS (version 20.0 for windows; IBM Corp., Armonk, NY, USA) were used for statistical analysis. A paired Wilcoxon test was applied to compare SWVmean + QM and SWVmean − QM, SWVmax + QM and SWVmax − QM, and SD + QM and SD − QM. Benign and malignant breast lesions are calculated by Mann-Whitney U test among the above parameters of SWV respectively. For different parameters of SWV, the cut-off value was calculated with the maximum Youden index. The sensitivity and specificity in distinguishing benign and malignant lesions were then calculated and compared with the McNemar test. The areas under the receiver operating characteristic curve (AUC) were calculated and compared by the method proposed by DeLong et al. (16). As for further analysis of invasive breast cancer, relationships between the above parameters of SWV and biological characteristics were investigated by the Mann-Whitney U test. Differences are considered significant when the p value was less than 0.05.
RESULTS
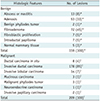
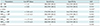
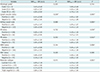
A total of women (mean age, 47 years; SD, 10.8 years; range, 20–78 years) with 368 breast lesions (mean size, 19.7 mm; SD, 6.9 mm; range, 5–35 mm) were included for final analysis. Pathologically, 159 (43.2%) lesions were benign and 209 (56.8%) were malignant. Among the 159 patients with benign breast lesions, 52 underwent surgery and the remaining 107 patients were assessed by US-guided core needle biopsy. The histopathologic details of the breast lesions are shown in Table 1. With conventional US, of the 368 lesions, 93 (25.3%) were classified under BI-RADS category 4A, 97 (26.4%) under BI-RADS category 4B, 137 (37.2%) under BI-RADS category 4C, and 41 (11.1%) under BI-RADS category 5. The malignant rates in the different BI-RADS categories were 3.2% in category 4A, 46% in category 4B, 87.6% in category 4C, and 100% in category 5.
Comparison between SWV Parameters with and without QM
For all breast lesions, SWVmean + QM was statistically different from SWVmean − QM (SWVmean + QM, 3.6 ± 1.39 m/s; SWVmean − QM, 3.29 ± 1.22 m/s; p < 0.001) and SD + QM was significantly different from SD − QM (SD + QM, 1.02 ± 0.84; SD − QM, 1.46 ± 1.06; p < 0.001) while SWVmax + QM was similar to SWVmax − QM (SWVmax + QM, 5.33 ± 2.52 m/s; SWVmax − QM, 5.32 ± 2.53 m/s; p = 1) (Table 2).
Diagnostic Performance of SWV Parameters with and without QM
Under the guidance of QM, SWVmean + QM of benign breast lesions was significantly lower than that of malignant lesions (benign lesions, 2.5 ± 1.6 m/s; malignant lesions, 4.44 ± 1.23 m/s; p < 0.001). The cut-off value for SWVmean + QM was 3.12 m/s, achieving a sensitivity of 89%, specificity of 88.7%, and AUC of 0.932. Without QM guidance, the SWVmean − QM was 2.37 ± 0.59 m/s for benign lesions and 4.00 ± 1.09 m/s for malignant lesions (p < 0.001). The cut-off value for SWVmean − QM was 3.04 m/s, achieving a sensitivity of 84.2%, specificity of 90.6%, and AUC of 0.912. The sensitivity and AUC of SWVmean + QM were significantly better than those of SWVmean − QM (sensitivity, p = 0.012; AUC, p < 0.001) and the specificity of SWVmean + QM was similar to that of SWVmean − QM (p = 0.625) (Fig. 3).
Under QM guidance, SD + QM was 0.44 ± 0.38 for benign lesions and 1.64 ± 0.72 for malignant lesions (p < 0.001). Without QM guidance, the SD − QM was 0.60 ± 0.43 for benign lesions and 2.12 ± 0.91 for malignant lesions (p < 0.001). The cut-off values of SD + QM and SD − QM were 1.11 and 0.83, respectively. There was no significant difference in the sensitivity and specificity between SD + QM and SD − QM (sensitivity, 88.5% vs. 89.0%, p = 1; specificity, 89.9% vs. 89.9%, p = 1).
Under QM guidance, SWVmax + QM was 3.26 ± 1.23 m/s for benign lesions and 6.90 ± 2.07 m/s for malignant lesions (p < 0.001). Without QM guidance, the SWVmax − QM was 3.25 ± 1.23 m/s for benign lesions and 6.90 ± 2.08 m/s for malignant lesions (p < 0.001). The cut-off SWVmax + QM and SWVmax − QM values are 4.73 m/s and 4.73 m/s, respectively. There was no significant difference in sensitivity and specificity between SWVmax + QM and SWVmax − QM (sensitivity: 89.0% vs. 89.0%, p = 1; specificity, 89.3% vs. 88.7%, p = 1).
Invasive Cancer
Among the 194 invasive breast carcinomas enrolled in this study, complete histologic information was available for 182, including 166 invasive ductal carcinomas, 14 invasive lobular carcinomas, and 2 invasive papillary carcinomas. Of these invasive cancers, 34% showed lymphovascular invasion and 36% showed axillary lymph node metastasis. When the invasive cancers were divided by immunohistochemical findings, 76% were ER-positive, 58% were PR-positive, 26.4% were HER2-positive, and 86% had Ki-67 > 14%. As for molecular subtype, 12.6% belonged to the luminal A subtype, 64.3% to the luminal B subtype, 12.1% to the HER2-enriched subtype, and 11% to the triple-negative subtype. For invasive ductal carcinoma, 2% of the tumors were categorized as grade 1, 49% as grade 2, and 49% as grade 3.
Association between SWVmean and Biological Characteristics
Among the biological characteristics of invasive cancers, only lymphovascular involvement showed a higher SWVmean − QM than lymphovascular-negative status (p = 0.036), and there was no difference in the SWVmean − QM of invasive cancers with respect to the other biological characteristics, including histologic grade, axillary lymph node status, ER status, PR status, HER2 status, Ki-67 status, and different molecular subtypes (all p > 0.05).
There SWVmean + QM of invasive cancers showed significant relationships with respect to biological characteristics such as lymphovascular status, axillary lymph node status, ER status, PR status, HER2 status (all p < 0.05). Lymphovascular involvement, axillary lymph node metastasis, negative ER, negative PR, positive HER2 and aggressive molecular subtypes show significantly higher SWVmean + QM than the opposite status, respectively (all p < 0.05) (Table 3).
DISCUSSION
SWE has gained widespread acceptance because of its high reproducibility and quantitative measurement of stiffness (17). Because of the attenuation of ARFI, SWE can be sufficiently generated at a limited depth of approximately 4.5 cm (18), where malignant breast lesions tend to be coded with a high SWV while benign breast lesions tend to be coded with a low SWV. However, some breast cancers are misdiagnosed because SWV is interpreted incorrectly (12). This phenomenon can be attributed to measurement errors occurring in generation of SWE (13). QM of VTIQ, a 2D SWE technique, can identify these errors and display the quality distribution in a color representation to indicate where SWV was interpreted reliably (2). However, some US machines like Aixplorer system (Supersonic Imagine, Aix-en-Provence, France) do not provide QM, and many studies on SWE did not refer to a QM (48). It remains unknown whether a QM would affect the value of different SWV parameters, their diagnostic performances and the prediction of biological characteristics for invasive breast cancer.
In our study, SWVmean + QM and SD + QM were significantly different from SWVmean − QM and SD − QM, respectively, while SWVmax + QM was similar to SWVmax − QM. This phenomenon might have resulted from the fact that adequate shear-wave propagation would occur sufficiently and the SWV would be interpreted correctly where SWVmax occurs (12). Consequently, SWVmax would not be changed irrespective of QM guidance. However, SWV would be interpreted incorrectly as a lower value when measurement errors occur (13). As a result, SWVmean and SD might change if QM is used and regions of poor quality are avoided.
In comparison with SWVmean − QM, the cut-off value of SWVmean + QM is increased from 3.04 m/s to 3.12 m/s and the subsequent sensitivity improved from 84.2% to 89%. Without QM guidance, SWV of poor-quality regions might be interpreted as lower values and the consequent cut-off value of SWVmean − QM would be lower. Since the SWVmean − QM could not represent the actual stiffness of the breast lesion, the sensitivity of SWVmean − QM is inferior to that of SWVmean + QM, which is consistent with a previous study (13).
The cut-off value of SWVmean with or without QM guidance was lower than that in previous studies (1920). One possible explanation might be that the precompression was almost eliminated in our study. The addition of precompression, even a small amount, could increase the SWV of breast lesions. One study showed an increase of 1 m/s in the SWV if 20% precompression was added (21). When SWE was performed in our study, the coupling agent was filled between the skin and probe so that precompression was extremely slight (14). On account of this phenomenon, it is difficult to make a comparison accurately between our results with others.
Among the different SWV parameters suggested for evaluating stiffness, mean stiffness value showed best reliability (22) and was reported to be associated with biological characteristics in some studies (910). In our study, in comparison with invasive cancers with better prognostic features, cancers with more aggressive prognostic features tended to have higher mean stiffness. A previous study demonstrated similar results, showing an association between higher mean stiffness values and lymphovascular invasion, higher histologic grade, and a more aggressive molecular subtype of invasive cancers (10). Some biophysical studies revealed that differences in the molecular status of cancers might produce different stiffness because of a complex combination of microvascular density, cellularity, fibrosis, and necrosis (2324), and one study showed that ER-positive subtype cancers had lower stiffness than other subtype invasive cancers (9), which was similar to our results.
Compared with SWVmean − QM, SWVmean + QM has been revealed to have associations with more biological characteristics of invasive cancers in our study. To our best of knowledge, there is no study to demonstrate the relationship between QM of SWE and the biological characteristics of invasive cancers. The QM could reveal incorrect interpretation of SWE which might have resulted from the biological characteristics of breast cancer (13). QM could help identify these measurement errors, and SWVmean + QM became more representative and closer to the real stiffness of the breast lesion.
There are several limitations in this study. First, this was a single-center prospective study and only one vendor's US scanner is assessed. Therefore, further multicenter studies will be needed to validate the results of this study. Second, all breast lesions enrolled in this study showed poor-quality regions in the QM, which resulted in a high percentage (56.8%) of malignancy and might not affect the result. Third, most benign breast lesions are diagnosed according to the results of US-guided core needle biopsy, which has been proven to be accurate and safe but still has a false-negative rate ranging from 0 to 3.7% (2526).
In conclusion the QM plays an important role in the measurement of SWV of breast lesions on SWE, achieving better diagnostic performance and predicting more biological characteristics of invasive breast cancers.
 XML Download