

 PDF
PDF ePub
ePub Citation
 Print
Print


INTRODUCTION
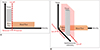
Ultrasonography (US) is the most common imaging modality used for children. Microvascular US (MVUS) uses an innovative Doppler ultrasound algorithm and has an improved diagnostic ability. Conventional color Doppler US (CDUS) uses wall filters, which apply the appropriate cutoff frequency to suppress the low-frequency components resulting from patients' motion, pulsation, and respiration, called clutter artifacts (Fig. 1A). When clutter artifacts are eliminated from the acquired signals, true low-velocity blood flow is also eliminated because of overlapping frequency. Power Doppler US (PDUS) is a second-generation Doppler technique that shows the strength of the acquired Doppler signal in color, regardless of the speed or direction of the moving cells. The number of moving cells is directly proportional to the intensity of paleness in the expressed color (1). PDUS is approximately three times more sensitive than CDUS; therefore, more small vessels can be visualized on grayscale US.
MVUS is a third-generation Doppler technique that was developed to overcome the limitations of conventional wall filters used in the preceding Doppler techniques that eliminate both clutter artifacts and slow blood flow. MVUS uses an advanced filter that can differentiate tissue artifacts from low-velocity blood flow by exploiting the spatiotemporal coherence information (Fig. 1B). This advanced filter can suppress the tissue component selectively and preserve the microvascular flow signal, which is otherwise filtered and removed in conventional CDUS (2). Since the first MVUS technique Superb Microvascular Imaging (SMI) was launched by Canon Medical Systems, other vendors have mounted MVUS filters on high-end US devices to yield high-resolution MVUS images. In addition to previous studies using SMI in the pediatric population (34567), we performed MVUS in children, using the MV-Flow™ of RS85, manufactured by Samsung Medison (Seoul, Korea). To compare the two Doppler techniques with the highest objectivity, the images were obtained while maintaining the initial parameters without the examiner's manipulation. MVUS allows visualization of both normal and pathologic microvascular tissue structures. The purpose of this pictorial essay was to review the MVUS images of normal perfusion patterns and different abnormal perfusion patterns of various tissues in children and to compare them with CDUS images.
Brain
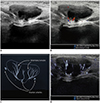
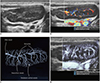
For neonates, transfontanelle brain US is the primary brain imaging modality because it provides easy accessibility, patient safety, and high-resolution images. Doppler studies can increase the clinical value of brain US performed for the vascular structures. The intracortical vessels arising from the pial arteries pass the cortex and branch into the following six groups depending on their degree of extension within the cortex: group 1 reaches the cortical layer; groups 2–4 pass through the entire cortical thickness; group 5 reaches the subcortical white matter; and group 6 (medullary artery) reaches the white matter (8). With conventional CDUS, the leptomeningeal vessels are seen on the superficial scans while the lenticulostriate perforators supplying the caudate and lentiform nuclei are seen on the deep scans (Fig. 2). On the MVUS images, we could define groups 1–5 as intracortical vessels and group 6 as medullary vessels supplying the cortex and white matter, respectively. Similarly, Goeral et al. (3) reported that SMI could distinguish between the striatal and extrastriatal vessels in their prospective study. The application of MVUS for pathologic condition in the pediatric brain has not been reported and should be further studied in the future.
Thyroid Gland
US is the primary imaging modality used for evaluating the thyroid gland. Moreover, information on vascularity within the thyroid nodules can help diagnose malignancy associated with the thyroid nodules, in addition to the known characteristics, such as hypoechogenicity, irregular margins, “taller-than-wide” shape, and microcalcifications (9). MVUS might provide more detailed information on the microvascular architecture and vascular branching and distribution, thereby improving the diagnostic performance of the Thyroid Imaging Reporting and Data System for TR 4 thyroid nodules (1011). However, despite better depiction of the microvasculature, SMI has shown little benefit in the differential diagnosis of malignant and benign thyroid nodules (9).
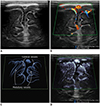
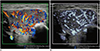
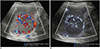
We used MVUS for the thyroid parenchyma and to differentiate between normal and pathologic glands based on the vascularity and found that changes in the vascularity in thyroiditis and hyperthyroidism were more prominent on MVUS than on CDUS (Figs. 3, 4). In patients with thyroid goiter, the vascularity seemed to differ based on the thyroid function of the patients: It was more prominently increased in patients with toxic goiter than in those with non-toxic goiters. Although we could not apply the quantification tool, which was the measured amount of blood flow in the defined region of interest, the features in our study were consistent with the features in a study by Bayramoglu et al. (12). They performed quantitative assessments using SMI for the thyroid glands, based on a vascularity index parameter that was significantly higher in patients with Hashimoto thyroiditis than in the controls (13.5% vs. 7.5%, respectively).
Kidney
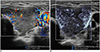
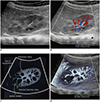
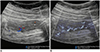
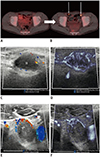
The renal arteries enter the kidneys via the hila and have a primary bifurcation, which subsequently splits into the interlobar, arcuate, and interlobular arteries. The smaller branches comprise the glomerular and peritubular capillaries (13). MVUS demarcated the blood vessels in the renal cortex in children, and detailed branching of the interlobar, arcuate, and interlobular arteries supplying the renal cortex was demonstrated better on MVUS than on CDUS (Fig. 5). In addition, the renal medulla was clearly defined on MVUS as an oval, hypoechoic area. The superiority of MVUS compared to CDUS for depicting the interlobular arteries of the kidneys was illustrated when infection spread to the kidneys, and acute pyelonephritis (APN) developed. The pathophysiological changes in APN are characterized by interstitial edema, tubular obstruction, and vasoconstriction (14), and the correlated US findings are renal enlargement with changes in the parenchymal echogenicity, loss of corticomedullary differentiation, collecting system dilatation, and areas of hypoperfusion (15). MVUS demonstrated localized areas of hypoperfusion because the difference in perfusion between the normal renal cortex and the involved area was more apparent on MVUS than on CDUS (Fig. 6). In addition, some children with APN showed stretching of the interlobar vessels, which might be caused by interstitial edema.
Urinary Bladder
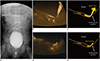
Kim et al. (5) reported that MVUS could identify reversed flow of urine in the distal ureter and a swirl appearance of urine movement in the distended renal pelvis in patients with high-grade vesicoureteral reflux (VUR). In addition, we could detect the reversed flow of urine in a patient with grade 2 VUR (Fig. 7). Although MVUS is not feasible for visualizing the reversed flow of urine in all patients with VUR, it is apparent that MVUS is a non-invasive and safe method, without radiation exposure, unlike voiding cystourethrography. With color MVUS, the flow direction was confirmed more certainly.
Small Bowel
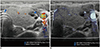
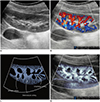
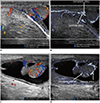
The vasa recta arising from the mesenteric arteries branch-out in a tree-like appearance at the mesenteric border of the small bowel, and subsequently, some branches pass directly into the bowel wall while some branches circumscribe the bowel anteriorly and posteriorly to anastomose freely at the antimesenteric border (16). MVUS demonstrated the small vessels circumscribing the bowel wall and even the transmural vessels, particularly where inflammation or infection occurred (Figs. 8, 9).
Ovary
The smaller branches of the ovarian arterial arcade penetrate the ovarian hilum and medulla, showing coiling and branching. In the medulla, each branch traverses to the ovarian cortex in a spiral shape, giving off branches that divide into the arterioles perpendicular to the ovarian surface (17). MVUS was feasible for evaluating the small spiral arterioles in the ovarian medulla (Fig. 10). Ayaz et al. (4) recently reported that improved detection of ovarian vascularity using SMI might provide additional information, such as factors of menarche or age affecting ovarian perfusion.
Testis
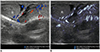
The main blood supply to the testis is provided by the testicular arteries from the aorta. In the scrotum, the testicular artery runs along the posterior aspect of the testis and flows through the tunica albuginea, branching off into two sets of arteries: the capsular and transmediastinal arteries. The capsular artery splits into the centripetal arteries that go through the testicular parenchyma and flow toward the mediastinum. As they reach the mediastinum, the centripetal arteries turn into the recurrent rami that flow back in the opposite direction, supplying blood from the mediastinum to the testis (18). MVUS demonstrated the testicular, capsular, and centripetal arteries (Fig. 11) and was useful for assessing the status of testicular perfusion (Fig. 12). Lee et al. (7) reported that SMI was more sensitive than PDUS for detection of parenchymal perfusion of the undescended testis in young children.
Lymph Nodes
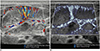
The hilar artery of the lymph node branches into the medullary arterioles that radiate centrifugally and form a dense network of capillaries (19). Subsequently, the capillaries empty into the high endothelial venules, which transit to the medullary venules, returning centripetally to the hilar vein. CDUS showed the hilar vessels and medullary cords at the level of the central hilum and occasionally a deep cortical unit. In addition, MVUS allowed visualization of the paracortical vessels and even the peripheral cortical vessels that were not seen on CDUS (Fig. 13).
Metastatic lymphadenopathy tended to have peripheral vascularity, associated with tumor angiogenesis and the desmoplastic reaction or recruitment of the capsular vessels (20). Demonstration of increased peripheral vascular structures surrounding the lymph nodes by MVUS was better compared to that by CDUS (Fig. 14).
Vascular Lesions
Infantile hemangiomas are the most common tumors in children, and US is the preferred diagnostic imaging modality (21). Most cases of hemangioma manifest as cutaneous lesions in the head and neck (22), and we used MVUS for an infantile hemangioma that occurred in the parotid gland. US findings of the infantile hemangioma of the parotid gland included a well-circumscribed hypervascular mass with fast flow, confirmed using Doppler spectral waves (23). In our experience, CDUS was sufficient to diagnose infantile hemangiomas, but MVUS had the advantage of defining the margin and extent (Fig. 15).
Advantages and Disadvantages of MVUS in Children
In our cases, MVUS demonstrated the microvascular structures and provided details of microvascular branching that were eliminated as clutter artifacts on CDUS. Therefore, MVUS detected the presence or absence of blood flow quickly to assess diseases in which changes in blood or urine flow occurred. MVUS and CDUS had the same technique, which included pressing a button to activate the function, and it was convenient and more comfortable than invasive examinations, such as contrast-enhanced US or voiding cystourethrography.
As with PDUS, MVUS was sensitive to motion and flash artifacts, which was considered a major drawback of the use of MVUS in young children. However, with advancements in the technology, the acquisition time has shortened. In addition, the maximal size of the region of interest activated on MVUS was smaller than that on CDUS.
CONCLUSION
We reviewed normal and abnormal perfusion patterns using MVUS for various tissues, including the brain, thyroid gland, kidney, urinary bladder, small bowel, ovary, testis, lymph node, and hemangiomas in children. Further clinical studies investigating the correlations between MVUS, pathologies, and clinical prognoses can extend the use of MVUS, and the quantification analysis can also enhance the diagnostic confidence of MVUS in children.
 XML Download