

 PDF
PDF ePub
ePub Citation
 Print
Print


INTRODUCTION
Allergic diseases have shown a dramatically increased prevalence over the last few decades and recent research points to a central role of the microbiota.1 It is well established that the gut microbiome can modulate the immune response, from cellular development to organ and tissue formation2 exerting its effects through multiple interactions with both the innate and acquired immune system. In the late 1980s, the “hygiene-hypothesis” was proposed,3 in which factors in the environment and nutrition can cause a dysbiosis of the skin, gut, or lung microbiome, inducing qualitative and quantitative changes in its composition and metabolic activity.4
Atopic dermatitis (AD) affects 17%–24% of the pediatric population. It develops during the first 6 months of life in 45% of children and by 5 years of age in 85% of the affected subjects.5 Contrary to the prior concepts of outgrowing AD, it is now known that only half of affected children show resolution of this disease in adulthood, indicating its chronic characteristics.6 The persistence of AD in early childhood was found to be one of the most important risk factors for adolescent AD and atopic march.78 The early life decisive factor determining the remission or persistence of AD is not yet known.
In patients with AD, the proportions of Escherichia coli, Staphylococcus aureus and Clostridia, including Clostridium difficile, in the gut microbiome are higher than in healthy controls, whereas those of Bacteroidetes, Bifidobacterium and Bacteroides are lower.910 In our previous study, we found that a decrease in microbial genes required for the development of the host immune system through the reduction of mucin-degrading bacterial (Akkermansia muciniphila, Ruminococcus gnavus, and Lachnospiraceae bacterium 2_1_58FAA) colonization of the gut was significantly associated with stunted immune development in AD infants. Most of the previous studies in this regard have reported that the gut microbiome is associated with the development of AD.11 However, the relationship between the natural course of AD and gut microbiota has not yet been described.
Short-chain fatty acids (SCFAs), such as butyrate, propionate, and acetate, are primary energy sources with anti-inflammatory and immunomodulatory effects, regardless of their interactions with gut epithelial barrier.12 Alterations of gut microbiome affect the balance of immune system via the production of metabolites, which can cause an inflamed microenvironment with the presence of specific microbiome in the gut.13 A recent study showed that lower levels stool SCFAs were associated with the development of AD in infants.14 Butyrate-producing bacteria, such as Coprococcus eutactus in the gut,15 are increased in infants with mild AD or healthy infants than in those with severe AD.16 Therefore, concurrent considerations on the composition of gut microbiota with their functions as well as the related metabolites are needed to identify the effect of gut microbiota on the pathogenesis of AD.
In our present study, we further investigated the role of the gut microbiome in determining the natural course of AD. Moreover, because AD develops during an early stage around first 6 months, so we need search for early microbiome associated markers for prediction of AD. We thus analyzed whether the composition and function of the gut microbiota and stool SCFA at 6 months of age could affect the course of AD in early childhood.
MATERIALS AND METHODS
Subjects and study design
The study population consisted of 132 Korean infants involved in the Cohort for Childhood Origin of Asthma and Allergic Diseases (COCOA), which was a previously established general population-based birth cohort.17 In COCOA, women in the third trimester of pregnancy were recruited from 5 tertiary hospitals and 8 public health centers for prenatal care; all centers are located in Seoul, Korea. Recruitment took place between August 2007 and August 2015. A woman was recruited if she 1) lacked high-risk conditions that could affect the development of allergic diseases in the child (e.g., diabetes, preeclampsia, anemia, and severe infection); 2) planned to deliver at an affiliated medical center; and 3) was a resident of Seoul. The eligibility of the baby was determined soon after delivery by collaborative efforts of obstetricians and pediatricians. Babies were excluded at birth if 1) their gestational age was less than 37 weeks or 2) they had any major congenital anomalies or birth asphyxia that required oxygen supplementation.
Gut microbiota was prospectively analyzed from 84 healthy infants, and those with transient AD (n = 22) and persistent AD (n = 26) at 6 months of age in available fecal samples of COCOA. The transient AD phenotype was defined as a development of AD at 6 months of age and remission of this condition by 1 year of age. Persistent AD was defined as a development of AD at 6 months of age with persistent symptoms at 2 years of age by a pediatric allergy specialist. The baseline characteristics of the subjects are presented in Table. A diagnosis of AD was based on the Hanifin and Rajka's criteria18 and the control group (subjects without AD) was defined by a lack of history of any visible signs of skin eczema indicative of AD and non-use of steroid treatment for the skin, which was confirmed by a pediatric allergy specialist. The severity of AD using the scoring of AD (SCORAD) index was simultaneously assessed at the time of fecal collection at 6 months of age from infants who had received no prior antibiotics for confirmed the microbiome marker before antibiotics use, because the effects of antibiotics on microbiome profiles could be especially significant.
Table
Characteristics of the study population

Values are presented as number (%) and mean ± standard error. No history of antibiotic use before sampling.
AD, atopic dermatitis; IgE, immunoglobulin E; ND, not done; SCORAD, scoring of atopic dermatitis.
*Mann-Whitney test.
![]()
This study was approved by the Institutional Review Boards (IRBs) of Asan Medical Center (IRB No. 2008-0616), Samsung Medical Center (IRB No. 2009-02-021), Severance Hospital (IRB No. 4-2008-0588), CHA Medical Center (IRB No. 2010-010) and Seoul National University Hospital (IRB No. H-1401-086-550). The Ethics Committee of Asan Medical Center approved this study, and all participants or their parents (in cases in which the participants were < 17 years old) provided written informed consent.
Genomic DNA extraction and 16s rRNA pyrosequencing
To control for external factors that might alter the composition of the microbiome, we only included subjects with no history of antibiotic use prior to stool sampling. Parents collected fecal samples from diapers at 6 months of age and immediately placed them at −20°C. Each center transported the diapers in ice-boxes to Asan Medical Center within 4 hours, which were immediately stored at −80°C before being processed for DNA extraction. Metagenomic DNA was isolated from these fecal samples using a Power Microbiome RNA/DNA Isolation kit (MO BIO/Qiagen, Carlsbad, CA, USA) in accordance with the manufacturer's instructions. DNA was eluted in 50 µL of elution buffer and stored at −20°C prior to use. Genomic DNA concentrations and purity were assessed by spectrophotometry. After removing humic acid with the Power-Clean® DNA Clean-Up Kit (MO BIO Laboratories, Carlsbad, CA, USA), polymerase chain reaction (PCR) was performed for each fecal specimen to amplify the 16S rRNA gene targeting V1-V3 of the variable region using barcoded primers. Sequencing was performed on a Roche/454 FLX Titanium system (Roche, Mannheim, Germany) according to the manufacturer's instructions. The total amount of bacteria in fecal samples was determined by using quantitative real-time PCR for 16S rRNA genes. More detailed procedures of this pyrosequencing method are provided in our previous study.11
Whole metagenome sequencing of functional genes
Forty-eight healthy controls 12 transient AD subjects and 16 persistent AD subjects were used for whole metagenome sequencing, because only 76 subjects were sufficient in fecal volume to perform for whole metagenome sequencing. The baseline characteristics of these subjects are provided in Supplementary Table. Metagenomic DNA from selected samples was fragmented using a Covaris M220 sonicator (Covaris, Inc., Woburn, MA, USA), and metagenomic libraries were prepared using the TruSeq DNA sample preparation kit according to the manufacturer's instructions (Illumina, San Diego, CA, USA). The size of the prepared libraries was confirmed using a Bioanalyzer 2100 (Agilent Technologies, Santa Clara, CA, USA). Equimolar concentrations of each library (2 nM) were calculated by quantitative real-time PCR using the CFX 96 Real-Time System (Bio-Rad, Hercules, CA, USA) with Illumina adapter sequence primers. Sequencing was performed using the Illumina HiSeq 2500 system (250 bp paired ends).
Sequences from the HiSeq 2500 sequencer were trimmed using the Nesoni clip tool within the Nesoni high-throughput sequencing data analysis toolset (ver. 0.127, http://www.vicbioinformatics.com/software.nesoni.shtml) to remove the Illumina adapter sequences and sequences with short read lengths (< 150 bp in each pair) and low Q scores (< 15). Contaminating human genes were removed using BBMap (http://sourceforge.net/project/bbmap) by mapping to a reference human genome. Functional profiling of metagenomic sequences was performed using HUMAnN2, which uses pan-genome mapping sequences to functionally annotate species pangenomes determined by taxonomic profiling from MetaPhlAn2. The resulting functional profiles were obtained in terms of gene family abundance at the community level in reads per kilobase to normalize for gene length. The resulting UniRef50 IDs were converted to the KEGG Orthology (KO) based on the matching K numbers (http://www.genome.jp/kegg/kegg2.html). Converted KO categories were compared among the groups. More detailed procedures of this whole metagenome sequencing method are provided in our previous study.11
Measurement of the total serum immunoglobulin E (IgE) and eosinophil
The total serum IgE levels and percentage of blood eosinophils were measured at 1 year of age. The total serum IgE levels were measured using the ImmunoCAP-CAP 1000 system (Phadia AB, Uppsala, Sweden). Concentrations of at least 0.35 kU/L (corresponding to CAP class 1) were considered positive. Atopy was defined as a ≥1 positive response. Eosinophils were counted using an automatic blood-cell counter (XE-100; Sysmex Co., Kobe, Japan).
Measurement of SCFAs
SCFAs as acetate, propionate, butyrate, and valerate, are prospectively analyzed in fecal samples from healthy infants (n = 33), and those with transient AD (n = 12) and persistent AD (n = 12) at 6 months of age. Briefly, fecal samples of 200 mg were diluted at ratio 1:4 (w/v) in deionized water, and then these samples were vigorously vortexed and upper layer supernatants were collected after centrifugation. Supernatants were extracted by shaking with internal standard solution, 20 μL of 0.6 N HCl and 2 mL of diethyl ether. After centrifugation, the upper layer supernatant was collected and completely dried under vacuum. The sample was reconstituted with 100 μL acetonitrile. SCFAs were analyzed with GC-MS (7890A/5975A [Agilent]), and HP-5 MS 30 m × 250 μm × 0.25-μm column (Agilent 19091S-433).
Statistical analysis
Differences between the characteristics of our 3 study groups were analyzed using the linear regression test for trend. Alpha- and beta-diversity analyzed using Calypso, an online tool (found at http://cgenome.net/calypso/). Differences in bacterial alpha diversity (richness; operational taxonomic units [OTUs] and Shannon index) among the studies were evaluated using analysis of variance. Significantly different microbial members between the clusters were analyzed again by the linear discriminant analysis effect size (LEfSe). The statistical significance was defined as an alpha level of 0.05 and an effect size threshold of 4 were used to identify differences in levels of different taxa between the groups.
Comparisons of the relative abundance of gut microbiota between the 2 groups were performed using the Mann-Whitney U test. Correlations between the total IgE, eosinophils (%) at 1 year of age, SCORAD at 6 months of age and relative abundance of gut microbiota were analyzed using the Spearman correlation test. Differences in the gut composition among the 3 groups were analyzed using the Kruskal-Wallis test and the Mann-Whitney U test.
Significantly different KO categories among the groups were identified using the Kruskal-Wallis test and the Mann-Whitney U test. Significant pathways had a P value < 0.05. Furthermore, differences between bacterial taxa among the groups were tested by the Kruskal-Wallis test. The Kruskal-Wallis test was used to compare the frequency of each taxa among groups. After identifying taxa with significantly different frequencies among the groups, corrections were made using the Benjamini-Hochberg False Discovery Rate multiple testing correction.1119 All statistical analyses were conducted using SPSS statistical software, version 24.0 (SPSS Inc, Chicago, IL, USA), with P < 0.05 considered to indicate statistical significance.
RESULTS
Characteristics of the study subjects
Detailed data regarding the characteristics of the study population are summarized in Table. We divided our study population into healthy controls, and subjects with either a transient or persistent AD phenotype. A parental history of allergic disease and food sensitization were higher in the persistent AD group among the 3 phenotypes (P = 0.003 and P < 0.001, respectively). Specific IgE (egg and milk IgE) and percentage of eosinophil were highest in the persistent AD among the 3 phenotypes (P < 0.005, P < 0.012 and P < 0.001, respectively). The SCORAD at 6 months of age was higher in the persistent AD (mean ± standard error; 27.48 ± 3.19; P = 0.004) compared to the transient AD (15.17 ± 1.72). The total IgE levels were more increased in the persistent AD subjects than in the healthy control and transient AD groups (P = 0.013).
Comparison of the diversity and composition of the gut microbiota
A total of 2,507,762 high quality reads were analyzed from fecal samples of matching selected infants in this study (n = 132). We assessed the alpha-diversity to examine the similarity of the 3 sets of samples. Alpha diversity results indicated that the richness (OTUs) and Shannon index did not differ among the 3 groups (P > 0.05; Fig. 1A and B). Comparing the beta-diversity of the different 3 groups did not show any significance (Fig. 1C).
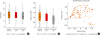 | Fig. 1Bacterial alpha and beta-diversity within the gut microbiota of the infant subjects. (A, B) Dotplots of richness (OTUs) and Shannon index of alpha diversity in the gut microbiota were compared among the study groups. (C) The beta-diversity of microbiota was compared using the PCoA plot based on unweighted UniFrac distances.OTU, operational taxonomic unit; PCoA, principal coordinates analysis; ANOVA, analysis of variance; AD, atopic dermatitis.
|
The composition of the gut microbiota among our 3 study groups was then examined at the phylum and genus levels (Fig. 2A and B). At the phylum level, Actinobacteria, Firmicutes and Proteobacteria were predominant among the 3 phenotypes. The proportion of Actinobacteria was higher in the transient AD subjects than the healthy controls (P = 0.029, Fig. 2A). However, the difference between the Firmicutes and Proteobacteria was not significant among the 3 groups (P > 0.05; Fig. 2A).
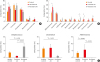 | Fig. 2Phylum and genus compositions of the gut microbiota of the infant subjects. Comparison of bacterial (A) phylum and (B) genus in each group expressed as the mean diameter ± standard error with the P value. Orange denotes the healthy control group, red denotes the transient AD group, and gray denotes the persistent AD group. (C) Comparison of the Streptococcus, Clostridium and Akkermansia compositions within the gut microbiota. The significance of any differences between groups was tested using the Mann-Whitney U test.AD, atopic dermatitis.
*P < 0.05; †P < 0.01.
|
We further identified differences in the microbiota composition at the genus level. Analysis using LEfSe revealed significant abundance differentials between the AD phenotypes with effect size threshold of > 4 (P < 0.05, Supplementary Fig. S1). Streptococcus was significantly higher in persistent AD (7.93% ± 2.47%) compared with the healthy control and transient AD (3.59% ± 0.91% in controls, P = 0.012 and 1.09% ± 0.39% in transient AD, P = 0.004; Fig. 2B and C). The proportion of Clostridium was significantly higher in controls (6.45% ± 1.24%) compared with the persistent AD (1.12% ± 0.74% in persistent AD, P = 0.013, Fig. 2B and C), but was not different between the healthy control and transient AD (6.97% ± 2.93% in transient AD, P > 0.05, Fig. 2C), or between the transient and persistent AD (P > 0.05, Fig. 2C). Further, Akkermansia species were at lower levels in the persistent AD infants (0.01% ± 0.01%) compared with transient AD infants (5.61 ± 3.98, P = 0.019, Fig. 2B and C). Moreover, the composition of Akkermansia in transient AD infants was higher than the healthy controls (3.27% ± 1.18%, P = 0.049; Fig. 2B and C). However, the Akkermansia abundance was not different between the healthy control and persistent AD groups (P > 0.05, Fig. 2C). Samples dominated by Firmicutes were separated according to the dominance of Streptococcus and Clostridium. Although the E. coli abundance was higher in all 3 phenotypes, the differences in these bacterial compositions were not significant (P > 0.05; Fig. 2B). Moreover, Bifidobacterium was higher in the transient AD subjects than in the healthy controls (P = 0.027, Fig. 2B).
Correlation between the total IgE, SCORAD, and eosinophil (%) and the gut microbiota composition
To investigate the role of Streptococcus and Clostridium in clinical parameters of AD, we analyzed the relationship between the total IgE (IU/mL), SCORAD, eosinophil level (%) and the relative abundance of Streptococcus and Clostridium in the AD groups (Fig. 3). Relative abundance of Streptococcus in AD was positively correlated with the SCORAD (rho = 0.493, P = 0.001; Fig. 3A), but not with the total IgE or eosinophil (%) (P > 0.05; Fig. 3B and C). In addition, Clostridium abundance was negatively correlated with SCORAD (rho = −0.651, P = 0.003; Fig. 3D), but not correlated with the total IgE or eosinophil (%) (P > 0.05; Fig. 3E and F). There was no correlation between Akkermansia and the SCORAD, eosinophil (%) or total IgE levels (data not shown).
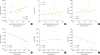 | Fig. 3Correlation between the IgE, SCORAD, eosinophil, Streptococcus and Clostridium levels in the infant guts. (A) Relationship between the log transformed relative abundance of Streptococcus in the infant guts and the SCORAD in both the transient and persistent AD groups. (B) Relationship between the log transformed relative abundance of Streptococcus in the infant guts and log transformed total IgE (IU/mL) in both the transient and persistent AD groups. (C) Relationship between the log transformed relative abundance of Streptococcus in the infant guts and log transformed eosinophil level (%) in both the transient and persistent AD groups. (D) Relationship between the log transformed relative abundance of Clostridium in the infant guts and log transformed SCORAD in both the transient and persistent AD groups. (E) Relationship between the log transformed relative abundance of Clostridium in the infant guts and log transformed total IgE (IU/mL) in both the transient and persistent AD groups. (F) Relationship between the log transformed relative abundance of Clostridium in the infant guts and log transformed eosinophil level (%) in both the transient and persistent AD groups.IgE, immunoglobulin E; SCORAD, scoring of atopic dermatitis; AD, atopic dermatitis.
|
Different functional profiles in the gut microbiota in accordance with AD persistence
Functional gene differences among the study groups were compared using KO categories after the removal of human and plant gene sequences. The whole-metagenome analysis was identified based on 16S rRNA gene sequencing. Significantly different KO categories were selected using a P value < 0.05. We thereby identified 6 pathways of first KO categories including 44 pathways of second KO categories (Supplementary Fig. S2). We found that immune system and development pathway genes were decreased in the persistent AD compared to the healthy controls (P < 0.05; Supplementary Fig. S2B) and that metabolism of cofactors and vitamin pathway genes were increased in the persistent AD compared to the transient AD (P < 0.05; Supplementary Fig. S2). We next confirmed the 3rd KO categories among the groups. The relative abundance of genes associated with oxidative phosphorylation was decreased in the persistent AD compared to the healthy controls (P = 0.001; Fig. 4). A. muciniphila weakly contributed to differences in the expression of oxidative phosphorylation genes between persistent AD and healthy controls (P = 0.094).
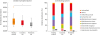 | Fig. 4Comparison of the metabolic pathways in the infant gut microbiota using metagenome analysis. Comparison of the functional genes related to oxidative phosphorylation and their contributing species among the study groups. Black arrow denotes Akkermansia muciniphila, P = 0.094.AD, atopic dermatitis.
*P = 0.001.
|
Comparison of SCFAs levels according to the persistence of AD
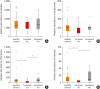
Butyrate and valerate levels were lower in infants with transient AD than in healthy controls (P = 0.011 and P = 0.004, respectively; Fig. 5C and D) and those in the persistent AD group (P = 0.020 and P = 0.008, respectively; Fig. 5C and D). Propionate levels were weakly lower in the transient AD group compared with healthy controls (P = 0.051, Fig. 5B). However, there were no statistical differences in the acetate and propionate levels among the 3 groups (P > 0.05; Fig. 5A).
DISCUSSION
We compared the composition and functional genes of the gut microbiome in infants at 6 months of age according to the persistence of AD up to 2 years of age. In subjects with the persistent AD phenotype, the proportion of Streptococcus was higher and that of Clostridium was lower compared to healthy controls. The proportion of Akkermansia was higher in children with the transient AD phenotype than in the controls or persistent AD cases. The relative abundance of Streptococcus was positively associated with the SCORAD and that of Clostridium was negatively associated with this value. These results suggest that the balance of gut Streptococcus, Clostridium and Akkermansia in early life is associated with the natural course of AD. Moreover, decreased oxidative phosphorylation related with A. muciniphila in the gut microbiota was associated with the persistence of AD. Butyrate and valerate levels in SCFAs were lower in infants with transient AD group than healthy controls and those in the persistent AD groups. potential model for gut microbiome composition, their functional gene and metabolites in the natural course of AD by the present study is summarized in Fig. 6.
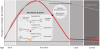 | Fig. 6Potential model for compositions, functions and metabolites of the gut microbiome according to the natural course of AD.AD, atopic dermatitis; SCFA, short chain fatty acid.
|
Most studies to date have reported on the relationship between the composition and diversity of gut microbiota and the development of AD.15 Early-life microbial dysbiosis in the gut has been linked to the development of AD in previous studies.91016 It has been reported that diversity of gut microbiota during the first month of life is associated with subsequent AD,9 whereas other studies show the no association between the diversity of gut microbiota and AD.1520 A high abundance of butyrate-producing bacteria including Roseburia intestinalis, C. eutactus and Anaerostipes caccae in the gut in 6-month-old infants with atopic eczema alleviates the symptoms of this disease.16 The highest risk group for childhood atopy and asthma are reported to have lower Faecalibacterium abundance in the neonatal gut microbiota.21 LEfSe analysis in our current study revealed a significant differential abundance of gut microbiota among children with AD (effect size threshold > 4, P < 0.05; Supplementary Fig. S1); however, most gut microbiota are less abundant (< 5%) in infants. Although our current analysis and previous studies indicate the significance of gut microbiota dysbiosis in AD onset, the mechanisms by which specific microbial alterations regulate the inflammation underlying AD remain unknown.
In a recent study, colonization by gut Clostridium in infancy was associated with wheeze, asthma and eczema.92223 In contrast, the high abundance of Clostridia in infancy negatively correlated with blood eosinophils,10 and similar to our current results, its prevalence in the gut microbiota of allergic infants, i.e., who had a positive skin prick test, was lower than the healthy controls.24 Eosinophils regulate a variety of pathways in immune homeostasis, and play an important role in the development of AD.25 When Clostridium colonizes in the gut of mouse model, serum IgE is decreased in ovalbumin-alum treated mice.26 The results of these previous studies support our current findings showing an association of Clostridium with the AD persistence and severity. The increase in gut Streptococcus may thus be linked to not only the development of AD but also its severity from this study. However, association between Streptococcus in the gut and AD has not been elucidated previously. The aerobic and the facultative anaerobic bacteria, including pathogenic bacteria such as Enterococcus, Streptococcus and E. coli are subdominant bacteria in the gut.27 These bacteria facilitate the growth of anaerobic bacteria such as Bifidobacterium, Clostridium and Bacteroides by consuming the intestinal oxygen and aerobes gradually decrease.28 Eventually, 99.9% of gut microbiota was composed of anaerobic bacteria in the normal gut environment. In the present study, the relative abundance of Streptococcus at 6-month of age was significantly higher in the persistent AD group than that in the healthy controls and the transient AD group. This finding suggests that late establishment of anaerobic bacteria in association with Streptococcus in infants aged 6 months old may lead to imbalance of gut microbiota, which may be associated with the persistence of AD. Hence, even though a direct link between gut Streptococcus and AD is yet to be determined, it may be mediated through local or systemic inflammatory cytokines. Further studies are necessary to investigate the role of gut Streptococcus in infancy. In addition, the mucin-degrading bacteria, including A. muciniphila, contributes to the normalization of gut colonization by providing the degraded mucin for energy and a source of nutrients.1129 High abundance of Akkermansia in the transient AD group may help the growth of anaerobe and thereby affect the remission of AD.
A. muciniphila, which was found to be a beneficial gut bacterium and maintain the integrity of the gut barrier,1130 is known to be decreased in individuals with allergic diseases such as AD and food allergy1131 as well as patients with other autoimmune diseases such as diabetes type 2.32 A. muciniphila is known to exert negative effects of IFN-γ on glucose metabolism in the intestine33 and induce the pro- and anti-cytokine responses of human peripheral blood mononuclear cells.34 Previous reports have indicated the association of A. muciniphila with the alteration of functional genes related to host immune development in AD.11 These previous studies support our current findings that higher relative abundance of gut Akkermansia promotes the availability of nutrients for other microbiota and alters the immune response that may affect AD remission.
Recent metagenome shotgun analysis has also revealed the relationship between gut microbiota function and AD.1135 One recent study reported that differences in functional genes related to host immune development in the gut microbiota were associated with AD in 6-month-old infants,11 and another reported that the dysbiosis of Faecalibacterium prausnitzii can lead to an increased risk of AD by reducing butyrate and propionate.35 However, there has been no prior study showing that an imbalance in the infant gut microbiota affects the AD phenotype and that the natural course of the disease in early life is impacted by differences in the gut metagenome. Regulatory T cells are dependent on oxidative phosphorylation for their energy tolerance, and cytotoxic and effector T cells are dependent on glycolysis for not only their proliferation but also the production of cytokines.36 These energy metabolic pathways are known to affect the health of the microbial community in the human gut.37 Our current results thus suggest that reduced oxidative phosphorylation is associated with the alteration in regulatory T cells and energy metabolism, which might subsequently affect the persistence of the AD phenotype.
SCFAs serve as an important energy source that regulates the inflammatory and immune response and energy metabolism.3839 SCFAs regulate metabolic sensors to stimulate oxidative phosphorylation, which produces energy in B cells and mitochondria.4041 In addition, acetate can cause suppression of allergic airway diseases by enhancing the numbers and function of regulatory T cells.42 The G protein-coupled receptors (GPCRs) as a regulator of energy balance was stimulated by SCFAs and the induced GPCRs affect the inhabitant of gut microbiota.4344 A. muciniphila is one of the inhabitant gut microbiota, which modulates expression of GPCRs, such as Gpr43.45 In a previous study, the presence of A. muciniphila was associated with alteration in functional genes related to host immune development in AD.11 The mucin degradation of A. muciniphila leads to generation of SCFAs, which is of help to the host and surrounding microbiome in gut.46 Conversely, the consumption of SCFAs is needed for the activity of A. muciniphila. Our current results suggest that reduction in oxidative phosphorylation may be influenced by the increased levels of SCFAs in the gut through reduction in SCFAs consumption (Fig. 4 and 5C and D). Hence, the reduction in SCFAs levels in infants with transient AD group may be due to the use of SCFAs for remission. Therefore, a reduction in the gut composition of A. muciniphila, alteration in SCFAs and the oxidative phosphorylation levels, which may be associated with inflammatory responses and/or energy-related metabolism, may play a role in the remission of AD in early life. Further studies are necessary to clarify these findings, including functional studies to elucidate the mechanisms mediated by Akkermansia.
Our study has several strengths of note. First, our study subjects were obtained from a previously established general population-based prospective cohort. Secondly, the AD phenotype, in terms of the natural course of this disorder, was assessed by pediatric allergists. Thirdly, this is the first study to reveal a difference in the gut microbiota composition, functions and stool SCFAs in relation to the natural course of AD. Finally, we analyzed stool samples from children that had not received antibiotics that could have affected the composition of the gut microbiota.
Our present study also had some limitations of note. The AD severity in our present series was mostly mild, as our subjects were sourced from a general population-based cohort. This reflects the low incidence of severe AD in infancy in the general population. Secondly, the sample size used in this analysis was relatively small, so we need to be careful to generalize these results. Thirdly, the human intestinal microbiota was comprised of bacteria, fungi and viruses, but we did not consider the roles for fungi and viruses. Further studies are necessary to resolve these limitations, including a replication study using most of our current subjects and functional studies to assess these phenomena mechanistically. It should also be noted that we analyzed the follow-up data regarding the progression of AD which was recorded by pediatric allergists from birth to 2 years of age and performed 16s rRNA sequencing as well as metagenome shotgun analysis of stool samples at 6 months.
In conclusion, an imbalance between gut Streptococcus, Clostridium and Akkermansia and a decrease in oxidative phosphorylation-related microbial functional genes may determine the natural course of AD in early life. SCFAs in the gut and decreased oxidative phosphorylation related to A. muciniphila in the gut microbiota were associated with the persistence of AD via energy supplementation to specific gut microbiota and via regulation of immune response. Our current findings suggest that the observed associations between the gut microbiome and persistent AD can be clinically useful in the prediction of AD persistence in early life.
 XML Download