

 PDF
PDF ePub
ePub Citation
 Print
Print


INTRODUCTION
Chronic rhinosinusitis (CRS) is one of the most prevalent chronic diseases in humans; it affects up to 12.5% of the US population and has a significant socioeconomic impact.12 CRS is mainly characterized by inflammatory disease of the paranasal sinuses and mucosa of the nose.34 Among the various pathophysiological processes of CRS, association of osteitis has been reported as part of CRS development and maintenance.3 Osteitis is a process of neo-osteogenesis and remodeling of the bone in CRS patients.5 Previous studies have demonstrated the close contact between nasal mucosa and paranasal bones in patients with CRS using radiological methods, suggesting the contribution of this tissue toward favoring bone remodeling.67 Also, association of ethmoid bone in osteitis has previously been demonstrated.8
A previous study reported that 36% of primary CRS patients showed evidence of new bone formation.9 In addition, several studies revealed that bone inflammation in patients with CRS varies from 36% to 100%.10 In particular, the osteitic bone acts as a nidus for inflammation, possibly contributing to the recurrence of CRS after surgical treatment.11 Various studies indicate that osteitis positively correlates with poor prognosis of endoscopic sinus surgery and recalcitrant CRS.1213 Moreover, osteitis is associated with worse computed tomography (CT) outcomes, tissue eosinophilia, nasal polyps (NPs), and serum eosinophilia.141516 Although it is necessary to understand the involvement of osteitis in terms of CRS progression, the mechanisms underlying regulation of bony changes in chronic inflammatory conditions are poorly understood due to the lack of appropriate animal models, making clinical and experimental studies difficult.
Until now, rabbits have been used as experimental animal models for studying osteitis in CRS, and these studies showed inflammatory participation of the underlying bone matrix and the Haversian system. 71718192021 The observations, including mucosal inflammation and signs of new or re-modeled bones in rabbits, support the idea that bone formation could participate in CRS progression. However, considering that bacteria in the bones of the paranasal sinuses have never been described, most of the recent studies using animal models with bacteria inoculation into the maxillary sinuses of rabbit are not comparable disease models to human CRS. Certain areas in the nasal sinus were also injured during the inoculation process, and this could induce tissue inflammation regardless of infection. In addition, the rabbit osteitis model has disadvantages in terms of higher housing cost and unavailability of genetic manipulation. Therefore, establishing a proper murine model for neo-osteogenesis facilitates the study of the roles of osteitis in greater depth, and this may improve the development of novel therapeutic agents to treat refractory osteitis in CRS patients.
In this study, we investigated the histopathological and radiographic changes associated with neo-osteogenesis and explored the relationship between interleukin (IL)-13 and runt-related transcription factor 2 (RUNX2) in a previously introduced murine eosinophilic NP model.
MATERIALS AND METHODS
Animals and tissue preparations
For all experiments, BALB/c male mice (4 weeks old, 24–25 g) were purchased (Central Laboratory Animals, Seoul, Korea) and kept for 1 week in specific pathogen-free rooms before initiating experiments. All experiments involving animals were approved by the Institutional Animal Care and Use Committee of Seoul National University and complied with governmental and international guidelines on animal experimentation. We utilized the murine NP model following previous reports with some modifications.2223 For induction of NP in mouse nasal cavity, mice were sub-divided into the control group (n = 14) and the experimental group (n = 20), and treated with either phosphate-buffered saline (PBS) or 3% ovalbumin (OVA) plus 10 ng of staphylococcal enterotoxin B (SEB). For treatments with resveratrol (RSV) and dexamethasone, mice were categorized into a control group (group A; n = 6) and three experimental groups (groups B, C, and D; n = 12, 7, and 7, respectively). After treating with 3% OVA for 47 days, mice were administered RSV (0.44 µg per nostril) 3 times a week for 8 consecutive weeks. Dexamethasone (1 mg/kg) was delivered once a week for 8 consecutive weeks. The 3% OVA and SEB were applied before administrating the drugs. Mice were sacrificed 1 day after the last treatment. PBS was applied for both systemic and local stimulation in group A. Mouse sinonasal tissue specimens for various types of analysis were prepared as previously described.24
Micro-CT-based evaluation of bone thickness
The skull of each mouse (n = 3 from each group) was subjected to micro-CT (NFR-Polaris-G90; NanoFocusRay, Jeonju, Korea). Cross-sectional images were converted to the Digital Imaging and Communications in Medicine format using PMOD software (PMOD Technologies LLC, Zurich, Switzerland). For neo-osteogenesis evaluation, the same coronal plane showing the true maxillary sinuses and ethmoid labyrinths was selected for each mouse. The nasal bone thickness was measured at 5 different points on both right and left lateral walls and evaluated using Image J software (version 1.52p, National Institutes of Health [NIH] Image processing analysis, http://rsb.info.nih.gov/ij/).
Histopathological analysis and immunohistochemistry of animal tissues
Detailed experimental procedures for processing the sinonasal tissues and immunohistochemistry were previously described.2425 Briefly, the heads of mice were fixed in 4% PFA (Biosesang, Seongnam, Korea), decalcified in 5% nitric acid (Sigma-Aldrich, St. Louis, MO, USA), dehydrated, processed according to standard paraffin-embedding procedures, and coronally sectioned into 3-µm-thick sections. An atlas of normal murine sinonasal anatomy was used to standardize the anatomic locations being examined.26 Several stains were conducted to compare characteristics between groups: hematoxylin and eosin (H&E; Sigma-Aldrich) for general morphology, Sirius red (Polysciences Inc., Warrington, PA, USA) for eosinophils, Giemsa (Sigma-Aldrich) stain for mast cells, periodic Acid-Schiff (Sigma-Aldrich) stain for goblet cells, and Masson's trichrome (Sigma-Aldrich) stain to highlight collagen deposition in the sub-epithelial layer, following the manufacturer's instructions. For immunohistochemistry, sections were stained with RUNX2, osteonectin, and IL-13 antibodies. Detailed information is indicated in Supplementary Table S1. The sections were then incubated with broad antibody enhancer and polymer-horseradish peroxidase (HRP) using polink-2 plus polymerized HRP broad 3,3′-Diaminobenzidine (DAB) Detection System (Golden Bridge International Labs., Bothell, WA, USA) following the manufacturer's recommendations. Five areas from nasal tissue sections were chosen randomly for evaluation under high-powered fields (HPFs; magnification ×1,000) and measured by 2 examiners who were blinded to group assignment. The numbers of NPs were counted following the previous standards,24 quantified microscopically from 5 coronal sections, and presented as total number. The numbers of eosinophils, mast cells, and goblet cells were shown as the average numbers from 5 HPFs. Sub-epithelial fibrosis was evaluated as previously described.27 For the assessment of bone thickness, at least 5 measurements at different points were made in the appropriate area of each HPF (×400 magnification), and measured using Image J software (version 1.52p, NIH Image processing analysis, http://rsb.info.nih.gov/ij/).
Immunofluorescence (IF) staining and confocal microscopy
For IF staining, the tissue sections were processed as described previously.24 Briefly, mouse nasal tissues were de-paraffinized, rehydrated, boiled in citrate buffer (Dako, Carpinteria, CA, USA) for epitope retrieval, fixed in 4% paraformaldehyde (PFA; Biosesang, Seongnam, Korea), washed 3 × 5 minutes in PBS containing 0.2% Triton X-100 (PBST), blocked in PBST containing 5% bovine serum albumin (BSA) (BSA-PBST) for 3 hours, incubated with primary antibodies diluted in BSA-PBST (Sigma-Aldrich) overnight at 4°C, washed 3 × 5 minutes with PBST, stained with secondary antibodies in BSA-PBST for 1 hour in the dark at room temperature, washed 3 × 5 minutes with PBST, stained with 4′,6-Diamidino-2-phenylindole (Sigma-Aldrich) for 15 minutes at room temperature, mounted with fluorescence-mounting medium (Vector Laboratories Inc., Burlingame, CA, USA). The primary antibodies utilized are summarized in Supplementary Table S1. Images were acquired with a Zeiss fluorescent microscope using AxioVision software (Carl Zeiss Vision, Thornwood, NY, USA). The images were edited using Zen Blue software (Zeiss, Oberkochen, Germany). Immunostaining was not observed in control sections incubated with normal serum instead of the primary antibodies (data not shown).
RNA extraction and quantitative real-time polymerase chain reaction (PCR)
Total RNA was collected from the tissue samples using QIAshredder and RNeasy Plus Mini kit (both Qiagen, Redwood City, CA, USA) following the manufacturer's recommendations. Total RNA (1 μg) was reverse transcribed to cDNA using the Tetro cDNA-synthesis kit (Bioline, Eveleigh, Australia) following the manufacturer's instructions. Quantitative real-time PCR was performed as previously described.24 Briefly, polymerase chain reaction was conducted with SYBR Green Polymerase Chain Reaction Master Mix (Enzynomics, Daejeon, Korea) and primers that specifically amplify genes for IL13, RUNX2, matrix metallopeptidase 9 (MMP9), collagen type 1 (COL1A1), and osteopontin (SPP1). Additionally, β-actin (ACTB) was used as reference gene for normalization. The relative fold changes were calculated by the comparative 2−ΔΔCq method. The primer sequences used in this study are described in Supplementary Table S2. Cycling conditions were 95°C for 10 minutes, followed by 40 cycles at 95°C for 10 seconds, 60°C for 1 minutes, and 72°C for 30 seconds. The PCR efficiency in all runs was close to 100%, and all samples were tested in duplicate.
Bioinformatic analysis
The normalized dataset (GSE23552), which contains 13 normal nasal mucosal tissues and 26 CRS microarray data, was imported from Gene Expression Omnibus (www.ncbi.nih.gov/geo). All tissues (n = 39) were divided into 3 groups: normal tissues (n = 13), chronic rhinosinusitis without nasal polyp (CRSsNP) tissues (n = 15), chronic rhinosinusitis with nasal polyp (CRSwNP) tissues (n = 11). The values of 2828688 (corresponding to IL13), 2908762 (corresponding to RUNX2), 3887210 (corresponding to MMP9), 3762198 (corresponding to COL1A1), and 2735027 (corresponding to SPP1) on each group were calculated and compared between the 3 groups using Spearman's correlation analysis. Enrichment analysis was also performed using Gene Set Enrichment Analysis (GSEA) software v3.0 and a formatted GCT file was used as input for the GSEA algorithm (available from: http://www.broadinstitute.org/gsea). For grouping the GSE23552 dataset, the value of the 2828688 probe was utilized as criteria for high expression group and low expression groups. In the analysis, pre-defined osteogenesis-related gene sets in the Gene Ontology collection (GO) from v6.2 molecular signature database (mSigDB c5 category; http://software.broadinstitute.org/gsea/msigdb) were used, and the number of permutations was set at 1,000. The gene sets with P < 0.05 and false discovery rate (FDR) < 0.25 were considered significantly enriched.
Statistical analysis
Data are expressed as mean ± standard errors (SEs) from 2 or more distinct samples unless indicated otherwise. We used unpaired Student's t-test (2-sided) or non-parametric Mann-Whitney U test (2-tailed) to compare differences between groups. In addition, correlations of protein or mRNA expression were determined using Spearman's P statistic or Pearson's P statistic. Statistical analyses were performed using SPSS 23.0 software (SPSS, Chicago, IL, USA). Illustrative figures were generated using Prism version 8.2.0 (GraphPad Software Inc., San Diego, CA, USA) and SigmaPlot version 10.0 (Systat Software Inc., San Jose, CA, USA).
RESULTS
Histopathological evidence of neo-osteogenesis in the eosinophilic CRSwNP model
To evaluate neo-osteogenesis in mice, we employed an experimental CRSwNP murine model based on previous reports with some modifications (Fig. 1A).242528 Because NPs are associated with osteitis severity and bone remodeling,29 we first checked the number of NPs in mouce nasal cavity. As expected, thickened mucosae with polyp-like lesions were found in the OVA/SEB-treated group, whereas no signs of inflammation were observed in control mice (Supplementary Fig. S1A). When we assessed sub-epithelial fibrosis, eosinophils numbers, mast cells numbers, and goblet cells numbers, following the previous report,30 we observed similar results (Supplementary Fig. S1B-E). In order to find evidence of bone remodeling, we next examined the number of osteoblasts and osteoclasts which are responsible for bone formation and bone resorption, respectively. We detected not only an increased number of osteoblasts and osteoclasts at the rim of the bone but also a woven bone with marked thickening periosteum in OVA/SEB-treated mice (Fig. 1B-D). The micro-CT findings exhibited areas of up-regulated bone thickness and irregular thickening of the sinus walls in OVA/SEB-treated mice. (Fig. 1E and F).
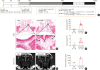 | Fig. 1Establishment of eosinophilic CRS with neo-osteogenesis murine model. (A) A schematic representation of the study protocol. (B) Representative images of decalcified tissue specimens showing histological evidence of neo-osteogenesis in mice. Insets in (B) show a magnified view of the outlined area (bottom). The rows of osteoblasts (arrowhead) at the rim of bone were noted. The white arrowhead indicates an osteoclast, while the black arrow indicates a Haversian canal. Original magnification ×2.5 (above) and insets ×40 (bottom). (C, D) The numbers of osteoblasts and osteoclasts per HPF were quantified in indicated groups. (E) Micro-CT evaluation of bony changes. Evidence of bone thickening (arrowhead) was found in the OVA/SEB-treated group. (F) Histo-morphometric analyses showed upregulation of bone thickness in the OVA/SEB-delivered group. All results are presented as mean ± SEM. Individual values are indicated by dots (C, D, F). Statistical significance was determined by Mann-Whitney U test for pairwise comparisons (C, D, F).
OVA, ovalbumin; SEB, staphylococcal enterotoxin B; PBS, phosphate-buffered saline; i.p., intraperitoneal; i.n., intranasal; HPF, high-powered field; CT, computed tomography; SEM, standard error of the mean.
*P < 0.01.
|
Increased RUNX2 expression in eosinophilic CRS with neo-osteogenesis
New bone formation is mainly mediated by mature osteoblasts. In this process, RUNX2 serves as master regulator and induces the differentiation of pre-osteoblast.31 Therefore, we inspected the expression of RUNX2 and the number of mature osteoblasts by using immunohistochemistry. We found that RUNX2-immunoreactive cells were significantly elevated in OVA/SEB-treated mice. RUNX2-immunoreactivity was particularly identified in osteoblasts lining the bone (Fig. 2A and B). The mature osteoblasts on the bone surface were evaluated on the basis of the expression of osteonectin (a differentiation marker for bone cells), as shown in Fig. 2A and C. By utilizing IF staining, we observed marked co-localization of RUNX2 and osteonectin mainly lining the bone in mice nasal tissues, as previously reported (Fig. 2C). Because RUNX2-induced differentiated osteoblasts induce osteogenesis, we compared the relationship between RUNX2 level and bone thickness. A significant positive correlation was detected between bone thickness and RUNX2-positive cell numbers (Fig. 2D; Pearson's correlation coefficient, P < 0.01). These results suggest that OVA/SEB-treated mice showed neo-osteogenic characteristics.
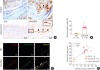 | Fig. 2OVA and SEB induced the expression of RUNX2 and osteonectin. (A) Representative photographs of immune-histochemical staining against RUNX2 (above) and osteonectin (bottom). Insets in (A) present a magnified view of the outlined area, and arrowheads denote representative positive cells (scale bar = 50 µm in above and scale bar = 20 µm in bottom). (B) The numbers of RUNX2-positive cells per HPF were counted in each group. (C) Co-localization of RUNX2 (red) and osteonectin (green) in nasal tissues revealed by immunofluorescence staining. Arrowheads indicate RUNX2 and osteonectin-double positive cells (yellow) (scale bar = 10 µm). (D) Relationship between bone thickness and RUNX2-positive cells. All results are presented as mean ± SEM. Individual values are indicated by dots (B, D). Statistical significance was determined by Mann-Whitney U test for pairwise comparisons (B). Pearson's r values and the corresponding P-values were determined by Pearson's correlation test (D).
OVA, ovalbumin; SEB, staphylococcal enterotoxin B; RUNX2, runt-related transcription factor 2; HPF, high-powered field; SEM, standard error of the mean.
*P < 0.01.
|
Increased IL-13 expression in eosinophilic CRS with neo-osteogenesis
We previously found that IL-13, one of the representative Th2 cytokines, induced neo-osteogenesis via RUNX2 expression.32 To verify this in our murine model, we evaluated the expression of IL-13. Immunohistochemistry studies revealed that IL-13 expression, in mucosal tissues overlying the bone, was increased in the OVA/SEB-treated mice compared to the PBS-treated mice (Fig. 3A and B). The number of IL-13-positive cells positively correlated with the number of RUNX2-positive cells (Fig. 3C; Pearson's correlation coefficient, P < 0.01). Moreover, IL-13-positive cell numbers showed positive association with bone thickness (Fig. 3D; Pearson's correlation coefficient, P < 0.05). Furthermore, mRNA expression levels of IL-13, RUNX2, and RUNX2 downstream genes (MMP9, COL1A1, and SPP1) were also increased in OVA/SEB-treated mice (Fig. 3E). This result indicates that IL-13, which was secreted during stimulation with OVA/SEB, could contribute to ossification via RUNX2, suggesting the possibility of osteogenesis in mice.
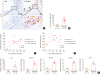 | Fig. 3OVA and SEB upregulated the expression of IL-13 and showed positive correlations with RUNX2 downstream genes. (A) Representative images of immune-histochemical staining against IL-13 (original magnification ×400). Insets in (A) show a magnified view of the outlined area, and arrowheads denote IL-13-positive cells (scale bar = 50 µm). (B) The number of IL-13-positive cells per HPF was counted and compared to the control group. Correlation of the number of IL-13-positive cells and the number of RUNX2-positive cells (C) or the number of IL-13-positive cells and bone thickness (D) in each group of mice. (E) Relative mRNA expressions of IL13, RUNX2, and RUNX2 downstream genes (MMP9, COL1A1, and SPP1) in mucosal tissues from mice were compared. All results are presented as means ± SEM. Individual values are indicated by dots (B-E). Statistical significance was determined by Mann-Whitney U test for pairwise comparisons (B, E). Pearson's r values and the corresponding P-values were determined by Pearson's correlation test (C, D).
OVA, ovalbumin; SEB, staphylococcal enterotoxin B; IL, interleukin; RUNX2, runt-related transcription factor 2; HPF, high-powered field; MMP9, matrix metallopeptidase 9; COL1A1, collagen type 1; SPP1, osteopontin; SEM, standard error of the mean; PBS, phosphate-buffered saline.
*P < 0.01.
|
Positive correlations between IL-13 and RUNX2 downstream genes in human CRS transcriptome
To verify the role of IL-13 in human nasal tissues, we conducted bioinformatic analysis using a previously published dataset (GSE23552). CRS patient tissues in the GSE23552 data set were categorized into IL13_high and IL13_low groups based on the median IL13 expression value to find gene expression signatures that correlated with IL13 expression (Fig. 4A). Importantly, many osteogenesis-related gene sets were enriched in the IL13_high group (Fig. 4B; P < 0.05, FDR < 0.25). Fig. 4C showed 2 representative enrichment plots of gene sets. Enrichment plots that were identified in Fig. 4B were indicated in Supplementary Fig. S2. We then compared the mRNA levels of IL13, RUNX2, and RUNX2 downstream genes between normal nasal tissues and CRS patient tissues. IL13 expression levels were higher in CRSwNP tissues than in normal nasal tissues. Similarly, transcript expression levels of RUNX2 and RUNX2 downstream target genes (SPP1, MMP9, and COL1A1) were also up-regulated in both CRSsNP and CRSwNP tissues (Fig. 4D). Spearman correlation analysis showed that IL13 expression positively correlated with SPP1 and MMP9 expression (Fig. 4E; Spearman's correlation coefficient, P < 0.05 and P < 0.01, respectively).
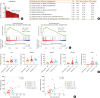 | Fig. 4IL-13 is upregulated in CRS patients and positively correlated with osteogenesis-related genes. (A) Distribution of IL13 mRNA levels in 26 human CRS nasal tissues (data set GSE23552). Based on the median value, the CRS patients with or without NPs were categorized into high and low groups. The number of CRS tissues are IL13 high group (n = 13) and IL13 low group (n = 13). (B) GSEA. osteogenesis-related gene sets were selected in the GO collection from MSigDB v6.2. The 8 gene sets which show a positive correlation with IL13 are presented (P < 0.05 and FDR < 0.25). (C) Representative enrichment plots of the GSEA analysis in the GSE23552 data set. (D) Relative mRNA levels of IL-13, RUNX2 and RUNX2 downstream genes in the nasal tissues obtained from the GSE23552 data set. (E) Correlation between IL13 and SPP1 or IL13 and MMP9. Spearman's correlation analysis was performed in each group of subjects. All results are presented as means ± SEM. Individual values are indicated by dots (D, E). Statistical significance was determined by Kruskal-Wallis tests (P < 0.01), followed by Mann-Whitney U test for pairwise comparisons (D). Spearman's r values and the corresponding P-values were determined by spearman's correlation test (E).
IL, interleukin; CRS, chronic rhinosinusitis; NP, nasal polyp; GSEA, Gene Set Enrichment Analysis; GO, Gene Ontology; FDR, false discovery rate; RUNX2, runt-related transcription factor 2; SPP1, osteopontin; MMP9, matrix metallopeptidase 9; SEM, standard error of the mean; ES, enrichment score; NES, normalized enrichment score; COL1A1, collagen type 1; CRSsNP, chronic rhinosinusitis without nasal polyp; CRSwNP, chronic rhinosinusitis with nasal polyp.
*P < 0.05; †P < 0.01.
|
RSV treatment diminished osteogenesis in eosinophilic CRS NP model
Finally, we deployed this eosinophilic murine NP model to evaluate the therapeutic effect of a drug candidate against osteitis (Fig. 5A). For this purpose, we used RSV and dexamethasone which are previously known to reduce NPs.2830 When we applied these drugs to the OVA/SEB-treated mice, we found decreased numbers of osteoblasts and bone thickness comparable to the PBS-treated mice (Fig. 5B). The expression of RUNX2-positive cells was diminished by the treatment of RSV and dexamethasone (Fig. 5C). A similar finding was observed regarding IL-13 (Supplementary Fig. S3). This result implies that our eosinophilic murine NP model might be applicable to evaluating the effects of some type of drugs targeting osteitis in terms of CRS.
 | Fig. 5Resveratrol suppresses the new bone formation in neo-osteogenesis murine model. (A) A schematic illustration of the study procedure. (B) Representative H&E photographs of nasal tissue specimens (left). The number of osteoblasts and bone thickness per HPF were quantified in specified groups and compared (scale bar = 50 µm). (C) Cells showing RUNX2 positivity per HPF were counted in designated groups and compared (scale bar = 20 µm). All results are presented as means ± SEM. Individual values are indicated by dots (B, C). Statistical significance was determined by Kruskal-Wallis tests (P < 0.01), followed by Mann-Whitney U test for pairwise comparisons (B, C).
H&E, hematoxylin and eosin; HPF, high-powered field; RUNX2, runt-related transcription factor 2; OVA, ovalbumin; SEB, staphylococcal enterotoxin B; PBS, phosphate-buffered saline; i.p., intraperitoneal; i.n., intranasal.
Significant differences are denoted relative to group B (OVA/SEB-applied group) (*P < 0.05; †P < 0.01) or to group C (Resveratrol-treated group) (‡P < 0.01).
|
DISCUSSION
Current experimental animal models allow to investigate the role of osteitis in the context of CRS pathogenesis, but none of these models are effective in exploring the in-depth mechanisms of osteitis, suggesting the necessity of a more suitable pathogenic model. In this study, we provide evidence of new bone formation or neo-osteogenesis in a previously established eosinophilic CRSwNP murine model.22 OVA/SEB-administration in mice showed histopathological changes in the sinonasal tissues including the infiltration of immune cells, fibrosis, periosteal thickening, increased osteoblastic activity and woven bone formation (Fig. 1 and Supplementary Fig. S1). We found not only elevated levels of RUNX2 and IL-13, but also positive correlation between RUNX2 positive cells and IL-13 positive cells. Bone thickness positively correlated with the numbers of IL-13 and RUNX2 positive cells (Figs. 2D and 3D). In addition, the expression of IL-13 presented significant positive correlation with osteogenesis-related gene sets in the human CRS transcriptome (Fig. 4 and Supplementary Fig. S2). We finally evaluated the effects of RSV in this murine model and observed a reduction in osteogenesis, evidenced by the expression of IL-13, RUNX2 and histopathological findings following RSV treatment (Fig. 5). Thus, this model can be utilized as a potential murine model for investigating the role of certain proteins or evaluating the effect of drugs in terms of osteogenesis.
The balance of osteoclasts and osteoblasts, responsible for bone homeostasis, is tightly controlled and requires multiple cellular participants. In the process of bone remodeling, bone resorption is initiated by osteoclasts, and then osteoblasts coordinate bone formation by synthesizing multiple bone matrix related proteins.33 RUNX2 (core-binding factor subunit alpha-1) plays an essential role in the proliferation and differentiation of osteoblasts, and regulates the expression of several osteoblastic genes including COL1A1, osteocalcin (BGLAP), SPP1, and MMP9.34 However, various studies have reported that an inflammatory milieu disrupted the balance between osteoblasts and osteoclasts, and led to pathogenic conditions such as abnormal bone loss or bone development.3536 In the context of severe sinonasal mucosal inflammation, the balance between bone formation and bone resorption might be destroyed, resulting in osteogenesis or bone remodeling. Actually, our study showed an increased number of osteoblasts and osteoclasts as well as elevated numbers of RUNX2-positive cells in OVA/SEB-treated mice (Fig. 1B-D and Fig. 2A-C). We also showed that RUNX2 downstream genes, such as MMP9, COL1A1, and SPP1, are up-regulated following OVA/SEB treatment, which suggests osteogenesis (Fig. 3E).
Eosinophils produce Th2 cytokines (IL-4, IL-5, and IL-13) and are implicated in the pathogenesis of allergic inflammatory diseases including eosinophilic CRSwNP or CRSsNP.337 The association between eosinophilia and osteitis severity in CRS has been demonstrated.91638 Among the eosinophil-activating cytokines, the role of IL-13 in neo-osteogenesis has been suggested in several studies, and it has been hypothesized that IL-13 regulates the activity of osteoblasts and osteoclasts.394041 In a recent study, we found that IL-13 contributes to new bone formation and could affect bone remodeling in CRS patients by inducing RUNX2.32 Shi et al. showed that IL-13 promotes the expression of RUNX2 in human bronchial epithelial cells.42 These findings imply that IL-13 plays a role in osteoblast differentiation by enhancing the expression of RUNX2, which is a key transcription factor in the early stage of osteogenic differentiation. As previously reported, eosinophilic murine NP model showed the polyp-like lesions along with increased levels of Th2 cytokines including IL-4, IL-5, and IL-13.22 Therefore, we speculated that OVA/SEB-treated mice may present features of neo-osteogenesis. Here, we observed not only up-regulation of IL-13 and RUNX2, but also the positive association between IL-13 expression and RUNX2 levels, proposing signs of osteogenesis in the eosinophilic murine NP model.
Treatment with OVA alone was insufficient to induce epithelial remodeling in the sinonasal tissue of mice (data not shown). However, administration of 3% OVA with a low dose of SEB (10 ng per nostril) was enough to induce nasal polypoid lesions with epithelial remodeling, showing increased infiltration of immune cells and higher levels of Th2 inflammatory cytokines.22 Bone remodeling or erosion is observed in sinonasal polyposis with high levels of Th2 inflammatory cytokines, implying osteogenesis in our murine NP model.
RSV is highly abundant in peels of red grapes and blueberries, and largely used for protective effects against inflammation.43 Recent reports have suggested the anti-inflammatory effect of resveratrol.4445 We previously observed that resveratrol (previously known as SIRT1 activator) administration in mouse nasal cavity significantly reduced nasal polyp numbers as well as protein expression of inflammatory cytokines and infiltrated immune cells.28 Another study also showed the beneficial effect of resveratrol in decreasing nasal polyps in mice.46 Considering that an inflammatory milieu is favorable to bone formation, we speculate that resveratrol treatment may alleviate osteogenesis. In this study, we investigated the role of resveratrol in the context of osteitis, and found the reduction of bone formation or remodeling of bone in mice, suggesting the applicability of this murine model for investigating the efficiency of drugs targeting CRS patients with osteogenesis.
The murine model was chosen because it has been the most commonly studied animal model for chronic rhinosinusitis.27464748 Furthermore, it has several advantages over the rabbit pathogenic model; including lower housing cost, simple genetic manipulation and availability of various murine reagents. However, there are 2 limitations in this study that could be addressed in future research. First, bone mineralization is a highly ordered process by which the organic bone matrix becomes saturated with calcium phosphate nanocrystals and is considered an important factor to assess bone remodeling.49 Although we detected the up-regulation of osteoblasts and bone thickness in OVA/SEB-treated mice (Fig. 1C and D, Fig. 5B), we could not quantify the degree of bone mineralization in our study due to embedding procedures which involved the removal of calcium deposits. Secondly, OVA from egg is a basic food component, not an airborne allergen. Although our eosinophilic NP murine model can mimic human CRS conditions, future studies using real allergens, such as house dust mite, have to be conducted.
In conclusion, we report histopathological and radiographic evidence of new bone formation or neo-osteogenesis in a murine model of eosinophilic CRSwNP. Resveratrol delivery sufficiently reduced osteogenesis in mice. This animal model could bring new insights into the pathophysiology of neo-osteogenesis and provides a basis for developing new therapeutics targeting osteitis.
 XML Download