

 PDF
PDF ePub
ePub Citation
 Print
Print


INTRODUCTION
Airborne pollen is a potential cause of allergic diseases, collectively known as pollinosis. This includes allergic rhinitis, asthma, allergic conjunctivitis and atopic dermatitis. Pollen allergy is related to a significant number of hospital visits worldwide.123 Allergic diseases are induced or exacerbated during the peak of the pollen season. Pollen concentration forecasting may prevent or reduce the impact of pollinosis.4 Various methods have been suggested for forecasting pollen concentrations.567 Among them, the pollen calendar is the simplest and has been traditionally used in many countries. In Korea, Park et al.8 created a pollen calendar at 7 stations using sampling data from 23 pollen types between 1997 and 2007. Oh et al.9 produced a calendar for 25 pollen types using data from 12 stations during 1997–2009. Kim et al.7 developed a receptor-oriented pollen forecasting method for oak and Japanese hop in Korea.
Overall, 13 common allergenic pollens are considered in the calendar in South Korea.9 Alder pollen is the main cause of spring pollinosis.10 Pine pollen grains originate from the Pinaceae family, which blooms from April to May. Pine is the most popular and gives the largest number of pollen grains in Korea. Although pine pollen is released in large quantities, immunoglobulin E (IgE)-sensitization to it occurs in only 1.5%–3% of allergic patients.1112 The Ginkgo biloba L. pollen grains represent the Ginkgoaceae family, and its blooming period is from April to May.
Grass pollen grains come from the Poaceae family. Dactylis, Poa, Phleum, Cynodon and Zoysia are representative genera belonging to the Poaceae family in Korea, and their blooming period is from March to October. More than 95% of patients allergic to grass pollen possess IgE antibodies in response to group 1 allergens, which are highly cross-reactive glycoproteins exclusively expressed in the pollen of many grasses.13141516 Group 1 allergens from 8 different clinically important grass pollens of the Pooideae (Rye, Canary, Meadow, Cocksfoot and Timothy grasses), Chloridoideae (Bermuda grass) and Panicoideae (Johnson and Maize grasses) subfamilies were isolated.
Ragweed pollen grains originate from Ambrosia, with a blooming period of August to October. Ragweed is clinically the most important source of seasonal aeroallergens, as it is responsible for both the majority of cases and the most severe cases of allergic rhinitis in Autumn.17181920 Mugwort pollen grains come from Artemisia, which blooms from August to October. Mugwort and ragweed pollens have been considered to be important respiratory allergens in Korea.2122 Japanese hop pollen grains originate from Humulus, and its blooming period is from August to October. As the only member of this family, Humulus japonicus is an important trigger for autumn allergy, causing major pollinosis in Korea and Japan recently. In autumn, Japanese hop is a very frequent cause of asthma and allergic rhinitis symptoms in sensitized individuals, affecting between 6.1 and 14% of Korean patients with asthma, rhinitis and conjunctivitis, and it produces a large number of pollen grains among weed pollen types.23 Information about the considered allergenic pollen types, including general name, genus name, type and allergenicity, is summarized in Table 1.
Table 1
Details of the considered allergenic pollens
Seasonal variation of pollen concentrations can be altered due to climate change, land-use change and planting of street trees in the city, especially in the magnitude of pollen concentrations.24252627 The seasonal variation indicates fluctuation in the pollen concentrations between seasons. It is, therefore, essential to update the pollen calendar using recent data. To attenuate the impact of the large variability in pollen concentrations on the calendar, a 10-day average of pollen concentrations was used for smoothing while producing the pollen calendar.28 Although the pollen concentrations were smoothed, this method provided a temporal resolution of 10 days. Since airborne pollen concentrations vary largely by region,29 it is difficult to compare regional allergy risks among locations based on different amounts and/or types of pollen. In view of these factors, it is essential to employ a new methodology to rescale the magnitude of pollen concentrations while comparing the risks of allergy from airborne pollens in different locations.
The present study aimed to create a pollen calendar in Korea using recent data. It also intended to propose a new method for creating the pollen calendar, considering both risk levels and temporal resolution of pollen concentrations. The proposed methodology used probability distributions for smoothing pollen concentrations and determining risk levels.
MATERIALS AND METHODS
Airborne pollen collection and its identification
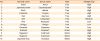
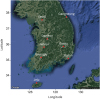
Airborne pollen grains were collected at 8 stations nationwide between 2007 and 2017; 7-day recording Burkard spore traps (Burkard Manufacturing Co Ltd, Hertfordshire, England), installed at a height of 1.5 meters above the ground or on rooftops, were used to collect the airborne pollen grains weekly. The collection stations were located in 1) Seoul, 2) Gangneung, 3) Daejeon, 4) Jeonju, 5) Gwangju, 6) Daegu, 7) Busan and 8) Jeju (Fig. 1). All Burkard samplers were operated by the Korea Meteorological Administration and the Korean Academy of Pediatric Allergy and Respiratory Disease. Every week, the collected pollen from each station was shipped to the identification office. The daily number of pollen grains per m3 were identified and counted after staining with Calberla's fuchsin solution.
In this study, we considered 13 common allergenic pollen types in South Korea while creating the pollen calendar.9 The tree pollens include those from alder, Japanese cedar, birch, hazelnut, oak, elm, pine, ginkgo and chestnut, while the weed pollens include those from ragweed, mugwort and Japanese hop. Pollen types were morphologically identified and classified by their size, pore shape, position, number of apertures and surface pattern. Due to the practical difficulty in morphology-based species identification using optical microscopes, pollen types were identified on the basis of genus or family.
Smoothing method for temporal distribution of pollen counts
Due to high inter-annual and seasonal variability in data, the 10-day averages are widely used for smoothing raw data on daily pollen concentrations during creation of the pollen calendar. Although the 10-day average may represent the expected pollen concentration for 10 days, daily information is eliminated from the pollen calendar. We proposed the probability distribution-based smoothing method to overcome this limitation and employed it for creating the pollen calendar in this study. Since this method used the probability distribution model, the calendar was able to retain data on the total number of annual pollen grains in addition to the daily concentrations.
The proposed smoothing method was performed in the following steps: 1) Data on mean daily pollen concentrations over the given period from 2007 to 2017 were obtained. 2) Parameters of the probability distribution model were estimated for the frequency of mean pollen concentrations or the mean of pollen grains for each Julian day. In this study, normal (N), Gamma (G) and Weibull (W) distributions were used for the probability distribution model, and their parameters were estimated using the maximum likelihood method. 3) The most appropriate probability distribution model based on Bayesian information criterion (BIC) was then identified. The BIC can be obtained by the following equation:
where n is the number of data, d is the number of parameters in the used distribution model, and Loglikelihood is the logarithm of likelihood to the sample for the given distribution model with the parameter estimates. Natural logarithm is used for the logarithm function. The likelihood function is defined by  , where the f(∙) is the probability density function, θ is a parameter set, and xi is a random variable. 4) The expected daily pollen concentrations were calculated from the selected distribution model with parameter estimates. 5) Daily pollen concentrations between 2.5% and 97.5% were presented in the pollen calendar; 5% of the total pollen concentration (first 2.5% and last 2.5%) was removed to avoid the inclusion of the pollen concentrations on all days in the calendar.30 The “fitdistplus” library in the R software package was used as the statistical tool for fitting distribution models. A decrease in the BIC value increased the fit of the distribution model with parameter estimates.
, where the f(∙) is the probability density function, θ is a parameter set, and xi is a random variable. 4) The expected daily pollen concentrations were calculated from the selected distribution model with parameter estimates. 5) Daily pollen concentrations between 2.5% and 97.5% were presented in the pollen calendar; 5% of the total pollen concentration (first 2.5% and last 2.5%) was removed to avoid the inclusion of the pollen concentrations on all days in the calendar.30 The “fitdistplus” library in the R software package was used as the statistical tool for fitting distribution models. A decrease in the BIC value increased the fit of the distribution model with parameter estimates.Benchmark estimation method for pollen counts using probability distribution
Spatial and temporal variability of the pollen concentration data are considerably high; the magnitudes of concentrations also differ largely across pollen types. For instance, grass pollens rise in early April and continue until October, with concentrations ranging from 0 to 2 grains/m3. Conversely, ginkgo pollen appears in early April and continues until mid-May, and its concentration ranges from 0 to 153 grains/m3. Creating a pollen calendar considering this wide variability is particularly challenging. If the average pollen concentrations for both grasses and ginkgo are presented in the pollen calendar, the seasonal variability of grass pollen may not be represented.
In this study, the benchmarks of pollen concentrations were employed to address this issue. Since the benchmarks were obtained for individual pollen types, the seasonal variability of concentrations were co-illustrated in the pollen calendar. To compare the spatial characteristics of pollen concentration data, the benchmarks for each pollen type were shared across stations. The levels for the benchmarks were determined by modifying the method of pollen concentration estimation used by the National Allergy Bureau of the American Academy of Allergy, Asthma & Immunology.31 Four concentration levels were defined as follows: low (0%–50%), moderate (51%–75%), high (76%–87.5%) and very high (87.6%–100%). The benchmarks were obtained from the probability distribution of observed daily pollen concentrations. Exponential, N, G and W distributions were employed as distribution model candidates. The benchmarks were calculated from the distribution model providing the smallest BIC value for the individual daily pollen data set.
RESULTS
Spatial and temporal variability of daily pollen concentrations
To investigate the spatial and inter-annual variability of pollen concentrations, the time series of annual total pollen concentrations for alder, Japanese cedar, birch, hazelnut, oak, grasses, ragweed, mugwort and Japanese hop are presented in Fig. 2. The concentrations varied between stations; alder pollen concentrations were particularly high in the Gwangju and Busan stations. In the Gwangju station, however, the annual total concentrations of alder pollen decreased over time. Japanese cedar pollen concentrations were considerably high at the Jeju station and were almost 10-fold higher than those of other stations. Birch and hazelnut pollens were observed in high concentrations at the Gangneung station. The means of the annual total pollen concentrations for the Gwangju, Busan and Jeju stations, located in the southern region, were higher than those for the stations located in the northern region, namely Seoul, Gangneung, Daejeon, Jeonju and Daegu. The spatial variability of pollen concentrations across South Korea was considerably high. Differences between the highest and lowest pollen concentrations within the same pollen type and station were considerable. This implies that the inter-annual variability in concentrations of the 13 pollen types was also considerably high. Overall, the 13 pollen types demonstrated high concentrations between 2007 and 2017.
Fig. 2
Time series of annual total concentrations of (A) Alder, (B) Japanese cedar, (C) Birch, (D) Hazelnut, (E) Oak, (F) Grasses, (G) Ragweed, (H) Mugwort and (I) Japanese hop pollens in 8 stations during 2007–2017. The concentrations vary between stations. The spatial variability of pollen concentrations across South Korea is considerably high. Differences between the highest and lowest pollen concentrations within the same pollen type and station are considerable. This implies that the inter-annual variability in concentrations of the 13 pollen types is also considerably high.
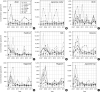
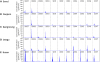
Fig. 3 presents a time series of daily pollen concentrations for alder pollen at the Seoul, Daejeon, Gangneung, Daegu and Busan stations. Total concentrations, peak concentrations, and beginning and duration of the season varied among years and stations. For instance, at the Seoul station, the season lengths were almost 3 and 1 months in 2007 and 2015, respectively. In addition, at Daejeon station, the peak concentration in 2008 was 100-fold higher than that of 2010. In 2014, the peak concentration at Daegu station was almost 10-fold higher than that of Gangneung. The pollen concentration data in South Korea demonstrated wide variability in temporal and spatial characteristics.
Fig. 3
Time series of daily Alder pollen concentrations for (A) Seoul, (B) Daejeon, (C) Gangneung, (D) Daegu and (E) Busan stations between 2007 and 2017. Total concentrations, peak concentrations, and beginning and duration of the season vary with the year and station. The pollen concentration data in South Korea demonstrate wide variability in temporal and spatial characteristics.
Benchmarks for pollen concentrations
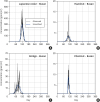
To find the benchmarks of pollen concentrations, appropriate probability distribution models need to be identified for a specific pollen type. Based on BIC measures of the used probability distribution models with parameter estimates for the samples of pollen concentrations, the Weibull distribution has been found to be the most appropriate among the tested models for the probability distribution of daily pollen concentration data among 13 pollen types in South Korea. Visual inspections of individual pollen types and stations were performed to evaluate the appropriateness of the tested distribution models, particularly the Weibull distribution model. Fig. 4 presents the observed and Weibull fitted relative frequencies of alder, Japanese cedar, birch and oak pollen concentrations at the Seoul station. As shown in Fig. 4, the Weibull distribution successfully reproduced the observed relative frequency of presented pollen concentration data. These results indicate that the daily pollen concentration data in South Korea follow the Weibull distribution.
Fig. 4
Plots of observed and Weibull fitted relative frequencies of (A) Alder, (B) Japanese cedar, (C) Birch and (D) Oak pollen concentrations at Seoul station. These results indicate that the daily pollen concentration data in South Korea follow the Weibull distribution. Benchmark values for individual pollen types and stations are calculated from the fitted Weibull distribution.
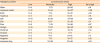
The benchmark values for individual pollen types and stations were calculated from the fitted Weibull distribution. As previously mentioned, the spatial variability of pollen concentrations is considerably high in South Korea. Therefore, consistent benchmarks should be applied for each pollen at all stations to compare magnitudes of pollen concentrations among the employed stations. In the present study, the highest magnitudes among the studied stations in South Korea were considered the benchmark concentrations for each pollen type. The estimated benchmarks for each pollen type are presented in Table 2. As shown in Table 2, the concentrations of different pollen types were highly variable. For instance, the high levels of grasses and ginkgo pollens were 6 and 152 grains/m3, respectively, with the magnitude of ginkgo pollen concentrations being almost 25-fold higher than that of grasses pollen. The pollen concentrations on the pollen calendar can be compared among different stations based on the risk levels as determined by the benchmarks for each pollen type.
Table 2
Benchmarks of pollen concentration levels
Pollen calendar
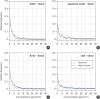
For smoothing the daily averages of pollen concentrations, different distribution models were selected on the basis of the most appropriate distribution for each pollen type and station according to BIC measures. The smoothed and observed concentration averages of Japanese cedar, hazelnut, ginkgo and chestnut pollens are presented in Fig. 5. Blue and black solid lines indicate the smoothed and observed average concentrations of employed pollen types, respectively. In Fig. 5, the observed average pollen concentrations present a spiky shape because of the high inter-annual variability of daily pollen concentration data (Figs. 2 and 3), such as large changes in magnitude, starting time and season length. The smoothed average concentrations successfully represented the patterns of the observed average concentrations (Fig. 5). Visual inspections were performed for all the included pollen types and stations. The smoothed values of average concentrations successfully represented the observed values of average concentrations. These results indicated that the proposed methodology was well suited to represent the characteristics of the average pollen concentrations based on the daily temporal scale.
Fig. 5
Plots of observed and smoothed daily mean values of (A) Japanese cedar, (B) Hazelnut, (C) Ginkgo and (D) Chestnut pollen concentrations at Busan station. For smoothing the daily averages of pollen concentrations, selection of different distribution models was based on the most appropriate distribution for each pollen type and station according to Bayesian information criterion measures. The smoothed average concentrations successfully represent the patterns of the observed average concentrations.
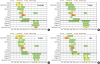
To create the pollen calendar, the benchmark estimates were applied to the smoothed average pollen concentrations based on the daily temporal scale. The pollen calendars produced in the present study are presented in Figs. 6 and 7. As shown in Fig. 6A, the Seoul station recorded a high concentration of pine pollen. The peak concentrations of oak, ginkgo and Japanese hop pollens were also high, while those of Japanese cedar, elm, grasses and ragweed were moderate. Elm pollen peaked in 2 different periods: 1) from the end of May to the middle of June and 2) in September. As shown in Fig. 6B, at the Gangneung station, the levels that were higher than the low level were considered to be the peak concentrations for 5 pollen types. The peak concentration of pine pollen was particularly high, while birch, oak, elm and mugwort pollens had moderate peak concentrations. As shown in Fig. 6C, the peak concentrations of oak and pine pollens were very high at the Daejeon station. The Japanese hop and ginkgo pollens presented high and moderate concentrations, respectively. For Jeonju station (Fig. 6D), the peak concentration of pine pollen shows a very high level. The high levels of oak and elm pollens were also noted. The peak concentrations of alder, Japanese cedar, ginkgo and Japanese hop pollens were moderate.
Fig. 6
Pollen calendars for (A) Seoul, (B) Gangneung, (C) Daejeon and (D) Jeonju stations. To create the pollen calendar, benchmark estimates are applied to the smoothed average pollen concentrations based on the daily temporal scale. At the Seoul station, the peak concentrations of pine, oak, ginkgo and Japanese hop pollens are high (A). At the Gangneung station, the peak concentration of pine pollen is particularly high, while those of birch, oak, elm and mugwort pollens are moderate (B). The peak concentrations of oak and pine pollens are very high at the Daejeon station (C). At the Jeonju station, the peak concentration of pine pollen is very high and those of oak and elm pollens are high (D).
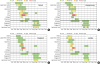
Fig. 7
Pollen calendars for (A) Gwangju, (B) Daegu, (C) Busan and (D) Jeju stations. Peak concentrations of pine and Japanese hop are very high at the Gwangju station (A). At the Daegu station, the peak concentrations of oak and Japanese hop are high (B). At the Busan station, very high and high levels are considered as the peak concentrations for pine and alder pollens, respectively (C). At the Jeju station, the peak concentrations of Japanese cedar and pine pollens are very high (D).
As shown in Fig. 7A, peak concentrations of pine and Japanese hop were very high at the Gwangju station. Peak concentrations for alder and oak pollens were high, while Japanese cedar, birch and grasses had moderate levels. At the Daegu station (Fig. 7B), the peak concentrations of oak and Japanese hop were high, and that of alder was moderate. As presented in Fig. 7C, the peak concentrations of 6 pollen types (alder, Japanese cedar, birch, oak, pine and Japanese hop) at the Busan station were higher than the low levels. Very high and high levels were considered as the peak concentrations for pine and alder pollens, respectively. At the Jeju station (Fig. 7D), the peak concentrations of Japanese cedar and pine pollens were very high. The moderate levels of 5 pollen types, namely oak, grasses, ragweed, mugwort and Japanese hop, were considered to be peak concentrations. Of the 5 pollen types, 1 was tree (oak) and 4 were grasses and weeds.
Although the season start and duration of a particular pollen species varied across stations, no consistent pattern was observed. Elm pollen was recorded in all stations in April and September, with very low concentrations in September. At the Gangneung station, the concentration was not shown in the pollen calendar in September, as the average values of elm pollen concentrations during that period were approximately zero.
Based on the benchmark estimates, pine was the most common pollen in South Korea between 2007 and 2017, as the level of its peak concentration was very high in all of the included stations. Oak and Japanese hop were also very common during this period, as observed from their peak concentration levels, which were higher than the low values in all stations. Levels of Japanese cedar and alder pollens were higher than low levels in 5 and 4 stations, respectively. These 2 pollen types are common in South Korea. The peak concentrations in 3 stations were higher than the low levels for birch, elm, grasses and ginkgo pollens. Ragweed and mugwort pollen grains showed higher than low levels at 2 and 1 stations, respectively. The peak concentrations of birch, elm, ginkgo, grasses, ragweed and mugwort largely depended on the geographical location. This indicated the presence of high pollen release areas. The peak concentrations of hazelnut and chestnut pollens were low in all stations.
DISCUSSION
The pollen calendar produced in the present study was compared to the previous one that based on pollen concentration data between 1997 and 2009.9 A total of 23 pollen types at 12 stations, including that of trees, grasses and weeds, had been considered in the previous version of the pollen calendar. Considerable differences were noted between the present and previous versions. First, while the peak dates of the pollen concentrations were similar in both calendars, the magnitudes of peak concentrations and periods of pollen appearance were different. Secondly, the previous calendar included all possible fragmented observations due to the absence of modifications for very low concentrations. Therefore, the previous version may have overestimated the pollen seasons. Thirdly, low elm pollen concentrations recorded in September, which have been shown in the present calendar, were not represented in the previous version. Ulmus parvifolia is the only species in the Ulmaceae family that produces pollen in autumn in South Korea. In the past, the pollen concentrations of U. parvifolia were considered insignificant due to a very small magnitude of or no concentration. Recently, its concentrations have increased over time in some stations probably because of the climate change in South Korea. As the altered environment may be preferable for U. parvifolia, its pollen concentration has increased. Fourthly, although ginkgo pollen was included in the previous pollen calendar, its concentration was not available in the present version.
At the Seoul station, the magnitudes of peak concentrations for alder, birch, hazelnut, grasses, ragweed, mugwort and Japanese hop pollens appeared smaller in the present calendar than in the previous version. The past and present peak concentrations of oak, elm, pine and chestnut pollens did not differ largely. Magnitudes of the peak concentrations for ragweed, mugwort and Japanese hop pollens became lower in the present calendar at the Gangneung, Daejeon, Gwangju and Daegu stations. The peak concentrations of alder, hazelnut and grass pollens decreased at 3 of these 4 stations. The past and present pollen calendars for Jeju station were not largely different.
The peak concentrations of many pollen types decreased in many stations. The peak concentrations of grass and weed pollens decreased in all stations except Jeju. The magnitude of differences may have resulted from the use of different smoothing methods. In the present study, the probability distribution model was used for smoothing the average daily pollen concentrations, while the past pollen calendar used 10-day averaging. In the past pollen calendar, the pollen concentration graphs had a spiky shape. This indicated the persistence of very high pollen concentrations at certain data points despite smoothing. Although the past pollen calendar retained some raw pollen data, the seasonal characteristics of pollen concentrations in Korea were not well-represented.
To identify possible reasons for the large concentration in 2008, meteorological conditions from 2007 to 2008 were investigated and found to be similar with the normal patterns. Thus, the large pollen concentration in 2008 may have been affected by other influential factors such as alternate bearing cycles and plant diseases. An example of this condition is provided by the oak tree, which has alternate bearing cycles, resulting in decreased pollen counts and fruits compared to those in previous years. Therefore, pollen counts decreased in some years. Additionally, the relationship between the pollen concentrations and influential factors is still a challenging topic in phenology and botany. These relationships should be investigated in further studies for forecasting the pollen concentrations.
Pine, oak and Japanese hop pollens were common in Korea based on the magnitude of pollen concentrations, and the most common was pine pollen. Although pine is the most common, it has low allergenicity. A previous study reported that pine pollen may be weakly associated with allergy symptoms despite being the most common in Seoul.32 Oak and Japanese hop pollens were the second and third most common, respectively, and they have high allergenicity. These results suggested that, in Korea, the pollen of oak is the most pertinent for allergy symptoms, followed by that of Japanese hop. As reported in previous studies, the concentrations of oak and Japanese hop pollens showed a statistically significant positive correlation to positive skin test results.3233 In particular, the concentrations of oak and Japanese hop pollens were associated with allergy symptoms in spring and autumn, respectively.32 Therefore, these pollens were considered the principal airborne pollen allergens. Since these inferences were based on the magnitude of pollen concentrations and allergenicity, they should be verified by surveying allergy symptoms from pollen allergens in individuals.
In conclusion, the pollen concentrations in Korea were high in spring (from March to June) and autumn (from August to October) due to the seasonality of blooming and pollen production. In this study, except for pine pollen in spring and autumn, the salient pollens were selected at each station. The findings show that in Seoul, Gangneung, Daejeon and Daegu, oak pollen may be the most pertinent for allergenic symptoms in spring. In Jeonju, the predominant pollens in spring are those of oak and elm. In Gwangju and Busan, alder and oak were the major pollens in spring, while in Jeju, Japanese cedar was the major contributor to spring pollinosis. In autumn, Japanese hop was the highly allergenic pollen in all stations. Since weed pollens including those of ragweed, mugwort and Japanese hop were common in Jeju, all weed pollen types may produce seasonal allergy symptoms in autumn.
Because the current pollen calendar was developed on the basis of the probability of observed pollen concentrations, it does not account for allergenicity of the specific pollen types analyzed in its development. From the current pollen calendar, approximate allergenic risks for each pollen type can be obtained on the basis of the individual's experience. To obtain the exact allergenic risk, evaluation of the relationship between a specific pollen type and its sensitization in an individual is required. An allergenic risk calendar should be developed by incorporating information about this relationship, so that the pollen calendar can provide information about the exact risk of allergenic pollens for individuals. In further studies, the relationship between the pollen type and individual sensitization should be investigated, in addition to the development of the allergenic risk calendar. Moreover, even if the grass pollen count is too small on some days, allergic symptoms may be stimulated due to those pollen effects in South Korea. As the count is very few on other common days during a year, even a small pollen count (i.e., > 6) may have a significant effect in allergic patients.
 XML Download