

 PDF
PDF ePub
ePub Citation
 Print
Print


INTRODUCTION
Takotsubo (stress) cardiomyopathy (TTC) is characterized by transient systolic and diastolic left ventricular (LV) dysfunction with a variety of wall-motion abnormalities.1)2) It occurs most commonly in post-menopausal women with a recent history of emotional or physical stress.3) Reversibility of cardiac dysfunction is one of the most important characteristics of this disease, although recent studies have shown subtle long-term clinical and echocardiographic consequences even after 6 to 12 months.4)5)6) Complete recovery of left ventricular ejection fraction (LVEF) and regional wall motion abnormalities within 1 month have been reported.6)7)8) Two-dimensional speckle tracking echocardiography (2D STE) is a valuable tool in evaluation of global and regional LV function and appears to be more sensitive than traditional echocardiography for detection of subtle myocardial abnormalities.5)9) Electrocardiography (ECG) is the simplest and most widely available diagnostic test, and dynamic changes in ECG abnormalities in TTC have been reported.10)11) In a few case reports, dynamic changes in cardiac function during the short-term period have been demonstrated in TTC using 2D STE and ECG.12)13) A clear understanding of dynamic changes in the acute and subacute phases of TTC could enhance early and accurate diagnosis and management of TTC. However, there is a lack of detailed knowledge about the time course of functional recovery in the acute and subacute phases of TTC. In particular, there is a lack of data on echocardiography changes and ECG abnormalities during these phases of TTC.
Therefore, the aim of the present study was to investigate the time course of LV functional recovery during the acute and subacute phases of TTC using 2D visual and volumetric assessment, 2D STE, and ECG.
METHODS
Patients
Patients who were diagnosed with TTC during hospitalization between June 2015 and December 2018 were enrolled in the study and monitored prospectively. TTC was diagnosed using the following criteria: 1) transient regional wall motion abnormalities extending beyond a single epicardial vascular distribution, 2) new electrocardiographic abnormalities (ST-segment elevation and/or T-wave inversion) or modest elevation in cardiac troponin, and 3) absence of obstructive coronary disease and angiographic evidence of acute plaque rupture.14) We included only patients who had symptom onset within the prior 24 hours. We excluded patients with TTC who had cardiogenic shock, required mechanical ventilation, or those who had other serious comorbidities such as malignancy or septic shock requiring prolonged hospitalization or intensive care unit treatment.
Study protocol
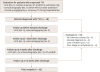
A flow diagram of the study protocol is provided in Figure 1. ECG (No. 1), cardiac enzymes, and N-terminal prohormone brain natriuretic peptide (NT-proBNP) were checked on the day of admission, and initial echocardiography (No. 1) was performed within 48 hours after admission in all patients. Daily cardiac enzymes were checked until they reached the normal range or were greatly improved. Follow-up echocardiography and ECG (No. 2) were performed before hospital discharge. Outpatient clinic visits were scheduled at 1 week and 5 weeks after discharge and the third (No. 3) and the fourth (No. 4) echocardiography studies and ECGs were performed at these timepoints. Thirteen weeks after discharge, patients were finally followed-up in the outpatient clinic or were interviewed by telephone. At the final follow-up, the following information was collected: death from any cause, hospitalization due to a cardiac cause, and recurrence of TTC. We considered the period of hospitalization as the acute phase of TTC and the period of 5 weeks after discharge as the subacute phase of TTC. After initiation of the study, patients who had a revised diagnosis, those lost to follow-up, and/or those with poor echocardiographic images or an arrhythmia were excluded from the final analysis. All patients provided written informed consent. This study protocol was approved by the Ethics Committee of the Institutional Review Board of our hospital.
Echocardiography and ECG
Conventional transthoracic echocardiography was performed with standard views according to the established guidelines of the American Society of Echocardiography using a Vivid E9 or E95 apparatus (GE Vingmed; Horten, Norway). All echocardiographic images were stored digitally and offline analysis of LVEF and longitudinal peak systolic strain was performed using the biplane Simpson's method and the automated function imaging (AFI) technique with the EchoPac strain imaging software package (GE Healthcare) as described previously.15) Segmental wall motion score was visually assessed in 17 LV myocardial segments and wall motion score index (WMSI) was calculated by dividing the sum of segmental wall motion scores by 17. Apical 4-chamber, 2-chamber, and 3-chamber views were carefully acquired to quantify LV strain without a dual-focusing tool at a frame rate of 60–80 fps during the end-expiratory period for optimal image acquisition. Sector width and image depth were optimized to maintain an adequate frame rate without losing 2D image quality. The software automatically detected the endocardium and created U-shaped regions of interest that encompassed the basal, mid, and apical segments of two opposite LV walls. Tracking quality was automatically assessed and we double-checked the quality visually. If necessary, we manually readjusted the endocardial tracing. The AFI software divided the LV into 17 segments and provided the peak systolic global longitudinal strain (GLS) and segmental longitudinal strain (SLS) in bull's eye format. Basal, mid-ventricular, and apical regional longitudinal strain (RLS) were defined as the average of six basal SLS, 6 mid-ventricular SLS, and 5 apical SLS measurements, respectively. Strain analysis was done offline by one dedicated echocardiographer who was unaware of all other clinical data. To provide reference values for the strain analysis, we performed strain analysis in examinees aged 30 to 85 years who underwent echocardiography for health screening in the health promotion center of our hospital using the same vendor. These examinations were performed by the same echocardiographer who performed study measurements.
Twelve-lead ECGs using a speed of 25 mm/s and an amplification of 10 mm/mV were recorded on admission following the study protocol. ST-segment deviation from the baseline PR segment was measured 80 ms after the J point and was considered present if the deviation was > 0.5 mm in limb leads and > 1.0 mm in precordial leads.16) QTc interval was calculated using Bazett's formula and considered as prolonged if > 450 ms. T wave inversion (TWI) were evaluated in leads V3-6 in each ECG because previous studies demonstrated that changes were most obvious in those leads.10)17) To quantify TWI, we calculated TWI score. TWI score was defined as the average of the T wave amplitude in leads V3, 4, 5, and 6. Presence of TWI in each ECG was defined as a negative TWI score. All ECGs were examined by a single cardiologist who was blinded to all other clinical data. Figure 2 shows representative bull's eye mapping images of serial longitudinal peak systolic strain and the ECG of a patient with the apical type of TTC.
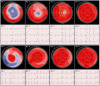 | Figure 2Representative bull's eye mapping images of serial longitudinal peak systolic strain and electrocardiography (ECG) in patients with apical type (upper panel) or non-apical type (lower panel) Takotsubo cardiomyopathy. The No. 1 ECG was recorded on admission and the No. 1 bull's-eye map were recorded on day 2 in the upper panel, while the No. 1 ECG and bull's-eye map were recorded on the same day in the lower panel. All No. 2 - 4 bull' eye maps and ECGs were recorded on the same day. Only precordial lead results are shown in the ECG images.
|
Statistical analysis
Categorical variables are expressed as numbers and percentages. Continuous variables are expressed as means ± standard deviations (SDs) or medians (ranges). Initial and follow-up NT-proBNP levels were compared using a paired t-test. Repeated measurements of LVEF, GLS, WMSI, and TWI score on echocardiography and ECG were compared using repeated measures analysis of variance (RMANOVA) with Bonferroni correction. Statistical analyses were performed using SPSS 21.0 software (IBM, Inc., Chicago, IL, USA) and a p value < 0.05 was considered statistically significant.
RESULTS
Patients
Forty-eight patients who were diagnosed with TTC were initially enrolled. Sixteen of these patients were excluded due to lack of informed consent, revised diagnosis during follow-up, loss of follow up, or ineligibility for imaging analysis (Figure 1). Thirty-two patients (median age 66, range 29–87, 26 women) who completed the follow-up schedule were finally analyzed. The first ECG was performed on day 1 in all patients and the first echocardiography was performed on median day 2 (range 1–3). No. 2, No. 3, and No. 4 ECGs and echocardiography studies were performed on median day 6.5 (range 3–11), median day 15 (range 13–25), and median day 43 (range 28–61), respectively. Baseline characteristics of the patients are shown in Table 1. Factors precipitating stress were identified in 75% of subjects (physical stress in 53%, emotional stress in 22%), with no specific stress-inducing factor identified in the remaining 25% of subjects. Physical stresses included infectious diseases (n = 10; enteritis, pneumonia, influenza, urinary tract infection, acute gingivitis, oral mucositis, severe fever with thrombocytopenia syndrome), pulmonary disease (n = 2; chronic obstructive pulmonary disease, asthma), physical labor (n = 2), a procedure-related event (n = 2; esophagogastroduodenoscopy, colonoscopy), and anaphylaxis (n = 1). Dyspnea (66%) was the most common symptom followed by chest pain or discomfort (59%), and some patients experienced both these symptoms. Initial NT-proBNP level was significantly elevated in most patients (7,595 ± 9,432 pg/mL), whereas peak troponin I level during hospitalization was modestly elevated (2.44 ± 3.68 ng/mL). NT-proBNP level was greatly reduced at 5 weeks after discharge (534 ± 1,071 pg/mL, p = 0.002). Patients were hospitalized for 3–17 days (median 6 days). During follow-up (median 98 days, range 78–126 days), there were no deaths but two re-hospitalizations due to cardiac causes (one for recurrent TTC and the other for pericardial effusion). One patient was diagnosed with recurrent TTC during follow up.
Table 1
Baseline characteristics of the study participants.
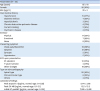
BMI: body mass index, ECG: electrocardiography, NT-proBNP: N-terminal prohormone brain natriuretic peptide.
Values are presented as number of patients (%).
![]()
Echocardiography and ECG findings
On baseline echocardiography, patients showed reduced systolic function and regional wall motion abnormalities with a reduced LVEF (39 ± 8.8%), GLS (-11 ± 4.3%), and abnormal WMSI (1.8 ± 0.3). The most common type of TTC was the apical type (n = 20, 63%), followed by the mid-ventricular type (n = 8, 25%) on initial echocardiography. Three patients showed the focal type and one patient showed the basal (reverse) type. On initial ECG, ST-elevation was observed in 10 patients (31%) and TWI was observed in four patients (13%). Half of the patients showed nonspecific ECG changes including ST depression and sinus tachycardia. Most patients (n = 25, 78%) initially showed a prolonged QTc interval (469 ± 26 ms). Figure 3 demonstrates serial follow-up results for LVEF, GLS, and TWI score. During the acute phase of TTC (between No. 1 and No. 2), a large improvement in LVEF and GSL was observed (39 ± 8.8% to 49 ± 9.3%, p < 0.001 and -11 ± 4.3% to -15 ± 4.2%, p < 0.001, respectively), and the T wave progressed to inversion (TWI score: 1.8 ± 3.0 to -2.5 ± 3.0, p < 0.001). During the subacute phase of TTC (from No. 2 to No. 4), continuous improvement of LVEF and GLS was observed (No. 3: 56 ± 7.5%, p < 0.001; No. 4: 58 ± 6.8%, p = 0.027 and No. 3: -17 ± 3.9%, p < 0.001; No. 4: -19 ± 3.4%, p = 0.001, respectively). TWI had improved after the No. 3 follow-up (No. 3: -2.9 ± 5.2, p > 0.999; No. 4: -0.3 ± 4.4, p = 0.035). Negative TWI score on No. 1, No. 2, No. 3, and No. 4 ECGs was observed in 4 (13%), 24 (75%), 22 (69%), and 18 (56%) patients, respectively. Table 2 shows basal, mid-ventricular, and apical strain on echocardiography in 20 patients with apical type TTC and eight patients with mid-ventricular type TTC. In the apical type TTC, longitudinal strain decreased from base to apex on the baseline (No. 1) and first follow up (No. 2) echocardiography studies, but no such gradient was observed in the No. 3 and No. 4 echocardiography studies. For the mid-ventricular type of TTC, a gradient of longitudinal strain from base to apex was not observed on the No. 1 to No. 3 echocardiography studies, but this gradient was observed on the No. 4 echocardiography study. Reference values for strain analysis in the normal control group (n = 40, median age 56 years, range 33-84 years, 26 women) were as follows: GLS of 23 ± 1.8% and basal, mid-ventricular, and apical strains of 20 ± 1.6%, 22 ± 1.6%, and 26 ± 3.6% (p < 0.001 for apex vs. mid-LV, p < 0.001 for apex vs. base), respectively.
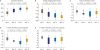 | Figure 3Serial ejection fraction (A), global longitudinal peak systolic strain (B), and T wave inversion score (C) in all study patients (n = 32). T wave inversion score in apical (D) (n = 20) and non-apical type (E) (n = 12).
|
Table 2
Serial longitudinal strain of the basal, mid, and apical left ventricle in the apical type and mid-ventricular type of Takotsubo cardiomyopathy.
*p-value: base vs. mid-LV, †p-value: base vs. apex, ‡p-value: apex vs. mid-LV, §p-value: apex vs. base.
![]()
DISCUSSION
This study demonstrated four serial changes on echocardiography and ECG for the approximately 6-week period after initial presentation of TTC in prospectively enrolled patients with TTC. We observed rapid recovery of systolic function within 2 weeks and continued recovery during the next 4 weeks. As shown in Figure 3, LVEF was much improved by a median value of 6.5 days (49 ± 9.3%) and reached the normal range within 6 weeks (58 ± 6.8%). Mansencal et al.8) reported similar findings in their study; LVEF showed significant improvement by day 7 (45 ± 7%) and after 1 month (56 ± 5%). Other studies reported normalized LVEF at 4 weeks and within 3 months.6)18) One small study, in which echocardiography was performed every 12 hours in 8 patients with emotional stress-induced TTC, reported complete recovery of LVEF within 12 ± 3 days.19) The differences in the time taken for recovery of LVEF appear to be related to the point at which echocardiography was performed, as well as the demographics of the patient samples. In the present study, we demonstrated that LVEF increased sharply and was almost normal by 2 weeks (56 ± 7.5%) followed by a further improvement within 6 weeks (58 ± 6.8%). The same pattern was also observed for recovery of GLS using 2D STE (-17 ± 3.9% by 2 weeks and -19 ± 3.4% by 6 weeks). LVEF and GLS at 6 weeks appear to have recovered completely in this study when compared with the normal ranges of LVEF and GLS in the Korean population.20)21) Because normal strain values vary depending on vendor and investigator,22) we determined reference values for GLS and RLS in the control group using the same vendor, method, and examiner. One study reported no difference in LVEF and GLS between 4 weeks and 6 months in patients with TTC, while the other reported no difference in LVEF and GLS at 7 months in patients with TTC compared to those in the control group.5)6)
By contrast, repolarization abnormalities as reflected by TWI on ECG were persistently observed for 6 weeks in the current study. In the period spanning 2 weeks after presentation of TTC, the T wave deepened progressively while LV systolic function tended to revert to near normal. After 2 weeks, TWI started to recover, but the T wave had not completely normalized by 6 weeks (there was some residual TWI in more than half of the patients). Kurisu et al.23) reported a biphasic change in the T wave with the first negative peak observed at approximately 3 days and the second negative peak at approximately 2–3 weeks. We may have missed the first negative peak of the T wave due to the difference in timing of the ECG (we did not usually perform ECG on day 3), and therefore may only have observed the second negative peak. TWI in TTC has been reported to be associated with myocardial edema in a study that used cardiac magnetic resonance (CMR).24) That study showed that the apicobasal gradient of LV myocardial edema was related to TWI. Therefore, the change on ECG of non-apical type TTC might be different to that of apical-type TTC. However, ECG changes in other morphologic types of TTC have not been fully investigated. We demonstrated ECG changes in the non-apical type of TTC compared with those observed in apical type TTC in this study (Figure 3). We demonstrated serial changes in the RLS in apical type and mid-ventricular type TTC (Table 2). Previous studies demonstrated a normal base-to-apex gradient of longitudinal strain regardless of vendor.22)25) This gradient was also observed in our control group. In those subjects with apical type TTC, a reverse gradient of RLS from the basal level to the apical level was prominent on the initial test. Despite the general perception of basal hypercontractility in apical type TTC, basal RLS was also diminished at baseline in this study, consistent with the findings of a previous study.26) In addition, a previous study reported that hyperkinetic wall motion of basal segments was caused only by an increase in radial strain, not an increase in longitudinal or circumferential strain.6) The reverse base-to-apex gradient of RLS was reduced on the follow-up test and had disappeared by approximately 2 weeks. From 2 weeks to 6 weeks, all basal, mid, and apical RLSs improved to a similar extent. Interestingly, in the mid-ventricular type of TTC, the normal base-to-apex gradient of longitudinal strain was not observed in the initial and follow-up echocardiography studies, but it was present in the last follow-up echocardiography study. During the relatively short-term follow-up period of this study, there was one recurrence of TTC. Other long-term follow-up studies of TTC have shown that recurrence of TTC plays a major role in the etiology of cardiovascular adverse events.27)28)
Limitations
First, we planned the first follow-up tests before discharge without defining the number of days after initial presentation, and outpatient visits were scheduled 1, 5, and 13 weeks from discharge, not from initial presentation. This resulted in some uncertainty about follow-up times and broad ranges of follow-up days at each scheduled visit. The reason that we chose this schedule is that follow-up days based on the day of initial presentation are difficult to comply with in busy clinical situations and with different durations of admission among individual patients. Only two evaluations during hospitalization were performed; it was therefore not possible to assess detailed changes associated with rapid recovery in the acute phase of TTC. Second, we excluded critically ill patients. Therefore, the time course of functional recovery of TTC and the short-term outcomes may appear more favorable than would be observed in real clinical practice. Lastly, the present study was mainly qualitative and has the inherent limitations of any small observational study. In addition, because of the small number of patients, we could not analyze the data according to different morphologic types or different causes of stress, even though these are possible confounding factors.
Conclusions
Contractile function in TTC assessed by conventional 2D image and 2D STE recovered continuously throughout the acute and subacute phases, with rapid recovery during the acute phase and slower recovery during the subacute phase. The negative T wave, however, progressed during the acute phase and recovered more slowly during the subacute phase. At the end of the subacute phase, the T wave had still not normalized in half the patients, but systolic function had improved to within the normal range.
 XML Download