

 PDF
PDF ePub
ePub Citation
 Print
Print


INTRODUCTION
Pulmonary hypertension (PH) is defined as mean pulmonary arterial pressure (mPAP) ≥ 25 mmHg at rest measured by right heart catheterization (RHC).1) PH has numerous different causes with distinct clinical phenotypes. The World Health Organization has thus classified PH into five different categories according to underlying pathophysiology: PH due to pulmonary arterial hypertension (PAH) (Group 1), left heart disease (Group 2), lung disease (Group 3), pulmonary artery obstruction (Group 4), and unclear and/or multifactorial mechanisms (Group 5), as shown in Table 1.2)
Table 1
The World Health Organization classification of pulmonary hypertension2)

![]()
The importance of impaired right ventricular (RV) hemodynamics in relation to clinical outcomes is increasingly being recognized in treatment of patients with PH. The role of echocardiography in hemodynamic screening and monitoring in PH patients is thus emerging.3)4) In PAH, the impacts of early screening and upfront combination therapy on long-term survival have recently been reported.5) Initial combination target therapy in specific PAH populations has shown prolonged survival and delay of disease progression. The prognostic implication of reduction of mPAP on long-term survival in Groups 2, 3, and 4 PH has also been emphasized.6)7)8) Although parameters such as mPAP or PVR are most accurately measured by RHC, the procedure is invasive, cumbersome to patients, expensive, and may be associated with complications. Accordingly, the role of echocardiography in screening PH patients is emerging.5)
Therefore, it is of great importance for physicians to understand echocardiography in screening and evaluating PH patients. In this article, we review echocardiographic measurements that are used in PH patient evaluation.
ECHOCARDIOGRAPHIC ESTIMATION OF MEAN PULMONARY ARTERIAL PRESSURE
The echocardiographic methods for mPAP approximation are reviewed in this section. The material dealt with here is summarized in Table 2 and Figure 1.
Table 2
Echocardiographic methods of estimating mean pulmonary artery pressure
A4C: apical 4-chamber view, CW: continuous-wave, HR: heart rate, mPAP: mean pulmonary artery pressure, PADP: pulmonary artery diastolic pressure, PASP: pulmonary artery systolic pressure, PH: pulmonary hypertension, PR: pulmonary regurgitation, PSAX: parasternal short axis view, PW: pulse-wave, RAP: right atrial pressure, RHC: right heart catheterization, RV: right ventricle, RVOT: right ventricular outflow tract, RVOTAT: right ventricular outflow tract acceleration time, RVsP: right ventricular systolic pressure, TR: tricuspid regurgitation, TVI: time velocity interval.
![]()
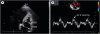
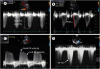 | Figure 1Echocardiographic images of methods for estimating mPAP. Estimation of mPAP using peak TR velocity (A); RVOTAT (B); peak and end PR velocity (C); and TR velocity TVI (D). mPAP: mean pulmonary artery pressure, PR: pulmonary regurgitation, RVOTAT: right ventricular outflow tract acceleration time, TR: tricuspid regurgitation, TVI: time velocity integral.
|
Peak tricuspid regurgitation velocity
The mPAP can be calculated by measuring peak tricuspid regurgitation (TR) velocity. TR peak velocity can be analyzed in the inflow view of the parasternal long axis (PLAX), the parasternal short axis (PSAX) view, and the apical 4-chamber (A4C) view using continuous wave (CW) Doppler (Table 2 and Figure 1A).
The peak TR velocity reflects the pressure gradient (PG) between the RV and right atrium (RA). Using a modified Bernoulli equation, the PG between RA and RV can be estimated from the peak velocity of TR between the two chambers: peak PG = 4 × (peak TR velocity)2.6)7) Thus, RV systolic pressure (RVsP) is defined as the sum of RAP and peak PG.
The RVsP or pulmonary arterial systolic pressure (PASP) can be estimated by the following formula: RVsP = PASP = 4(peak TR velocity)2 + RAP when there is no pulmonary stenosis. RAP in this formula is determined by the diameter of the inferior vena cava (IVC) and the percentage of collapse during inspiration. When IVC diameter ≤ 2.1 cm and collapses > 50% with inspiration, the RAP is assumed to be 3 mmHg (range, 0-5 mmHg). RAP is estimated to be 15 mmHg (range, 10-20 mmHg) when the IVC diameter > 2.1 cm with ≤ 50% collapse by inspiration, or 8 mmHg (range, 5-10 mmHg) for all other conditions.8) The calculated RVsP can then be interpreted by itself or further converted to mPAP using the following formula: mPAP = 0.61 × RVsP + 2 mmHg.9) RVsP > 37 mmHg and mPAP > 25 mm Hg are suggestive of PH.10) A summary is shown in Table 2.
There are several tips for obtaining optimal results for peak TR velocity. First, all available views, such as RV inflow, PLAX, PSAX, and A4C views, should be evaluated to find the plane parallel to the TR jet to avoid underestimation of peak TR velocity. Identifying TR flow through color flow Doppler is advised.11) Secondly, it is helpful to understand that some patients have no or trivial TR even in the presence of PH. Agitated saline injection from the peripheral vein can augment the Doppler signal, although TR is often overestimated.
Peak and end diastolic pulmonary regurgitation velocity
Although the pulmonary regurgitation (PR) velocity method is not routinely used in clinical practice, it is useful when the TR signal is inadequate. PR is evaluated in the PSAX view using CW Doppler. The Doppler beam should be aligned to the PR jet to avoid underestimation. The beginning and end of the PR signal are measured; the beginning of the PR signal is the peak PR velocity, whereas the end of the PR signal is the end diastolic PR velocity (Table 2 and Figure 1C).
The peak PG between the RV outflow tract and the main pulmonary artery (MPA) is added to the RAP to estimate mPAP when using the peak PR velocity. The mPAP is approximated by the following formula: mPAP = 4(peak PR velocity)2 + RAP.12)13) When end diastolic PR is measured, mPAP is estimated by the following formula involving pulmonary artery diastolic pressure (PADP): mPAP = 2/3 × PADP + 1/3 × PASP. PADP is defined as the sum of end diastolic PG and RAP: PADP = 4(end diastolic PR velocity)2 + RAP.13) The formulas are summarized in Table 2. Peak PR velocity > 2.2 m/s is regarded as elevated mPAP.10)
Right ventricular outflow tract acceleration time
The RV outflow tract acceleration time (RVOTAT) is measured in the PSAX view using pulse-wave (PW) Doppler. It is measured at the end of expiration by placing the sample volume just proximal to the pulmonary valve. The RVOTAT is measured from the beginning of the flow to the peak of the flow (Table 2 and Figure 1B).
The mPAP using RVOTAT is estimated using formulas suggested by Dabestani et al.17) In a patient with a heart rate between 60 and 100 beats per minute and RVOTAT < 120 msec, mPAP is estimated by the following formula: mPAP = 79 – (0.45 × RVOTAT).14) In cases of severe PH, the RVOTAT shortens, such that the following formula gives more accurate estimations of mPAP: mPAP = 90 – (0.62 × RVOTAT).14) RVOTAT > 130 ms is considered normal, while < 100 ms is regarded as elevated mPAP.
It is important to know that the time of acceleration, but not the slope, is measured in RVOTAT. Thus, locating the beginning and peak is of critical importance, rather than identifying the slope between the beginning and peak of the signal.
Tricuspid regurgitation time velocity integral
An alternative method using TR for mPAP estimation was suggested by Aduen et al.,15) for 1) the paucity of patients with PR or 2) the low reproducibility and correlation between pulmonary systolic time intervals and RHC-measured mPAP. The echocardiographic process of measuring mPAP using the current method is identical with that of the peak TR velocity method for estimating RVsP, except for the time velocity integral (TVI) of the CW TR envelope (Table 2 and Figure 1D).
The mPAP is the RAP added to the PG between the RV and RA: mPAP = PG + RAP.15) The PG is measured by the TVI of the CW TR flow. Agitated saline injection may be helpful in patients with an incomplete TR envelope.
ECHOCARDIOGRAPHIC FEATURES SUGGESTIVE OF IMPAIRED RV FUNCTION
In the following section, aspects other than the mPAP for estimating RV dysfunction are introduced. Echocardiographic methods that analyze RV dysfunction in terms of pulmonary artery size, RV size, RV longitudinal motion, and global RV performance are reviewed (Table 3, Figure 2, and Figure 3).
Table 3
Echocardiographic methods of estimating impaired right ventricular function
A4C: apical 4-chamber view, RV FAC: right ventricular fractional area change, IVS: interventricular septum, LV: left ventricular, PH: pulmonary hypertension, PSAX: parasternal short axis view, PW: pulse-wave, RV: right ventricular, RVAd: right ventricular area at diastole, RVAs: right ventricular area at systole, TAPSE: tricuspid annular plane excursion, TDI: tissue Doppler imaging.
![]()
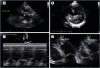 | Figure 2Echocardiographic methods for evaluating RV function. Assessment of MPA diameter (A); left ventricular eccentricity index (B); TAPSE (C); and RV fractional area change by measuring RVAd and RVAs for assessment of RV function (D). D1: axis parallel to interventricular septum, D2: axis perpendicular to interventricular septum, MPA: main pulmonary artery, RV: right ventricle, RVAd: RV area at diastole, RVAs: RV area at systole, TAPSE: tricuspid annular plane excursion.
|
 | Figure 3Additional echocardiographic methods for evaluating RV function. RV function can be estimated by evaluating the RV dimensions (A); and RV pulsed tissue Doppler S wave (S') velocity (B). RV: right ventricular, RVD1: basal diameter of RV measured at the basal one-third of the RV, RVD2: RV diameter measured at the left ventricular papillary muscle level.
|
Left ventricular eccentricity index
In patients with PH, flattening of the interventricular septum (IVS) or a D-shaped left ventricle (LV) is observed due to the high RV pressure and delay in the time to peak RV contraction causing asynchrony between ventricles.18) The LV eccentricity index is measured in the PSAX view between the mitral valve and the papillary muscle level. The axis parallel to the IVS (D1) and the minor axis perpendicular to the IVS (D2) are measured (Table 3 and Figure 2B).
The D2 to D1 ratio is defined as the eccentricity index: Eccentricity index = D1/D2. The end-systolic LV eccentricity index is increased in pressure-overload situations, whereas the end-diastolic LV eccentricity index is increased in volume-overload conditions. LV eccentricity index > 1.1 in end-systole is considered abnormal.1)
Tricuspid annular plan excursion
The longitudinal RV motion along the axis can be assessed for RV function evaluation. One of the most widely used methods is tricuspid annular plane excursion (TAPSE), defined as the maximal excursion of the M-mode cursor with the cursor in the direction of the RV lateral annulus, between the end-diastole and peak systole (Table 3 and Figure 2C).
TAPSE < 1.7 cm is regarded as RV systolic dysfunction.10)
Right ventricular fractional area change
The RV fractional area change (RV FAC) is measured in the A4C view by the planimetered area of the RV end-systole and end-diastole (Table 3 and Figure 2D). This gives an estimate of the global RV systolic function that has good correlation with RHC-measured mPAP.19) The RV area is obtained by tracing the RV endocardium from the annulus, along the free wall to the apex, and then back to the annulus, along the IVS.9) However, it is difficult to measure RV FAC in patients with prominent RV trabeculation because it is hard to define endocardial borders in such patients.20)
The RV FAC is measured by manually tracking the endocardial border of the RV in end-systole and end-diastole. The RV FAC is defined by the following formula: RV FAC = (RV area at end-diastole – RV area at end-systole)/RV area at end-diastole × 100.10) RV FAC < 35% is considered RV systolic dysfunction.10)
Right ventricular dimensions
In patients with PH, the RV is usually dilated due to the increase of preload and afterload.16)17) PH can be estimated using linear measurements of the RV dimensions in the RV-focused A4C view (Table 3 and Figure 3A).10) There may be technical difficulties because RV is a three-dimensional structure in which the RV outflow tract protrudes out of the echocardiographic A4C plane.
The RV diameter 1 (RVD1) is defined as the basal diameter of the RV, measured at the basal one-third of the RV. The RV diameter 2 (RVD2) is measured at the LV papillary muscle level. RVD1 > 41 mm and RVD2 > 35 mm are considered abnormal.13) All measurements are performed in end-diastole.
Right ventricular tissue Doppler systolic (S') velocity
Measurement of the systolic (S') velocity of the tricuspid lateral annulus using tissue Doppler imaging is similar to that of TAPSE. As in TAPSE measurement, the PW cursor is placed in the direction of the lateral tricuspid annulus in the RV-focused A4C view, and tissue Doppler imaging is performed (Table 3 and Figure 3B).21) The lateral RV free wall and the lateral tricuspid annulus have to be aligned with the Doppler direction to avoid underestimation of the S' signal.8) Although the current method is reproducible and easy to perform, some studies have shown that decreased S' may not be representative of whole RV function in patients with regional wall abnormality of the RV.8) S' velocity < 9.5 cm/sec is regarded as abnormal RV systolic function.8)10)
Right ventricular wall thickness
RV thickness can be measured as a surrogate for PH, although a thick RV wall can be present in the absence of PH, such as in infiltrative diseases.22) In the subcostal view, the RV wall should be aligned perpendicular to the ultrasound beam at the level of the tricuspid valve leaflet. M-mode can be used to measure RV thickness at end-diastole.8) One should be cautious to exclude pericardial fat or thickened pericardium from RV thickness measurements. The normal cut-off value is 0.5 cm in the subcostal or PLAX view.8)
CONCLUSIONS
The importance of evaluating PH in patients with heart or lung diseases is emerging. Echocardiography can play a critical role in detecting or screening PH, as various methods have been introduced. It is important to understand the basic concepts and methodology for performing such echocardiographic measurements.
 XML Download