

 PDF
PDF ePub
ePub Citation
 Print
Print


INTRODUCTION
Cardiovascular disease (CVD) is a major cause of morbidity and mortality in patients with type 2 diabetes mellitus (T2DM).1 Diabetes roughly doubles the risk of CVD,2 with the main risk factors being components of metabolic syndrome, such as abdominal obesity, high blood pressure, and elevated plasma levels of triglycerides (TG).1 In recent years, many epidemiological studies have focused on identifying emerging cardiovascular risk factors, including non-alcoholic fatty liver disease (NAFLD) and genetic mutations such as clonal hematopoiesis.34 These approaches are important for the prevention of macrovascular complications among patients with T2DM and can be further utilized as predictive tools or therapeutic candidates.
Bilirubin, which is produced by heme oxygenase (HO)-1, a rate-limiting enzyme in heme degradation, is known to have anti-inflammatory and antioxidative effects.5 In 1994, the first clinical study reported that low bilirubin levels were associated with an increased risk of coronary artery disease.6 However, most association studies conducted on this topic used cross-sectional designs and few studies have been conducted in patients with T2DM.789
Therefore, the aim of this study was to investigate the associations between total serum bilirubin levels and carotid atherosclerosis progression in Korean T2DM patients.
MATERIALS AND METHODS
1. Study population
The Seoul Metabolic Syndrome Cohort, which recruited a total of 13,296 patients at Huh's Diabetes Center and the 21st Century Diabetes and Vascular Research Institute, has been previously described.310 In this study, we included 1,381 T2DM patients over 19 years of age, for whom data on repeated carotid artery ultrasonography over up to 8 years of follow-up and total serum bilirubin levels were available. T2DM was defined using the American Diabetes Association classification.11 Patients under 19 years old; those with type 1 diabetes, pregnancy, liver diseases other than NAFLD (e.g., autoimmune or viral hepatitis), or a history of heavy alcohol consumption (210 g/week for men and 140 g/week for women); and those for whom it was difficult to judge the progression of bilateral carotid artery plaques by repeat ultrasonography were excluded from this study. The Institutional Review Board of Yonsei University approved this study (IRB NO. 4-2019-1183) and the requirement to obtain written informed consent was waived due to the retrospective study design.
2. Measurements of clinical and laboratory variables
At patients' initial visits, various clinical and laboratory parameters were collected. We used a self-report questionnaire to acquire social and medical histories, including smoking status, alcohol use, past and current history of medications, and the year of diabetes diagnosis. Well-trained nurses measured patients' height, weight, and waist circumference. For laboratory data, patients were required to fast at least 8 hours to ensure accurate measurements of fasting plasma glucose, total cholesterol (TC), TG, and high-density lipoprotein cholesterol (HDL-C). Other laboratory data such as glycated hemoglobin (HbA1c), blood urea nitrogen, creatinine, and total bilirubin were also obtained on the same day of collection.
Chronic kidney disease (CKD) was defined as at least stage III (estimated glomerular filtration rate <60 mL/min/1.73 m2 for over 3 months), using the Modification of the Diet in Renal Disease equation.12
Patients' insulin sensitivity was assessed using the short insulin tolerance test, which measures the rate of plasma glucose disappearance (Kitt, %/min).13 The test was done at 8:00 AM after an overnight fast. After an intravenous bolus injection of prediluted regular insulin (0.1 U/kg Humulin; Eli Lilly, Indianapolis, IN, USA), venous blood samples were collected at 3-minute intervals over the course of 0 to 15 minutes. To measure plasma glucose concentrations, a Beckman glucose analyzer II (Beckman Coulter Inc., Brea, CA, USA) was used, and the analysis was done immediately after sampling. Kitt was determined by calculating the slope of the decrease in log-transformed plasma glucose during 3 to 15 minutes, and a Kitt below 2.5%/min was defined as indicating insulin resistance.14 To prevent potential hypoglycemia, a 100-mL solution of 20% dextrose was infused intravenously immediately after the test.
3. Carotid ultrasonography and definition of the progression of atherosclerosis
Participants underwent carotid ultrasonography at least twice to evaluate their carotid atherosclerosis status throughout the study period. Each common carotid artery was scanned by high-resolution ultrasonography with a 10-MHz linear probe (LOGIQ7; GE, Milwaukee, WI, USA) by trained technicians who were blinded to patients' baseline data. Using a lateral longitudinal projection, the common carotid artery was scanned at the middle and distal parts. Measurements of carotid intima-media thickness (CIMT) were made at the far walls of the middle and distal common carotid artery, at a point 1 cm proximal from the carotid bulb. CIMT was defined as the distance (in millimeters) between 2 interfaces (lumen-intima and media-adventitia, respectively). The mean value from 3 measurements on each side was used. Carotid atherosclerosis progression was defined as the presence of a newly developed carotid plaque on repeated ultrasonography. A carotid plaque was defined by 1) the presence of a distinct hyperechogenic area, 2) CIMT greater than or equal to 1.5 mm, and/or 3) atherosclerotic protrusion into the arterial lumen with at least 50% greater thickness than the surrounding area, as previously described.15
4. Statistical analysis
Continuous variables were expressed as mean±standard deviation, and categorical variables were expressed as number (percentage). Baseline characteristics were compared between patients with and without plaque progression. We used the t-test for continuous variables and the χ2 test for categorical variables. Tertiles of total serum bilirubin levels were determined after stratification by sex. One-way analysis of variance was done for 3-group comparisons. Multivariable logistic regression analysis was performed to determine the factors predicting plaque progression with adjustment for confounding variables. SPSS version 25.0 (IBM Corp., Armonk, NY, USA) was used for statistical analyses. A p-value <0.05 was considered to indicate statistical significance.
RESULTS
1. Baseline characteristics
Among 1,381 T2DM patients, 599 (43.4%) experienced carotid plaque progression during the follow-up period. The baseline characteristics of the subjects according to the status of plaque progression in the carotid arteries are shown in Table 1. Patients with plaque progression had significantly distinct characteristics from those with no plaque progression; their mean age was older (59.6±9.2 vs. 54.0±9.9 years, p<0.001), hypertension was more prevalent (34.3% vs. 27.7%, p=0.009), waist circumference was higher (84.7±8.1 vs 82.7±8.5 cm, p<0.001), T2DM duration was longer (6.9±6.6 vs. 5.8±5.7 years, p=0.001), insulin resistance index was poorer (2.1±1.0 vs. 2.2±1.0, p=0.006), TC levels (203.3±39.1 vs. 192.8±42.7 mg/dL, p<0.001) and TG levels (157.3±90.7 vs. 142.1±116.8 mg/dL, p=0.009) were higher, the percentage of patients with CKD stage ≥3 was higher (9.0% vs. 6.2%, p=0.044), total serum bilirubin levels were lower (0.80±0.40 vs. 0.87±0.40 mg/dL, p<0.001), and the percentage of statin use was lower (9.0% vs. 12.9%, p=0.023). Statistically insignificant between-group differences were found for other characteristics, such as sex, body mass index (BMI), alcohol use, smoking, HbA1c, HDL-C levels, insulin use, sulfonylurea use, metformin use, thiazolidinedione use, and aspirin use.
Table 1
Baseline characteristics
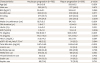
Values are number (%) or mean±standard deviation.
BMI, body mass index; HTN, hypertension; DM, diabetes mellitus; HbA1c, glycated hemoglobin; Kitt, rate constant for plasma glucose disappearance; TC, total cholesterol; TG, triglycerides; HDL-C, high-density lipoprotein cholesterol; eGFR, estimated glomerular filtration rate test.
![]()
2. Clinical characteristics according to tertiles of total serum bilirubin
As total serum bilirubin levels were significantly lower in patients with plaque progression, we investigated whether patients' baseline characteristics differed by bilirubin levels. When the data were analyzed according to serum bilirubin levels divided into tertiles, several variables showed statistically significant differences. Compared to the lowest tertile group, the highest tertile group was younger (56.7±10.0 vs. 55.1±9.3 years, p<0.001), contained a smaller proportion of patients using metformin (28.5% vs. 35.9%, p=0.015) and thiazolidinedione (5.4% vs. 12.5%, p<0.001), and had higher levels of TC (198.4±42.3 vs. 192.5±39.1 mg/dL, p=0.012) and HDL-C (52.8±5.8 vs. 48.7±14.6 mg/dL, p<0.001) (Table 2). Statistically insignificant relationships were found for other variables, such as BMI, T2DM duration, and HbA1c levels.
Table 2
Clinical and laboratory parameters according to tertiles of serum bilirubin levels
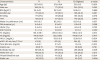
Values are number (%) or mean±standard deviation.
BMI, body mass index; HTN, hypertension; DM, diabetes mellitus; HbA1c, glycated hemoglobin; TC, total cholesterol; TG, triglycerides; Kitt, rate constant for plasma glucose disappearance; HDL-C, high-density lipoprotein cholesterol; eGFR, estimated glomerular filtration rate test.
![]()
3. Association between total serum bilirubin and the progression of carotid atherosclerosis
Fig. 1 shows the percentage of plaque progression in each tertile of total serum bilirubin levels. In the lowest and middle tertiles, 45.8% and 46.8% of patients showed progression of carotid artery plaques, respectively. However, only 37.9% of patients in the highest tertile had plaque progression, which was a statistically significant difference (p for trend=0.014).
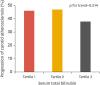 | Fig. 1Impact of serum bilirubin levels on the progression of carotid atherosclerosis. The percentage of patients experiencing plaque progression in each tertile of total bilirubin is shown. In the first tertile of serum bilirubin levels, the percentage of patients experiencing plaque progression was 45.8% (i.e., 54.2% did not show plaque progression). In the second tertile of serum bilirubin levels, 46.8% of patients showed plaque progression, and in the third tertile, the corresponding percentage was 37.9%. Using the linear by linear association method, the percentage of patients with plaque progression was found to show a decreasing trend with increasing serum bilirubin tertile (p=0.14).
|
As the progression of carotid atherosclerosis is a complex process that can be affected by many confounding clinical and laboratory parameters, multivariable logistic regression analyses were conducted (Table 3). In a fully-adjusted model, total serum bilirubin levels were associated with a significantly decreased risk of progression in CIMT by 42% (odds ratio [OR], 0.584; 95% confidence interval [CI], 0.392–0.870; p=0.008). Other variables that showed statistical significance for predicting the progression of carotid atherosclerosis were age (OR, 1.062; 95% CI, 1.044–1.080; p<0.001), BMI (OR, 1.056; 95% CI, 1.007–1.107; p=0.023), and TC (OR, 1.005; 95% CI, 1.001–1.008; p=0.019).
Table 3
Associations of clinical and laboratory parameters with the progression of carotid atherosclerosis
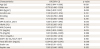
OR, odds ratio; CI, confidence interval; BMI, body mass index; HTN, hypertension; DM, diabetes mellitus; HbA1c, glycated hemoglobin; Kitt, rate constant for plasma glucose disappearance; TC, total cholesterol; TG, triglycerides; HDL-C, high-density lipoprotein cholesterol; eGFR, estimated glomerular filtration rate test.
![]()
DISCUSSION
The present study of a longitudinal T2DM cohort with carotid ultrasonography data from an 8-year follow-up clearly demonstrated that patients with plaque progression showed significantly lower levels of total serum bilirubin than those with no plaque progression. Individuals with higher total serum bilirubin levels tended to be younger and to have higher TC and HDL-C levels than those with lower total serum bilirubin levels. After full adjustment for multiple confounding factors, total serum bilirubin levels were significantly associated with a 42% decrement in the risk of plaque progression in the carotid arteries in T2DM patients.
Several studies have shown an inverse association between serum bilirubin levels and the risk of CVD. Schwertner et al.6 showed a significant negative correlation between bilirubin concentrations and the prevalence of coronary artery disease in a cross-sectional study of a non-diabetic population. Since then, many studies on this topic have been conducted, consistently demonstrating that lower bilirubin levels are associated with a higher risk of early familial coronary artery disease,16 ischemic stroke,17 coronary artery calcification,18 and CIMT.8 Additionally, a meta-analysis confirmed the existence of an inverse relationship between serum bilirubin levels and the risk of incident CVD in the general population.19
However, most studies have included a limited proportion of T2DM patients. The association between serum bilirubin levels and CVD has not been sufficiently investigated among patients with T2DM. A cross-sectional study reported that low bilirubin levels were significantly associated with arterial stiffness measured by the brachial-ankle pulse wave velocity in women with T2DM, but not in men.20 Another cross-sectional study of 6,713 patients with T2DM showed no significant association between low bilirubin levels and an increased risk of CVD.21 However, the investigators explored the interaction of serum uric acid and bilirubin levels, and demonstrated that the concomitant presence of both high serum uric acid and low bilirubin levels was associated with a strongly increased risk for CVD in T2DM patients.
Our cohort data further demonstrated that conventional cardiovascular risk factors such as age, obesity, and TC were significantly associated with the deterioration of carotid plaques in T2DM patients. In a study of the general population, age, smoking, high blood pressure, low-density lipoprotein cholesterol, and HDL-C were found to be significantly related to progression of the mean CIMT.22 A Norwegian study of 13-year follow-up cohort data with more than 2,700 participants found that age, male sex, TC, systolic blood pressure, and smoking were significant predictors of the total plaque area measured by ultrasonography, whereas BMI and diabetes did not show a significant relationship.23 A previous study of T2DM patients with a mean follow-up period of 31 months reported that the presence of peripheral arterial disease and low HDL-C levels were predictors of the occurrence of carotid plaques, while diastolic blood pressure and BMI were associated with the maximal CIMT and mean CIMT, respectively.24 A Japanese study of T2DM patients showed that age and average HbA1c during a 3.1-year follow-up predicted the progression of CIMT.25 Similar to their findings, our data also revealed a marginal association between baseline HbA1c and carotid plaque progression (OR, 1.075; p=0.065).
Extensive in vitro and in vivo research has explored the mechanisms of the protective effects of bilirubin. Atherosclerosis is a very complex disease process, and bilirubin is known to be able to influence various stages of atherosclerosis, from initiation to progression, through multiple mechanisms, including its antioxidant and anti-inflammatory effects, inhibition of smooth muscle cell proliferation, improvement of endothelial function, and alteration of lipoproteins. First, bilirubin has been shown to exert powerful antioxidant activity against lipoprotein oxidation in vascular smooth-muscle cells.26 An in vivo study using an animal model of hyperbilirubinemia (Gunn rats) showed that bilirubin exerted a protective effect against oxidative damage in the plasma of rats with jaundice when exposed to hyperoxia.27 Consistent with animal studies, exogenously applied bilirubin was found to inhibit the effects of HO-1 and to suppress chemotactic activity in monocytes.28 Additionally, bilirubin attenuated the overexpression of adhesion molecules via inhibition of the nuclear factor-κB pathway and inhibited the endothelial adhesion of polymorphonuclear leukocytes induced by tumor necrosis factor alpha.2930 In addition to influencing the inflammatory process of atherosclerosis, bilirubin could prevent neointimal formation by inhibiting the proliferation of vascular smooth muscle cells (VSMCs). In hyperbilirubinemic Gunn rats and wild-type rats treated with biliverdin, bilirubin attenuated balloon injury-induced neointimal formation and inhibited progression through the cell cycle in smooth muscle cells via inhibition of the mitogen-activated protein kinase signaling pathways.31 Administration of exogenous bilirubin has also been found to inhibit neointimal formation after an arterial injury.32 Several studies have shown that bilirubin changed the composition of lipoproteins, especially apolipoprotein A1 and B.3334 Lastly, HO-1, which catalyzes the initial, rate-limiting step of heme catabolism and bilirubin formation, is well known to exert various protective effects against vascular complications of diabetes. In experimental models of atherosclerotic CVD, HO-1−/−apoE−/− mice showed more advanced atherosclerotic lesion formation than HO-1+/+apoE−/− mice,35 and VSMCs isolated from HO-1 knockout mice were much more susceptible to oxidative stress, leading to cell death, than those isolated from control mice.36
The current study has some limitations. Due to the lack of outcome data regarding cardiovascular events and mortality, we were unable to assess the association between total serum bilirubin levels and clearly-defined outcome parameters. However, CIMT is a reliable surrogate index for predicting the future development of cardiovascular and cerebrovascular diseases. Furthermore, a retrospective study design has intrinsic drawbacks in determining whether low total serum bilirubin levels are merely a predictor of the progression of atherosclerosis in T2DM patients, or whether they may play a causal role in this process. Dynamic changes in medication during the follow-up period were not fully adjusted in this study. Nevertheless, a strength of the present study is that it is the first study to investigate the longitudinal relationship between carotid plaque progression and serum bilirubin levels in a large number of T2DM participants who periodically underwent a detailed examination with a relatively long follow-up.
In conclusion, this longitudinal analysis demonstrated that higher levels of total serum bilirubin were significantly associated with a lower incidence of plaque progression in the carotid arteries in T2DM patients. A prospective study design or mendelian randomization approach would be needed to conclusively determine the impact of total serum bilirubin levels on the progression of atherosclerosis in T2DM. These will allow us to understand whether bilirubin plays a predictive or causative role for cardiovascular and cerebrovascular complications in T2DM patients.
 XML Download