

 PDF
PDF ePub
ePub Citation
 Print
Print


INTRODUCTION
Once thought to be static, lipids in the body turn over at varying rates to achieve overall “dynamic” homeostasis as do other bodily materials.1 Current understanding of the dynamic nature of lipids in the body is largely attributed to stable isotope tracer-based metabolic research, particularly to the pioneering research by Schoenheimer and his colleagues.123 The lipid pool size in tissues such as plasma, adipose tissue, and liver can change if an imbalance between rates of appearance (Ra) into and disappearance (Rd) from the compartment occurs in normal (e.g., exercise) or pathological processes (e.g., non-alcoholic fatty liver disease, NAFLD) over time. For example, plasma hypertriglyceridemia, an excess of plasma triacylglycerol (TAG) concentrations particularly in postprandial state that is an independent risk factor for atherosclerosis,456 can occur when the rate of appearance of TAG (Ra TAG) into the circulation exceeds rate of disappearance or disposal (Rd TAG) from the circulation. Another example is NAFLD, which occurs due to Ra into exceeding Rd from the compartment (i.e., liver in this case) of TAG over time. This increase in TAG pool size in plasma or in the liver must occur as the direct result of Ra exceeding Rd of TAG, regardless of their absolute rates, with countless permutations of the 2 processes. On the other hand, the TAG pool will remain constant if there is a close match between Ra and Rd, again regardless of their absolute rates. Thus, a physiological steady state does not mean “zero” turnover of TAG, but rather a balance between rates of appearance and disappearance. These rates cannot be captured by techniques such as various “omics” and molecular biology tools, but by stable isotope tracer techniques. While elucidation at the levels of omics as well as signaling pathways implicated in the lipid kinetics may provide valuable information, it is limited to “snap-shot” information. It has been often demonstrated that static information does not equate with actual flux rates in vivo.78910 In this regard, stable isotope tracer methodology can provide information on lipid dynamics (“kinetics”), complementary to the static information. In this review, we will discuss the dynamic nature of lipid metabolism with an emphasis on the regulation of lipid kinetics underlying changes in tissue TAG pool size in normal and pathophysiological conditions. Then, we will discuss the basic principles of stable isotope tracer methodology that can assess in vivo kinetics of lipid dynamics. Finally, we will provide numerical examples on how to quantify some aspects of lipid kinetics in vivo using the methodology in relation to health and disease.
WHY DO WE NEED IN VIVO LIPID KINETICS?
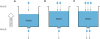
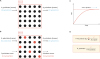
To facilitate understanding of why obtaining in vivo kinetic information for better dissecting one's health or disease status is critical, we provide here an analogy of a water tank into and out from which water moves (i.e., water turnover). Fig. 1 shows the volume of water in the water tank is determined by 2 factors: the rate of appearance (Ra) of water into and the rate of disappearance of water out (Rd) of the tank. The pool size will stay same if 2 rates are identical as in the case of tank A. However, the water pool size will change if there is a mismatch between Ra and Rd: increase (Ra>Rd) or decrease (Ra<Rd), which is independent of their absolute rates. To reveal the importance of the point, here we show 2 water tanks experiencing elevations in water volume at an identical rate while Ra and Rd are different between tank B and tank C in Fig. 1. These examples show that pool size per se does not provide critical information on water turnover (i.e., kinetics) and furthermore the “quality” of water, latter of which can be often influenced by the rate of water turnover (i.e., turnover replaces old with new).
Fig. 1
The volume of water (i.e., water pool size) in the tank is determined by the balance of 2 kinetic variables: 1) rates of appearance (Ra) into and 2) disappearance (Rd) of water from the tank. The water pool size can change if an imbalance between the rates exists, regardless of their absolute rates. Furthermore, absolute rate of the water turnover may affect the quality of the water (i.e., “metabolic health”).
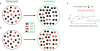
The same rationale as illustrated with water kinetics applies to the assessment of the dynamics of lipid metabolism, and the limitations in relying entirely on “static” snap-shot information (e.g., measurement of pool size) to understand the regulation of lipid metabolism. For example, plasma TAG pool size is determined by the balance between Ra TAG into and Rd TAG from the tissue compartment (e.g., plasma, liver, muscle) (Fig. 2). As in the case of tank A, TAG pool size does not change unless there is an imbalance between Ra and Rd, as in the case of tank B and tank C. Although the rate of increase of TAG pool size in the tank B and tank C is identical, the actual rates are not same. In tank B, the mechanism responsible for the rise is not an increase in Ra TAG but a decrease in Rd. On the other hand, the cause of the rise of TAG pool size in tank C is different than tank B. In tank C, both Ra and Rd TAG are reduced compared to tank A but a decrease in Rd is much greater than that of Ra, which in turn leads to the elevation of TAG, underscoring the importance of quantifying both sides of the balance equation.
Fig. 2
TAG pool size (concentration×volume of distribution) in the tissue compartment (e.g., plasma, liver, and muscle) is determined by the balance between rates of appearance (Ra), or secretion and disappearance (Rd) or clearance of VLDL-TG (i.e., TAG turnover), regardless of their absolute rates. In tank A, the TAG pool size stays same due to the close match between Ra and Rd. However, both tanks B and C are in hypertriglyceridemic states to an identical magnitude despite different rates of each side of TAG turnover (i.e., Ra and Rd), underlying the importance of assessing dynamics of lipid metabolism in addition to the “static” snap-shot information (e.g., measurement of pool size).
TAG, triacylglycerol; VLDL-TAG, very low-density lipoprotein-triacylglycerol.
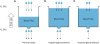
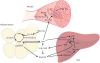
Fig. 3 shows various potential sites of dysregulation of lipids kinetics that leads to clinical phenotypes (e.g., plasma hypertriglyceridemia and NAFLD). For example, elevated plasma TAG concentrations above normal range of value (i.e., hypertriglyceridemia) must be due to the direct result of the rate of very low-density lipoprotein-triacylglycerol (VLDL-TAG) secretion (i.e., Ra) from the liver into the circulation exceeding the rate of VLDL-TAG removal (i.e., Rd) from the circulation. This imbalance can be due either to increased Ra TAG (i.e., liver VLDL-TAG secretion), decreased Rd TAG (peripheral TAG clearance via lipolysis into free fatty acid (FFA) and glycerol), or both. The site of the cause of hypertriglyceridemia will not be revealed until both sides of the balance equation (i.e., Ra and Rd TAG) are quantified. Furthermore, even in the case when we know which side of the balance equation is the culprit of the elevated plasma TAG concentration, there are still numerous potential sites of dysregulation in the 2 rates. For example, if the problem was assumed to be due to increased Ra VLDL-TAG into the circulation, the possibility of the problem may be driven by dysregulation of intrahepatic site (i.e., dysregulation of liver metabolism per se such as abnormal changes at transcriptomics, proteomics, and/or signaling activity), extrahepatic site (e.g., enhanced delivery of precursor FFA to the liver via enhanced adipose tissue TAG lipolysis and subsequent Ra FFA or via de novo lipogenesis from carbohydrate), or both. In terms of extrahepatic origin, there are several potential sites: 1) an increased adipose tissue lipolysis, which in turn increases Ra FFA into the circulation and then to the liver, 2) a reduced intra-adipocyte cycling (re-esterification of FFA back to TAG in adipose tissue) without changes in TAG lipolysis rate, leading to increased Ra FFA, or 3) both. Changes in Ra FFA affect rate of precursor (i.e., FFA) delivery to the liver where it is largely repackaged into TAG before appearing in the plasma as VLDL-TAG. Furthermore, the rate of FFA delivery to the liver can be affected by rate of FFA uptake and subsequent metabolic processes (i.e., re-esterification to intracellular TAG or mitochondrial oxidation to CO2) by other tissues such as skeletal muscle. Likewise, reduced Rd TAG could be due to a number of mechanisms downstream of the site of TAG removal, including reduced rates of mitochondrial fat oxidation and/or of re-esterification at the tissue (e.g., intramuscular TAG synthesis). Therefore, it is clear that in relying solely on static information without knowing dynamic nature of lipid metabolism (i.e., kinetics), it is difficult to determine the exact location(s) or “nature” of the disruption and thus to develop effective therapeutic strategies (e.g., exercise, nutrition, and drugs) and evaluate their efficacy. In the following section, we will discuss stable isotope tracer methodology that enables exploration of dynamic nature of lipid metabolism in vivo: basic principles of stable isotope tracer methodology in determining lipid kinetics in vivo.
Fig. 3
Schematic of potential sites of dysregulation of lipid metabolism to which stable isotope tracers can be applied to obtaining dynamic nature of lipid kinetics.
FA-CoA, fatty acyl CoA; IMTAG, intramuscular triacylglycerol; FFA, free fatty acids; G-3-P, glycerol 3 phosphate; VLDL, very low-density lipoprotein; DNL, de novo lipogenesis; GNG, gluconeogenesis; TAG, triacylglycerol.
BASIC PRINCIPLES OF TRACER METHODOLOGY FOR ASSESSING LIPID KINETICS IN VIVO
We will focus on stable isotope tracer methodology in assessing in vivo metabolic flux but not radioactive isotope tracer methodology due to a number of reasons including health issues for humans. However, underlying principles of the methodologies are similar except for technical differences related to the nature of detection of the tracer. In this section, we will discuss following topics: 1) overview of performing a stable isotope tracer study in humans and 2) basic principles of stable isotope tracer methodology.
BRIEF OVERVIEW: CONDUCTING A STABLE ISOTOPE TRACER INFUSION STUDY
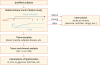
Fig. 4 shows a schematic overview with respect to conducting a typical stable isotope tracer infusion study to determine in vivo lipid kinetics in humans (also applicable to animal models). In this review, we will give a brief overview with respect to conducting a simple stable isotope tracer infusion study with which to determine some aspects of lipid kinetics in vivo such as Ra palmitate. Briefly, qualified subjects can take part in a study in the basal state or during or following an intervention (e.g., exercise, nutrition, and/or drugs). It is typical that an acute intervention is administered during the metabolic study (e.g., assessing flux rate at basal state and after acute exercise and/or nutritional intake). With this approach each subject essentially serves as their own control. To monitor the dynamics of the substrate being traced (i.e., tracee) such as FFA, one or more of tracer is administered into the body, typically intravenously. The tracer is an identical species of tracee (endogenously produced counterpart of the tracee in the body) except for differences in mass between tracer and tracee by one or more of mass units due to incorporation of one or more of heavier (stable) isotopes into the tracer molecule. The tracer is not distinguished from the tracee by the body, but the relative enrichment of the tracee by the exogenously-administered tracer is determined by mass spectrometry or appropriate analytical instruments. For example, a tracer [1-13C]palmitate is one mass unit heavier than the most abundant palmitate molecule (i.e., 12C161H3216O2) containing only monoisotopic elements. Tracer(s) can be administered into body either as a bolus injection (then following decay of tracer enrichment relative to tracee with multiple blood samplings), a continuous infusion at a specific rate (F) with collecting a few blood samplings after achieving an isotopic plateau, at which point isotopic enrichment (Ep) does not change over time. Most commonly, a tracer is administered as a combination of a bolus injection with subsequent infusion of tracer at a specific rate (i.e., primed constant infusion). A practical advantage of a primed constant infusion of tracer is to reduce time to reach Ep and thus reduce the total experimental duration. To administer one or more of tracer(s) into the body, a catheter for intravenous infusion of tracer(s) is inserted into one hand or lower arm, while a separate catheter is placed into a vein in the other hand or lower arm for blood sampling. Blood sampling is typically from a dorsal hand vein heated at up to 60°C for about 10 minutes before sampling with a heating box or pad to “arterialize” the venous blood sample.11 The first blood sample is collected before the tracer infusion begins in order to determine background enrichment. The background sample is used to quantify the amount of naturally-occurring tracee with the same molecular weight as the tracer. After a bolus injection of tracer, the same tracer is infused constantly at a specified rate. To determine basal substrate kinetics, blood samples (typically 3 samples) are obtained after achieving Ep. Blood samples obtained before and during the experimental period are used for determining tracer enrichment relative to tracee (i.e., tracer to tracee ratio [TTR]), typically determined using gas chromatography- or liquid chromatography-mass spectrometry (GC-MS or LC-MS). As stated above, Ra tracee is calculated as F divided by Ep. Importantly, multiple stable isotope tracers can be simultaneously administered into body for assessing various kinetics of lipids as well as other substrates such as glucose,812131415 amino acids1617181920 and nitric oxide.212223 In this review, we will deal only with steady state substrate kinetics due to the complexity and uncertainty of non-steady state kinetics despite much of the real life being more in non-steady state. For more in-depth information regarding tracer methodology, further readings are available elsewhere.2425
Fig. 4
Flow diagram showing the sequence of events in a stable isotope tracer infusion study for assessing metabolic kinetics such as lipids. Qualified subjects take part in tracer infusion studies before, during, and/or after an intervention. During the tracer infusion study, subjects receive a primed continuous infusion of tracer(s) at a predetermined rate (F) during a specified time period before and during which tissue samples (e.g., plasma) are collected for determination of enrichments by GC- or LC-MS. In vivo metabolic substrate kinetics (e.g., Ra FFA) are calculated based on appropriate tracer models using F and enrichments at steady state (Ep, dotted blue line in “stable isotope tracer infusion study”). The number of samples collected is dependent on the study design.
TTR, tracer to tracee ratio; Ra, rate of appearance; FSR, fractional synthesis rate; GC-MS, gas chromatography-mass spectrometry; LC-MS, liquid chromatography-mass spectrometry; FFA, free fatty acid; TAG, triacylglycerol.
BASIC MODELS OF TRACER METHODOLOGY
Quantification of in vivo flux of lipids using tracer methodology is collectively based on 2 mathematical models: 1) tracer dilution model and 2) tracer incorporation model. In any tracer study, assessments of rate of metabolic fluxes are accomplished by using either one of these 2 or their combinations.
1. Tracer dilution model
The principle of the tracer dilution model is relatively simple as it determines the extent of dilution of tracer relative to tracee at isotopic and metabolic steady state. Fig. 5 shows a schematic principle of how the dilution model works. Here we provide an example of in vivo quantification of Ra FFA in the fasted steady state. If the pool size is constant, we know that Ra FFA is equal to Rd FFA. To determine Ra FFA, a representative tracer (i.e., palmitate tracer, denoted as red circle) is constantly infused at a fixed rate (F) intravenously into body to estimate the Ra FFA (i.e., tracee, denoted as black circle). As a function of time, relative concentration of tracer to tracee rises until it reaches plateau, which is called plateau enrichment or isotopic equilibrium (Ep). At Ep, Ra tracee palmitate is equal to Rd tracee palmitate, which is the same for Ra (i.e., F) and Rd palmitate tracer. And the ratio of these 2 (i.e., TTR or t/T) is the direct reflection of the ratio of Ra palmitate and F. In the dilution model, therefore, Ra tracee is inversely proportional to TTR for a given F. With regard to the calculation of Ra FFA, there are 2 steps: 1) Ra palmitate needs to be calculated by dividing F by Ep and then 2) Ra palmitate is then divided by the palmitate fractional contribution (FC) to total FFA to give Ra FFA. Here we provide a numerical example (Fig. 5). If F is 2.5 μmol/min delivered into system, and the measured Ep is 0.25, then Ra palmitate would be 10 μmol/min (i.e., F/Ep=2.5 μmol/min/0.25). If we assume the FC of palmitate to total FFA in the basal fasted state (e.g., FC=0.65),26 then Ra FFA can be calculated to be 15.4 μmol/min (i.e., Ra palmitate/its FC=10 μmol/min/0.65=15.4 μmol/min), which is also Rd FFA, as the pool size stays same. This principle applies to the assessment of Ra of any compound (e.g., glycerol, amino acids, lactate, glucose etc.) that appears in a compartment and leaves the same compartment (e.g., plasma), to which a tracer of the same compound is introduced.
Fig. 5
Schematic principle of the tracer dilution model for assessing in vivo metabolic flux rate. In a steady state before introduction of tracer(s) Ra tracee (black circle) is equal to Rd tracee, both of which are unknown (A). To determine tracee kinetics, a (primed) constant infusion of tracer (e.g., palmitate, red circle) is performed during which tracer concentration relative to tracee concentration (i.e., TTR) rises to plateau where tracer infusion rate (F) is also equal to rate of tracer palmitate leaving the compartment (B). The time course of changes in isotopic enrichment after constant infusion of tracer is shown in (C). Based on these relations, it is derived that TTR at plateau is equal to ratio of F to Ra Tracee. By rearranging the equation, it is derived that Ra tracee is equal to F divided by TTR at plateau (i.e., Ep) (D).
TTR, tracer to tracee ratio.
2. Tracer incorporation model
The principle of the tracer incorporation model is predicated on determining the rate of precursor (e.g., fatty acid, acetate unit of fatty acids, glycerol, and so on) incorporation to product (e.g., TAG). Fig. 6 shows a schematic principle of the tracer incorporation model to determine the synthesis rate of a product. For example, TAG is comprised of fatty acids and glycerol in 3:1 stoichiometric ratio. Fatty acids comprising TAG are combinations of various fatty acid species such as palmitate (saturated fatty acid containing 16 carbons with 8 repeating acetate monomers), stearate (saturated fatty acid containing 18 carbons with 9 repeating acetate monomers), oleate (monounsaturated fatty acid containing 16 carbons with 8 repeating acetate monomers) and so on. For simplicity, here we provide an example of determining rate of synthesis of a theoretical polymer that is comprised of 2 repeating monomers (2 same units). Quantification of more complex species such as TAG (3 fatty acids+1 glycerol) and palmitate (8 repeating acetate moieties) is identical in principle. To assess synthesis rate of TAG bound to VLDL, various tracers can be used such as fatty acid, acetate, and glycerol (backbone of TAG) (e.g., [1-13C]palmitate, [U-13C16]palmitate, and [2H32]palmitate). After achieving an isotopic equilibrium of a precursor enrichment (i.e., EP=1.0), which is far greater than what would normally be achieved (for a conceptual understanding) with a representative precursor tracer, labelled and unlabeled precursors will be incorporated into product polymers in proportional to their relative abundance. Thus, increases in product enrichment is dependent on 1) the precursor tracer enrichment achieved at isotopic equilibrium, 2) the pool size, and 3) the rate of polymer synthesis. With an isotopic steady state of 1.0, the possible permutations of labeled compound (i.e., tracer precursor) and unlabeled compound (i.e., tracee precursor) are 4, i.e., unlabeled-unlabeled (25%), unlabeled-labeled (25%), labeled-unlabeled (25%), and labeled-labeled (25%) with the exact same probability of each case. And regardless of the turnover rate and size of the pool of the product, the product enrichment will continue to increase until it becomes equal to the precursor enrichment. Measurement of the synthesis rate of a polymer is determined as a change in product enrichment over a given time period divided by steady state precursor enrichment, multiplied by 100 (to express the rate as %/time). For example, if product enrichment was changed from 0.01 at time=0 hour (t1) to 0.05 at time=4 hour (t1) (thus, a change in product enrichment=0.05−0.01=0.04) with a steady state precursor enrichment of 0.10 from t1 and t2. Then fractional synthesis rate (FSR) of the polymer can be calculated as [0.04/(0.10×4)]×100=10%/h, which means that 10% of the pool size was newly synthesized over 1 hour. This value actually does not provide absolute synthesis rate. To obtain the absolute rate of polymer synthesis, the FSR must be multiplied by the pool size. For an example of plasma TAG with assumptions of effective volume of distribution of TAG (i.e., plasma volume) being 3 L and TAG concentration being 100 mg/dL (or 1 g/L), the pool size is 3 g of plasma TAG (i.e., 100 mg/dL×3 L=3 g). If we use the same FSR (i.e., 10%/h, shown above) and the pool size of 3 g, then absolute rate of TAG synthesis will be 300 mg TAG/h (i.e., 3 g×10%/h). Fig. 6A shows the principles of how the tracer incorporation model works: precursor enrichment is at isotopic equilibrium (Ep) and product is being labeled at a constant rate. As time goes, product enrichment will rise and then plateaued where enrichments of precursor and products become equal, the fractional synthetic rate can be calculated before this happens (Fig. 6B). Fig. 6C represents the time course changes in enrichments of precursor and product between 2 time points (t1 and t2) where tissues (e.g., plasma) are typically harvested to measure changes in product enrichment and precursor enrichments for quantification of TAG FSR. The FSR term is also used in determining various polymers such as protein (from amino acids),1418192027 glucose (from 2 trioses),2829 DNA (from bases),2830 RNA (from bases),3132 and so on. In the following section, we will show flux calculation of selected variables of lipid kinetics using stable isotope tracer methodology and mass spectrometry.
Fig. 6
Schematic principle of the tracer incorporation model of assessing in vivo metabolic flux rate. At an initial time period of isotopic steady state (A), both labeled and unlabeled precursors enter a synthetic pathway in proportion to their relative ratio (1:1 in this case) and enrichment of the product rises at a constant rate. However, as time goes to infinity, product enrichment ultimately reaches precursor enrichment (B). Both conditions (A, B) are described with respect to changes in enrichment of precursor and product while tissue samples are collected somewhere between these 2 (C). Fractional synthesis rate (FSR, %/time), defined as percent of pool size that has been newly synthesized for a given time, can be estimated by dividing changes in product enrichment by steady state precursor enrichment and time, multiplied by 100. To derive absolute synthesis rates, FSR needs to be multiplied by pool size. Same principle can be used for assessing synthesis of lipids such as rates of de novo lipogenesis and TAG synthesis.
FSR, fractional synthesis rate; TAG, triacylglycerol; TTR, tracer to tracee ratio.
CALCULATIONS OF LIPID KINETICS IN VIVO USING STABLE ISOTOPE TRACER
In the followings, we will briefly discuss how to calculate selected in vivo lipid kinetics of major lipid metabolic pathways as shown in Fig. 3 using stable isotope tracer methodology and mass spectrometry. Although not covered due to the space limitation and the intent of the review, assessments of other lipids such as cholesterol rely on the same principles.
1. Assessment of lipolysis
Mostly stored in adipose tissue, TAG is constantly broken down into FFA and glycerol in 3:1 stoichiometric ratio in a process of lipolysis via a series of enzymes including adipose triglyceride lipase (ATGL). Glycerol appears in the circulation at a rate in parallel with rate of lipolysis. Glycerol derived as the result of lipolysis does not participate in an esterification process in the adipose tissue. Glycerol kinase, an enzyme required to convert glycerol to glycerol phosphate, is absent from adipose tissue. Glycerol phosphate is the activated form of glycerol that forms the backbone of TAG and is thus essential for re-esterification. Thus, Ra glycerol reflects lipolysis and is the best proxy for lipolysis.253334 To determine Ra glycerol, a glycerol tracer (e.g., [1,1,2,3,3-2H5]glycerol) is primed constantly infused intravenously (e.g., prime, 1 μmol/kg and F, 0.08 μmol/kg/min). Blood samples are collected before the tracer infusion for determining background enrichment and after achieving Ep. Enrichment is typically determined with use of GC-MS or LC-MS. If we assumed Ep to be 0.05, Ra glycerol is calculated to be 1.6 μmol/kg/min as the result of F divided by Ep (0.08 μmol/kg/min÷0.05=1.6 μmol/kg/min). In a steady state, Ra glycerol is equal to Rd glycerol (i.e., 1.6 μmol/kg/min).
2. Assessment of Ra FFA
FFA that are released as a result of lipolysis can either appear in the circulation at a varying rate, called Ra FFA, or may be re-esterified back to TAG by combining with glycerol phosphate. Thus, while Ra FFA is related to the rate of lipolysis, it is not a quantitative reflection of lipolysis. To assess Ra FFA, a representative tracer (e.g., [1-13C]palmitate, labeled with carbon 13 at 1 carbon position) can be infused intravenously into the circulation at a constant rate, F (e.g., 0.04 μmol/kg/min). Blood samples are collected before the tracer infusion and after achieving Ep. A priming is not required to reach an equilibrium with a palmitate tracer due to its fast turnover rate.35 If we assume Ep to be 0.04, Ra palmitate is then calculated by dividing F by Ep: 0.04 μmol/kg/min÷0.04=1 μmol/kg/min. Palmitate is not the only source of fatty acid but one species among many fatty acids. Thus, to account for contribution from other fatty acid species, Ra palmitate can be divided by its FC (assumed to be 0.65 or 65%) to estimate Ra FFA. Thus, Ra FFA can be calculated to be 1.54 μmol/kg/min as the result of Ra palmitate of 1 μmol/kg/min divided by its FC of 0.65.
3. Assessment of FFA oxidation rate
FFA that has appeared in the circulation can either be taken up by tissues such as muscle, where it is completely oxidized into CO2 in the process of mitochondrial oxidation, or re-esterified into TAG in tissues other than adipose tissue mostly in liver, called extracellular cycling. Determination of the FFA oxidation rate is based on the incorporation of carbon from FFA to CO2. To trace CO2 formation derived from oxidation of FFA and thus quantify the rate of FFA oxidation, carbon-13 labeled fatty acid tracer (e.g., [1-13C]palmitate) can be used with which Ra palmitate (and ultimately Ra FFA) can be simultaneously determined as shown above. For example, [1-13C]palmitate can be intravenously infused at a constant rate (e.g., F, 0.04 μmol/kg/min). In order to estimate the FFA oxidation rate, 4 distinct values must be determined: 1) Rd FFA (=Ra FFA in a steady state), 2) carbon dioxide production rate (VCO2/kg/min), determined via indirect calorimetry, 3) breath CO2 enrichment (i.e., ratio of 13CO2 of 12CO2), determined by isotope ratio mass spectrometry, 4) % of FFA uptake that enters mitochondrial oxidation, determined as ratio of 13CO2 excretion rate (VCO2×breath CO2 enrichment) to infusion rate of 13C unit of palmitate tracer. In addition, account must be taken of the fraction of the carbon label that is lost via isotopic exchange in the TCA cycle. For simplicity, however, we assumed that 13CO2 produced from the labeled palmitate as the result of mitochondrial oxidation is completely recovered in the breath, and thus the recovery correction factor (CF) is 1. The equation for estimating rate of FFA oxidation is as follows: (% of FFA uptake oxidized×Rd FFA)÷CF. Using the following data, we will show how to calculate FFA oxidation rate: 1) Rd FFA of 1.54 μmol/kg/min, 2) 13CO2 enrichment of 0.0002, 3) VCO2 of 100 μmol/kg/min, 4) F of 13C unit from [1-13C]palmitate of 0.04 μmol/kg/min, and 5) CF of 1 (full recovery). Then, rate of FFA oxidation =[(0.0002×100)÷(0.04÷1)]×1.54 μmol/kg/min=0.77 μmol/kg/min.
4. Assessment of TAG-fatty acid substrate cycling rate
TAG-fatty acid substrate cycling has 2 components: 1) intracellular cycling and 2) extracellular cycling. As stated above, FFA resulting from lipolysis in adipose tissue can either be released into the circulation (Ra FFA) or re-esterified back to TAG, the process being called “intracellular cycling”.253436 FFA that appears in the circulation (i.e., Ra FFA), on the other hand, can be either completely oxidized into CO2 in the process of mitochondrial oxidation in tissues such as muscle or re-esterified into TAG in tissues other than adipose tissue, mostly in liver. The later process is called extracellular cycling.2534 These cycling rates can then be determined based on the information provided above (i.e., Ra FFA, Ra glycerol, FFA oxidation rate). Intracellular cycling rate is calculated as (3×Ra glycerol)−Ra FFA, later of which is predicated on the fact that 3: 1 stoichiometric relation exists between FFA and glycerol derived as the result of lipolysis. The extracellular cycling rate is calculated as Ra FFA – FFA oxidation rate, and the total cycling rate is sum of the these 2 (i.e., intracellular cycling and extracellular cycling) which is calculated as [(3×Ra glycerol)−Ra FFA]+[Ra FFA−FFA oxidation rate]=(3×Ra glycerol)−FFA oxidation rate. Using values shown above for each component, we can calculate intracellular cycling rate [(3×Ra glycerol)−Ra FFA = 3.26 μmol/kg/min], extracellular cycling rate (Ra FFA−FFA oxidation rate=0.77 μmol/kg/min), and total cycling rate [(3×Ra glycerol)−FFA oxidation rate=4.03 μmol/kg/min].
5. Assessment of VLDL-TAG synthesis rate
VLDL-TAG synthesis is a large fraction of the extracellular recycling, regulation of which is implicated in clinical conditions such as cardiovascular events.3738 The first step in determining the VLDL-TAG synthesis rate (and subsequent VLDL-TAG secretion rate) is to determine VLDL-TAG FSR. Several tracers can be used for assessing FSR of VLDL-TAG, including palmitate,39 acetate,40 glycerol34 and even deuterium oxide.41 Here we will discuss the calculation of VLDL-TG FSR again using [1-13C]palmitate. As stated above, FSR is calculated as changes in product enrichment divided by precursor enrichment and time, multiplied by 100 (to express it as %/time).24 For example, if plasma palmitate enrichment achieved at isotopic steady state (i.e., Ep) is 0.04 above background, and changes in enrichment of palmitate derived from plasma VLDL-TAG (i.e., product enrichment) elapsed over an experimental time period (e.g., 3 hours) is 0.03, then VLDL-TAG FSR is calculated to be 0.03÷(0.04×3 hours)=0.25/h (or 25%/h). This means that 25% of plasma VLDL-TAG pool is newly synthesized per hour. To obtain an absolute synthesis rate of VLDL-TAG, FSR (i.e., 0.25) needs to be multiplied by the pool size (VLDL-TAG concentrations x volume of distribution). If the TAG concentration is assumed to be 100 mg/dL and the volume of distribution of VLDL-TAG is 3 L, then calculation of absolute VLDL-TAG synthesis rate is as follows: 0.25/h×100 mg/dL×3 L=750 mg/h.
OTHER CONSIDERATIONS AND LIMITATIONS
Despite the beauty of assessing in vivo dynamics with stable isotope tracer methodology, some considerations or limitations are worth to mention. First, stable isotope tracer methodology in human study is largely limited to the assessments of in vivo kinetics at whole body level (but not at tissue or organ levels) as tissues other than blood, such as often muscle and adipose tissue, is usually not available. Thus, assessment of tissue specific kinetics is typically limited unless invasive catheterizations for arteriovenous balance technique and tissue biopsy are available with an accurate assessment of tissue/organ blood flow measurement.25 Second, the use of tracer methodology requires a number of assumptions to be satisfied to guarantee the accuracy of the kinetics. For example, it is generally assumed and valid that body cannot distinguish between tracer and tracee (called “indistinguishability”), which enables accurate tracing of the movement of the tracee.2542 Although such discrimination (i.e., isotope effect) has been reported, particularly in case of using isotope tracers labeled with heavier hydrogen such as deuterium, the reported isotope effects were due largely or entirely to tracer contamination or mathematical modeling errors.25 For other assumptions which vary dependent on specific tracer models employed, readers need to consult with the more comprehensive reference.2542
SUMMARY AND CONCLUSIONS
Lipids such as TAG, fatty acids, and cholesterol are not in a static state, but in a dynamic state of constant turnover with varying rates depending on a variety of factors including physiological status, species of lipids, and the particular pool of interest. The turnover of lipids enables the maintenance of a dynamic homeostasis. Dysregulation of lipid turnover can lead to clinical conditions such as dyslipidemia, NAFLD, obesity, and related clinical conditions. The significance of “static” measurements obtained by means of molecular and “omics” tools are better understood in the context of the dynamic turnover of the lipid pools. The development and testing of the efficacy of therapeutic approaches (e.g., exercise, nutrition, and/or drugs) is best accomplished by quantification of the dynamics of lipid metabolism in health and disease.
 XML Download