

 PDF
PDF ePub
ePub Citation
 Print
Print


Abstract
Purpose
To investigate the effect of a visual field (VF) test on intraocular pressure (IOP) and relevant parameters in a normal group and an open-angle glaucoma group, and to determine the appropriate time of IOP measurements.
Methods
The IOP was measured by a rebound tonometer before and after a VF test for the normal, normal-tension glaucoma, and high-tension glaucoma groups, and IOP differences after the VF tests were compared among groups. Parameters including age, sex, axial length, central corneal thickness, IOP before the VF test, the VF index, mean deviation, VF test duration, and usage of IOP lowering medications were investigated, and the correlations of these parameters with IOP changes after VF tests were determined using linear regression analyses.
Results
A total of 232 participants (232 eyes) included 55 normal subjects, 131 normal-tension glaucoma patients, and 46 high-tension glaucoma patients. The IOP differences after VF tests were not statistically significant in the normal and high-tension glaucoma groups, and the difference was 0.31 mmHg in the normal-tension glaucoma group (p = 0.013). Multivariate regression analyses revealed that axial length (p = 0.005) and IOP before the VF test (p < 0.001) were relevant factors in the total number of patients, and the axial length (p = 0.017), IOP before the VF test (p = 0.001), and duration (p = 0.029) were found to be significantly associated with IOP differences in the normal-tension glaucoma group.
Figures and Tables
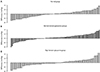 | Figure 1The distribution of intraocular pressure (IOP) changes after visual field test. Normal group (A) and high tension glaucoma group (C) show similar distribution between patients with increased and decreased IOP after visual field test, but normal tension glaucoma group showed high concentration of patients with increased IOP (B).
|
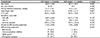
Table 1
The comparison of characteristics between normal subject group, normal tension glaucoma group, and high tension glaucoma group

Values are presented as mean ± standard deviation or number (%) unless otherwise indicated.
NTG = normal tension glaucoma group; HTG = high tension glaucoma group; IOP = intraocular pressure; Nl = normal group; CCT = central corneal thickness; MD = mean deviation; VFI = visual field index.
*Bonferroni method; †one-way analysis of variance; ‡chi-square test.
![]()
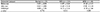
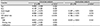
Table 3
Univariate and multivariate regression analyses for intraocular pressure differences after visual field test in total subjects
![]()
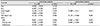
Table 4
Univariate and multivariate regression analyses for intraocular pressure differences after visual field test in the normal tension glaucoma group
![]()
Notes
This study was presented as a poster at the 115th Annual Meeting of the Korean Ophthalmological Society 2016.
References
1. Jamal KN, Gürses-Özden R, Liebmann JM, Ritch R. Attempted eyelid closure affects intraocular pressure measurement in open-angle glaucoma patients. Am J Ophthalmol. 2002; 134:186–189.


2. Rota-Bartelink AM, Pitt A, Story I. Influence of diurnal variation on the intraocular pressure measurement of treated primary open-angle glaucoma during office hours. J Glaucoma. 1996; 5:410–415.
3. Whitacre MM, Stein R. Sources of error with use of Goldmann-type tonometers. Surv Ophthalmol. 1993; 38:1–30.
4. Sudesh S, Moseley MJ, Thompson JR. Accuracy of Goldmann tonometry in clinical practice. Acta Ophthalmol (Copenh). 1993; 71:185–188.
5. Ni N, Tsai JC, Shields MB, Loewen NA. Elevation of intraocular pressure in glaucoma patients after automated visual field testing. J Glaucoma. 2012; 21:590–595.

6. Martin L. Intraocular pressure before and after visual field examination. Eye (Lond). 2007; 21:1479–1481.
7. Sawada A, Yamada H, Yamamoto Y, Yamamoto T. Intraocular pressure alterations after visual field testing. Jpn J Ophthalmol. 2014; 58:429–434.
8. Recupero SM, Contestabile MT, Taverniti L, et al. Open-angle glaucoma: variations in the intraocular pressure after visual field examination. J Glaucoma. 2003; 12:114–118.
9. Rebolleda G, Rodríguez-Villace C, Anton MV, Muñoz-Negrete FJ. Variations in intraocular pressure after visual field examination. J Glaucoma. 2004; 13:178–179.
10. Lee CM, Yoo YC. Short-term effect of standard automated perimetry testing on intraocular pressure in patients with open-angle glaucoma. ISRN Ophthalmol. 2013; 2013:956504.
11. Salim S, Du H, Wan J. Comparison of intraocular pressure measurements and assessment of intraobserver and interobserver reproducibility with the portable ICare rebound tonometer and Goldmann applanation tonometer in glaucoma patients. J Glaucoma. 2013; 22:325–329.
12. Kim KN, Jeoung JW, Park KH, et al. Comparison of the new rebound tonometer with Goldmann applanation tonometer in a clinical setting. Acta Ophthalmol. 2013; 91:e392–e396.
13. Schweier C, Hanson JV, Funk J, Töteberg-Harms M. Repeatability of intraocular pressure measurements with Icare PRO rebound, Tono-Pen AVIA, and Goldmann tonometers in sitting and reclining positions. BMC Ophthalmol. 2013; 13:44.
14. Mauger RR, Likens CP, Applebaum M. Effects of accommodation and repeated applanation tonometry on intraocular pressure. Am J Optom Physiol Opt. 1984; 61:28–30.
15. Erb C, Brody S, Rau H. Effect of mental and physical stress on intraocular pressure--a pilot study. Klin Monbl Augenheilkd. 1998; 212:270–274.
16. Brusini P, Salvetat ML, Zeppieri M, et al. Comparison of ICare tonometer with Goldmann applanation tonometer in glaucoma patients. J Glaucoma. 2006; 15:213–217.
17. Martinez-de-la-Casa JM, Garcia-Feijoo J, Vico E, et al. Effect of corneal thickness on dynamic contour, rebound, and Goldmann tonometry. Ophthalmology. 2006; 113:2156–2162.
18. Sahin A, Basmak H, Niyaz L, Yildirim N. Reproducibility and tolerability of the ICare rebound tonometer in school children. J Glaucoma. 2007; 16:185–188.
19. Van der Jagt LH, Jansonius NM. Three portable tonometers, the TGDc-01, the ICARE and the Tonopen XL, compared with each other and with Goldmann applanation tonometry. Ophthalmic Physiol Opt. 2005; 25:429–435.
 XML Download