

 PDF
PDF ePub
ePub Citation
 Print
Print


Abstract
Purpose
Methods
Results
Figures and Tables
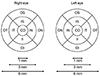 | Figure 1Early treatment of diabetic retinopathy study subfield. Sector 1: C0, Sector 2: IS, Sector 3: IN, Sector 4: II, Sector 5: IT, Sector 6: OS, Sector 7: ON, Sector 8: OI, Sector 9: OT. C0 = central fovea; IS = inner superior; IN = inner nasal; II = inner inferior; IT = inner temporal; OS = outer superior; ON = outer nasal; OI = outer inferior; OT = outer temporal.
|
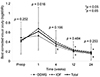 | Figure 2Preoperative and postoperative best corrected cisual acuity (BCVA, logMAR). BCVA in the DDMS groups were improved at postoperative 4 weeks, but BCVA in the IOF groups were deteriotating until postoperative 4 weeks and then improved at 12 weeks after surgery. LogMAR = logarithm of minimal angle of resolution; DDMS = diamond dusted membrane scraper; IOF = intraocular forcep. *,†p-value were analyzed by Wilcoxon singed rank test. Each postoperative BCVA were compared with preoperative BCVA.
|
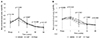 | Figure 3Preoperative and postoperative best corrected cisual acuity (logMAR) by combined cataract surgery. (A) Patients of phakic eyes, vitrectomy combined cataract surgery. (B) Patients of pseudophakic eyes, only vitrectomy. p-value were analyzed by Mann-Whitney U test. DDMS = diamond dusted membrane scraper; IOF = intraocular forcep.
|
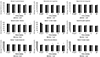 | Figure 4Average retinal thickness of early treatment of diabetic retinopathy study subfield (ETDRS) 9 sectors at preoperative and postoperative time. Preoperative mean retinal thickness was not significantly different between the two groups in all sectors of ETDRS. The averge retinal thickness in the sector 4 (inferior) was significantly lower in the diamond dusted membrane scraper (DDMS) group than in the intraocular forcep (IOF) group after 12 and 24 weeks postoperatively. The average retinal thickness at 4, 12, and 24 weeks after surgery was significantly lower in the DDMS group than in the IOF group. IOP = intraocular pressure. *p-value were analyzed by Mann Whitney U test. Each mean retinal thickness were compared DDMS group with IOF group.
|
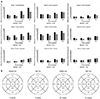 | Figure 5Difference of average retinal thckness of early treatment of diabetic retinopathy study subfield (ETDRS) 9 sectors compared preoperative time with each postoperative time. (A) The diamond dusted membrane scraper group showed more decrease than the intraocular forcep group in sector 1, 2, 3, 4, 5 and 6 postoperatively, but not significant statistically. (B) At 4, 12 weeks postoperatively, changes in retinal thickness were presented as a percentage of the ETDRS area. DDMS = diamond dusted membrane scraper; IOP = intraocular pressure; IOF = intraocular forcep.
|
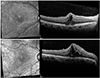 | Figure 6Postoperative optical coherence tomography finding of cystoid macular edema. (A) After 6 weeks, cystoid macular edema was developed in the diamond dusted membrane scraper groups. (B) After 6 weeks, cystoid macular edema was developed in the intraocular forcep groups.
|
Table 1
Demographics and other baseline characteristics of each group with ERM
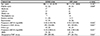
Values are presented as mean ± standard deviation or number (%) in student t-test and median (inter quartile range; Q1–Q3) in Mann-Whitney U test unless otherwise indicated.
ERM = epiretinal membrane; DDMS = diamond dusted membrane scraper; IOF = intraocular forcep; BCVA = best corrected visual acuity; logMAR = logarithm of minimal angle of resolution; CMT = central macular thickness.
*Student t-test; †χ2 test; ‡Mann-Whitney U test.
![]()
Table 2
Comparison of best corrected visual acuity (logMAR) according to surgery
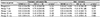
Values are presented as median (inter quartile range; Q1–Q3) unless otherwise indicated.
logMAR = logarithm of minimal angle of resolution; Op. = operation; DDMS = diamond dusted membrane scraper; IOF = intraocular forcep; Postop. = postoperative; wk(s) = week(s).
*p-value were calculated using Mann-Whitney U test.
![]()

 XML Download