

 PDF
PDF ePub
ePub Citation
 Print
Print


Abstract
Purpose
Methods
Results
Figures and Tables
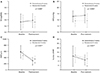 | Figure 1Changes in parameters of both groups after injection. (A) Visual acuity. (B) Intraocular pressure. (C) Spectral domain optical coherence tomography (SD-OCT) measurements of central macular thickness. (D) SD-OCT measurements of total number of hyperreflective foci. VA = visual acuity; logMAR = the log of the minimum angle resolution; IOP = intraocular pressure; CMT = central macular thickness; HRF = hyperreflective foci. *Categorical variables compared pre-treatment and post-treatment delta values of each parameter between bevacizumab group and dexamethasone group, using the independent t-test.
|
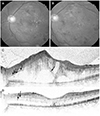 | Figure 2A 27-year-old male presented with diabetic macular edema injected dexamethasone implant. (A) Fundus photography at initial visit. Yellowish fibrinous materials are seen at the parafoveal area. The visual acuity is 20/200. (B) Fundus photography at eight weeks follow up. Yellowish fibrinous materials are much decreased. The visual acuity is 20/100. (C) Horizontal sectional image of optical coherence tomography (OCT) images at initial visit. The OCT shows sparse hyperreflective foci (arrows) distribution in the inner, outer and subretinal layers. Also subretinal fluid (SRF) is seen. (D) Horizontal sectional image of OCT images at eight weeks follow up. Hyperreflective foci are almost resolved and just small numbers (arrows) of hyperreflective foci remained. SRF is also nearly resolved.
|
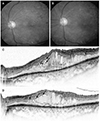 | Figure 3A 57-year-old male presented with diabetic macular edema injected bevacizumab. (A) Fundus photography at initial visit. Retinal dot hemorrhages are seen at four quadrants. The visual acuity is 20/70. (B) Fundus photography at 4 weeks follow up. Previously seen retinal dot hemorrhages are much decreased. The visual acuity is 20/40. (C) Horizontal sectional image of optical coherence tomography (OCT) images at initial visit. The OCT shows sparse hyperreflective foci (arrows) distribution in the all retinal layers. (D) Horizontal sectional image of OCT images at four weeks follow up. Numbers of hyperreflective foci are decreased.
|
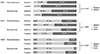 | Figure 4Comparison of changes in parameters of both groups after injection. Subretinal fluid, external limiting membrane, inner segment-outer segment junction changes after dexamethasone implant and injection groups for follow up eight and four weeks. SRF = subretinal fluid; ELM = external limiting membrane; ISOS = inner segment/outer segment. *Categorical variables compared pre-treatment and post-treatment delta values of each parameter between bevacizumab group and dexamethasone group, using the Fisher's exact test, and continuous variables with the independent t-test.
|
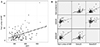 | Figure 5Correlation of pretreatment total number of hyperreflective foci and other parameters. (A) Correlation of central macular thickness and total number of hyperreflective foci before treatment in all patients of both groups. Central macular thickness and total number of hyperreflective foci showed weak positive correlation (p = 0.029, r = 0.189). (B) Change in visual acuity before and after treatment and total number of hyperreflective foci showed weak positive correlation (p = 0.014, r = 0.300). Change in central macular thickness before and after treatment and total number of hyperreflective foci showed weak positive correlation (p = 0.017, r = 0.293). Change in visual acuity before and after treatment and change in central macular thickness before and after treatment foci showed weak positive correlation (p = 0.030, r = 0.268). All correlations were analyzed with Spearman rank correlation. CMT = central macular thickness; HRF = hyperreflective foci; Delta VA = Change in visual acuity before and after treatment; Delta CMT = change in central macular thickness before and after treatment.
|
Table 1
Basic characteristics according to treatment group
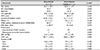
Values are presented as mean ± standard deviation or number (%) unless otherwise indicated.
VA = visual acuity; logMAR = the log of the minimum angle resolution; HTN = hypertension; DMR = diabetic retinopathy; NPDR = non proliferative diabetic retinopathy; PDR = proliferative diabetic retinopathy; PRP = panretinal photocoagulation; VEGF = vascular endothelial growth factor; IOP = intraocular pressure; CMT = central macular thickness; HF = hyperreflective foci.
*Categorical variables compared using the chi-square test, and continuous variables with the independent t-test.
![]()
Table 2
Comparison of clinical parameters at pre and post-injection between groups
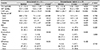
Values are presented as mean ± standard deviation or number (%).
VA = visual acuity; logMAR = the log of the minimum angle resolution; IOP = intraocular pressure; CMT = central macular thickness; HF = hyperreflective foci; SRF = subretinal fluid; ELM = external limiting membrane; EZ = ellipsoid zone.
*Categorical variables compared using the McNemar-Bowker test, and continuous variables with the paired t-test; †categorical variables compared pre-treatment and post-treatment delta values of each parameter between bevacizumab group and dexamethasone group, using the Fisher's exact test, and continuous variables with the independent t-test.
![]()
 XML Download