

 PDF
PDF ePub
ePub Citation
 Print
Print


Introduction
Since the late 1970s, computed tomography (CT) has been widely used for radiotherapy planning with the advantages of improved patient positioning, target delineation, treatment beam arrangement, and dose calculation.123) Unlike a diagnostic CT scanner, a wide bore (>80 cm) scanner is generally used for CT simulations. This is largely to accommodate extremely large patients, breast cancer patients for whom the ipsilateral arm is subtended to approximately 90°, and patients with specialized immobilization devices.45) Furthermore, a flat-bed couch and moving laser system are required for treatment simulation.5) Notably, the characteristics and performance of a radiation oncology-dedicated CT scanner should be validated in advance of patients' CT simulations to ensure accuracy.56)
According to the American College of Radiology (ACR) CT accreditation program, a submission of clinical and phantom images, dose measurements and scanning protocols is mandatory for any institution using CT devices in the United States.7) Image qualities such as CT number accuracy, low-contrast resolution, image uniformity, and volume CT dose index (CTDIvol) are assessed in the accreditation process. The acceptance criteria for CTDIvol are 80 mGy and 30 mGy for adult head and abdominal scans, respectively.7) In Europe, a reference level of 60 mGy for weighted CTDI was proposed for a routine head protocol.8) A similar accreditation program is performed in South Korea by the Korean Institute for Accreditation of Medical Imaging (KIAMI). For this program, spatial resolution, low contrast resolution, linearity, image noise, and the presence of artifacts are evaluated along with CTDI for each plug position.9) The CTDI acceptance criterion for each plug position is much stricter in South Korea than those stated by international guidelines. Although CTDIvol does not imply the actual patient dose,1011) CTDIvol can be used for the verification and monitoring of imaging doses.789) Although several studies insist that noise is the primary variable affecting image quality and diagnostic performance,1213) other quality indices should also be examined for CT scanner assessment.514)
Recently, two CT simulators were newly installed in our institute. The aim of this study was thus to evaluate the image quality and radiation dose of these CT simulators, and to ensure their clinical acceptance for use in radiotherapy planning.
Materials and Methods
Two Brilliance CT Big Bore (Philips Medical System, Cleveland, OH, USA) systems were newly installed in our institute for CT simulation for radiotherapy. The accreditation procedures were performed by the KIAMI during the acceptance testing stage of the CT simulators.
1. Scan parameters and computed tomography dose index
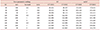
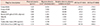
The scan parameters were evaluated to confirm whether the kV and mAs set by users are appropriately and accurately delivered by the CT simulators. An Xi R/F detector (Unfors RaySafe AB, Billdal, Sweden) capable of measuring tube potential, dose, dose rate, pulse, pulse rate, dose/frame, time, half-value layer, and total filtration simultaneously was used for this purpose. Scan parameters are listed in Table 1, and the tolerance limits for the measurements were ±7% and ±10% for kVp and mAs, respectively. CTDI was measured with dedicated a head and body CTDI phantom (Fluke Corporation, Everett, WA, USA). An Xi CT detector (Unfors RaySafe AB) and a black piranha Quality Assurance (QA) meter (RTI Electronics AB, Moelndal, Sweden) were used. CTDIs for each plug position were evaluated as to whether the measurement was within the acceptable range (Table 2).
2. Image quality
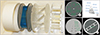
A modular 76-410 AAPM CT Performance Phantom (Fluke Corporation; Fig. 1a) was scanned to evaluate image quality. The phantom contained a contrast test object, a CT number linearity insert, a resolution insert, and a slice thickness insert. The phantom was scanned with 120 kVp, 250 mAs, and a slice thickness of 10 mm, and was reconstructed with a standard reconstruction algorithm. The Hounsfield unit (HU) of water, noise level, homogeneity, presence of artifacts, spatial resolution, contrast, and slice thickness were evaluated in the reconstructed images. The mean and standard deviation of 4×4 cm2 regions of interest (ROI) drawn in water were defined as the HU of water and noise level, respectively. The HU of water should be between −7 HU and 7 HU, and the noise level should be less than 7 HU. Homogeneity was calculated as the standard deviation of HU for 4 ROIs and should be less than 5 HU. The existence of artifacts was subjectively evaluated by determining if reviewers could identify any visible artifacts. In the image of the spatial resolution insert (Fig. 1c) where eight sets of five air-filled holes are imaged (with diameters of 1.75, 1.5, 1.25, 1.00, 0.75, 0.61, 0.5, and 0.4 mm), reviewers should be able to discern all five holes of each set at least 1.00 mm diameter in order to pass the spatial resolution test. Six pairs of the low contrast inserts (Fig. 1d) with diameters of 25.4, 19.1, 12.7, 9.5, 6.4, and 3.2 mm were filled with dextrose or sodium chloride solutions of various densities with 2%–3% differentials in density between cavities. Reviewers must be able to identify the two 6.4 mm spheres in the image in order to pass the low contrast resolution test. The slice thickness as determined by measuring the distance of the aluminum strips should be accurate within ±1 mm to pass the slice thickness test (Fig. 1e). Complete assessments were performed independently by two KIAMI-trained reviewers.
3. Hounsfield unit curves and laser position
An electron density phantom (Model 62M; CIRS Inc., Norfolk, VA, USA) was used to acquire the HU value corresponding to each tissue-equivalent insert. The phantom was scanned with a body scan protocol of 120 kVp, 213 mAs, and 2 mm slice thickness. The acquired HU to electron density curve and the acquired HU to physical density curve were imported to the treatment planning system for dose calculation.
A DORADOnova 3 laser system (LAP GmbH Laser Applications, Lüneburg, Germany) along with a CARINAnav smart control system (LAP GmbH Laser Applications) for patient alignment were installed. A Wilke phantom was aligned using the DORADOnova 3 laser system, and scanned with 120 kV, 200 mAs, and a slice thickness of 1.25 mm. The accuracy of the laser system was analyzed using the tumorLOC program (Philips Medical System).
Results
1. Verification of scan parameters and computed tomography dose index
The scan parameters set by users were correctly measured, showing average discrepancies of −1.28% and −1.67% in kV, and −0.39% and −1.06% in mAs, for the first CT simulator (CT SIM1) and the second CT simulator (CT SIM2), respectively. As shown in Table 1, the results of the scan parameter verification were tolerable for both CT simulators as they were within the tolerance levels of ±7% and ±10% for kVp and mAs, respectively. The CTDI measurements are provided in Table 2. The head and body CTDIs for each chamber position were all within the tolerance limit for both CT simulators.
2. Image quality
As shown in Fig. 1b, the HU of water, the noise level, and the homogeneity were −0.2 HU, 4.9 HU, and 0.69 HU, respectively, for CT SIM1. These parameters for CT SIM2 were 1.9 HU, 4.9 HU, and 0.70 HU, respectively. All reviewers agreed that there were no visible artifacts as shown in Fig. 1b. Five air-filled holes with a diameter of 1.00 mm and a low contrast object with a diameter of 6.4 mm were clearly discernible for both CT simulators as shown in Fig. 1c, d, respectively. Thus, the CT simulators passed the spatial resolution assessment. The slice thicknesses for the aluminum strip were 8.9 mm and 9.1 mm, for CT SIM1 and CT SIM2, respectively. All testing parameters were within the required tolerance level (Fig. 1e).
3. Hounsfield unit curves and verification of laser position
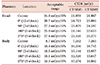
The phantom manufacturer provided the physical density as well as the electron density for the designated materials. The average HU values for each ROI according to the material were comparable for both scanners. A relatively large HU difference for the lung inhale insert (3.2 HU) and at the trabecular bone insert (3.3 HU) was observed, and the complete results are summarized in Table 3. The average of HU values corresponding to each relative electron density (RED) were imported into the treatment planning system. The laser position was verified in three directions as shown in Fig. 2. The difference between the laser position and the groove center shown in the images was less than 0.1 mm for both scanners.
Discussion
The accreditation procedure for the newly installed CT simulators was performed by reviewers in KIAMI. All test items were identified as acceptable for both scanners. CTDI is often not recommended as a surrogate for patient doses as it does not consider an actual body size or composition.1011151617) Despite this, CTDI measurement is crucial because it is applied when estimating a more precise dose estimate such as size-specific dose estimates.1617) As mentioned above, the tolerance levels for CTDIvol suggested by the ACR accreditation program are 80 mGy and 30 mGy for a head and a body phantom, respectively. By applying the CTDIvol=1/3×CTDIcenter+2/3×CTDIperiphery formula, the CTDIsvol in KIAMI were 35.73 mGy and 19.96 mGy for a head and a body phantom, respectively. In our head phantom measurements, the measured CTDIsvol were 22.26 mGy and 23.70 mGy for CT SIM1 and CT SIM2, respectively. Furthermore, for body phantom measurements, the CTDIsvol were 12.30 mGy and 12.99 mGy for CT SIM1 and CT SIM2, respectively. All measurements were within strict tolerance levels.
HU uniformity, noise level, and homogeneity were also within required tolerance levels. The acceptance criteria for noise level provided by KIAMI changed from 8 HU to 7 HU in 2007. Noise level is known to dominate overall image quality, thus the detectability of a lesion is mainly affected by noise level.1819) According to existing literature regarding image quality in multiple CT scanners, higher noise levels resulted in lower contrast-to-noise ratio.914) Therefore, the application of stricter criteria for noise level is reasonable.
A CT calibration curve—that is, the relationship between HU values and their corresponding RED—is necessary in dose calculations as megavoltage photon beams interact primarily with Compton scattering.320) Although CT numbers are defined as being proportional to the linear attenuation coefficient, individual scanners exhibit inaccuracies.621) Therefore, the HU corresponding to each material should be measured for a given scanner, which is generally established during the commissioning stage.6) Notably, the consistency of HU for a given tissue should be monitored because changes in HU will result in changes in dose distribution.622) Typically, HU value changes of ±20 HU for soft tissue and ±50 HU for lung and bone are known to lead to 1% changes in dose distribution.22) The two newly installed CT simulators showed consistent HU values showing a maximum difference of 3.3 HU. Since this difference is negligible when considering the tolerance for HU consistency, a single CT calibration curve by averaging two HUs was applied in the treatment planning system.
In short, installation, acceptance testing, and commissioning of the new CT simulators were performed. Although the acceptance testing and commissioning of the CT simulators were tolerable, periodic quality assurance should be performed by medical physicists.56) The overall system should be appropriately monitored to rigorously maintain the CT simulators in the radiation oncology department.

 XML Download