

 PDF
PDF ePub
ePub Citation
 Print
Print


Introduction
Volumetric modulated arc therapy (VMAT) is in common worldwide use as a novel radiation therapy technique that delivers the radiation dose continually as the treatment machine rotates to achieve highly conformal dose distributions with improved target volume coverage and the sparing of normal tissues. This technique is characterized by many machine-related factors, including the individual multileaf collimator (MLC) leaf movement, dose rate change, continuous gantry rotation, collimator angle, and others. The highly complex delivery technique necessitates the verification of the VMAT plan delivery accuracy before the treatment starts. This type of verification is commonly carried out for patient-specific treatment plans and not in regular machine quality assurance (QA) schemes.
In plan verification, the error reflects the integrated information from all possible error sources over the full arc, but does not specify the source of the error. In other words, it does not tell us which of the aforementioned machine factors caused the error and how the errors were generated. For example, we do not know which moment during the treatment or which gantry angle imposed the worst effects on the overall delivery error. If we can split the arc into component parts, we could potentially backtrack the error sources and thus reach the best solution, especially when the error does not meet the acceptance level for successful VMAT plan delivery. To the best of our knowledge, there is no commercial solution for this type of compositional analysis in clinical practice. More importantly, it can be inefficient and impractical to perform this type of analysis on every patient plan.
It is unfortunate that the technical advances pertaining to the compositional analysis of sources of dosimetric errors are far from adequate. Some studies123456) investigated the error of the linear accelerator (LINAC) as a function of time, which corresponds to particular angle of gantry rotation of the VMAT treatment plan delivery. These studies targeted the pretreatment or post-treatment patient-specific QA schemes. Liu et al.1) evaluated the dosimetric accuracy in segments of the VMAT arc based on the analysis of the portal dose distribution at regular time intervals during the VMAT. Woodruff et al.2) described a similar method for real time dose verification as part of an integrated transit planar dosimetry scheme3) in the delivery of the VMAT treatment. Time-resolved dosimetry4) is another popular method used to detect dosimetric error. Fuangrod et al.56) described the transit dosimetry-based watchdog system to determine real time machine errors at VMAT arc segments as part of a statistical process control scheme adopted to separate systematic and random errors of the treatment delivery. In this study, we intended to handle the approach on the compositional analysis as part of the machine QA, and not as a treatment plan verification approach. In this trial, we decomposed the overall error into arc segment errors, which were simply based on the angular intervals of the gantry rotation. We refer to this as a segmental analysis. This approach may not be able to track all the sources of compositional error, but it provides a simple approach with existing tools in any radiation therapy setup.
In this study, we first segmented the full arc of the VMAT plan in subsegmental arcs each of which subtended 30°, created the verification plan which corresponded to each subsegmental arc, delivered the segmental verification plans, and finally evaluated how the errors from the segmental analysis may correlate to the overall error in the effort to test the delivery accuracy based on the gantry angle.
Materials and Methods
This study aims to investigate the VMAT delivery errors which occurred in segments of an arc to determine the causes of the VMAT delivery error in the full arc. The MLC movement and dosimetric accuracy of the VMAT deliveries were investigated for this purpose. The maximum root-mean-square error (maxRMS) of the MLC position is the measure of the MLC position accuracy, whereas the gamma passing rate (GPR) and the difference of the measured to the planned doses constitute the measures of dosimetric accuracy.
1. Equipment and tools
In this study, we used a Novalis Tx (Varian Medical Systems, Palo Alto, CA, USA) medical LINAC to deliver the VMAT QA plan. The plan was constructed with an Eclipse (version 11; Varian Medical Systems) treatment planning system (TPS). The TPS was also used for portal dose evaluation. The LINAC was capable of delivering 6 and 10 MV nominal energy X-ray at maximum dose rate of 600 monitor units (MUs)/minutes for VMAT. It was equipped with an HD120 MLC system, which consisted of 60 pairs of tungsten alloy leaves and an amorphous silicon MV electronic portal imaging device (EPID) (PortalVision aS1000; Varian Medical Systems), which was attached to an E-type supportive arm (Exact-arm), and which was held at a source-to-surface distance (SSD) of 1000 mm during portal dosimetry. For VMAT treatment planning, we used the progressive randomized optimization algorithm7) for aperture optimization and anisotropic analytical algorithm89) for dose calculations. We used the portal dosimetry module of the TPS to predict the portal dose from the treatment plan, calculated the two-dimensional (2D) dose distribution from the measured portal dose image, and evaluated the accuracy of the planar dose distribution. The module used the portal dose image prediction (PDIP) algorithm to calculate the planar dose distribution from the portal dosimetry with the use of the portal dose image. Van Esch et al.10) and Eclipse Photon and Electron Algorithms Reference Guide9) provide the theoretical and technical details of the PDIP algorithm, while Eclipse Portal Dosimetry Reference Guide11) provides the detailed algorithm for gamma analysis and the working procedure of the portal dosimetry module.
In this study, we used a specialized VMAT QA plan, which was developed for a real VMAT treatment plan of target structures in the head and neck region in real patient image, and which mapped to the same region of the high-definition Korean man (HDRK_Man) reference. The HDRK_Man12) is a reference computational human phantom, developed at the Hanyang University Radiation Engineering Laboratory (HUREL). We refer to this QA plan as the Plan-Class Specific Reference (pcsr) QA plan of head and neck class. Rahman et al.13) demonstrated the details of the procedure for the development of pcsr QA plans. The pcsr QA plan was a double arc VMAT plan with a jaw opening with an area of 195×168 mm2 and 181°–179° arc ranges for the delivery of a dose of 225 cGy with 6 MV nominal energy X-rays.
MATLAB (version R2017; MathWorks, Natick, MA, USA) programs were used for the calculation of the maxRMS of the MLC position and for the estimation of the differences between the measured and calculated portal doses. The MLC position error in each 0.05 seconds of VMAT interval was calculated from the actual and planned positions in the dynalog file.14) The dose difference was calculated from the difference between the predicted and the measured portal dose which were collected from the ARIA server using the portal dosimetry module of the TPS.
2. Segmental arcs
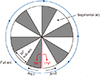
For the purpose of this study, two sets of portal dose quality assurance (PDQA) plans were prepared for portal dosimetry: one involved the measurement of the portal dose for full arc delivery, and the other split each full arc into 12 arc segments or sub-arcs (the first 11 segments subtended angles of 30° and the last segment an angle of 28°) to provide a total of 24 portal doses from the plan. Fig. 1 shows the symmetric diagram of the full and segmented arc VMAT deliveries. The PDQA plans for two full arcs and for the l2 segments for each of the arcs were created with the TPS.
3. Plan evaluation
1) Multileaf collimator position accuracy
The task group (TG) report 14215) places emphasis on the MLC performance analysis, because the MLC movement error is the key factor among the factors that disturb the radiation beam modulation and that cause dose distribution errors. In addition to the picket fence test, these guidelines suggest dynalog file analyses and the incorporation of the tolerance level of maxRMS of the MLC position following its calculation from the dynalog file. Each beam delivery provides two dynalog files, one assigned to each leaf bank. We can collect these from the four-dimensional integrated treatment console (4DITC), that is, from the computer console of any pre-TrueBeam Varian LINAC operation after the delivery of the beam. The Dynalog File Viewer Reference Guide14) provides these file details.
We collected the dynalog files of the PDQA plan deliveries. There included four files for the full arc, and 48 files for the segmented arc PDQA plan delivery. Dynalog files contain planned and actual MLC position data in ASCII file format. Accordingly, the MATLAB program extracted the data from all VMAT sessions. Leaf positions were then multiplied with the magnification factor of 1.966. Given that the dynalog file contained leaf positions at their physical plane,14) we evaluated all leaf positions on the horizontal plane through the isocenter. The magnification factor was the ratio of the distance between the source to the MLC bottom and the distance from the MLC bottom to the horizontal plane through the isocenter. The MLC location information was collected from the DICOM radiotherapy (RTPLAN) file.16) Only the positions of active MLC leaves determined from the beam on the tag in the dynalog file were considered for the calculation of the MLC position errors because only these positions affected the dose distribution. In the MLC position error calculation, we also incorporated the MLC positions of the transient periods. Agnew et al.17) elaborated on the behavior of the MLC movement in the context of beam delivery in the transient period. We used equation 1 to calculate the root-meansquare (RMS) error of the MLC positions for each MLC leaf. The maximum RMS error value among all the active leaves was the maxRMS of an arc or sub-arc.
RMS error of MLC position

2) Dosimetric accuracy
An accurate dose distribution is the result of an accurate LINAC performance in delivering VMAT plans. The TPS calculates it for the beam model of the LINAC that is constructed with beam data acquired during the commissioning of the LINAC. This beam model is unlikely to change in the cases of different VMAT plans. In this study, we evaluated the dose distribution accuracy of the VMAT QA plan in terms of the gamma index and dose difference in each pixel of the EPID. We calculated the dose difference from the predicted and measured dose distributions, as measured in the portal dosimetry. We evaluated the dose distribution errors which occurred in each arc and segmented arc of the pcsr VMAT QA plan delivery scheme.
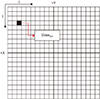
The portal dosimetry module of the Eclipse TPS allowed us to estimate the predicted and measured portal dose in a text file format. The dose in each pixel (with a size of 0.392×0.392 mm2) of the EPID was extracted from the text file with a MATLAB program. This yielded a dose matrix for the predicted and measured dose distributions. Pixelby-pixel dose differences were calculated with equation 2, whereby i and j respectively represent the position tag numbers in the X and Y directions (Fig. 2). The RMS dose difference was the RMS value of the dose differences in all the pixels, as calculated with equation 1. In the RMS dose difference calculation, we did not consider the dose points of the region outside the irradiated area of the EPID.
2D gamma analysis is the only procedure that guidelines18192021222324) recommend evaluating the dose distribution accuracy. In gamma analysis, the normalization mode was set to absolute, and the local gamma threshold was set to 20%. We used the improved gamma algorithm for global gamma analysis in the area encompassed by the completely irradiated area outline in addition to a margin of 10 mm. Additionally, we evaluated the difference between the predicted and measured doses. We checked whether there was significant GPR and dose differences for the full arc and for each segment of each arc. Thus, we could determine whether there were significant declines in the LINAC performance in any of the segments of the arc.
Results
1. Multileaf collimator position accuracy
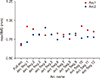
We analyzed the maxRMS of MLC position in the PDQA of two full arcs and 12 segments in each of these arcs. In arc1 and arc2, maxRMS were 0.67 and 0.69 mm, respectively. In arc segments, maxRMS was slightly greater than that of the full arc. In this study, 0.84±0.10 and 0.80±0.10 mm (95% confidence interval) were in arc1 and arc2, respectively, when the PDQA of arc segments were delivered. In all arc segments, the MLC position error was almost consistent. It ranged from 0.75 to 0.92 mm in segments of arc1 and from 0.71 to 0.91 mm in segments of arc2. The distribution of the maxRMS values of the two full arcs and their arc segments are shown in Fig 3.
2. Dosimetric accuracy
We evaluated the portal dose data of the full and segmented arcs in the PDQA plan delivery to investigate dosimetric consistency of the LINAC, which in turn determines machine errors in different segments of the arc. We investigated comparative gamma passing rates for VMAT with continuous full arc delivery and for segmented arc delivery. We also calculated the dose difference distributions and RMS values of pointdose differences because the gamma index is a combination of the dose difference and distance to agreement.
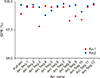
We have performed the gamma analysis with the 3%–3mm gamma criteria according to the recommendations in the guidelines.20212225) Fig. 4 shows the gamma passing rate for the full arc PDQA plan and its segmented delivery schemes. In PDQA of all form of arc deliveries, the gamma passing rate was >95% gamma passing rate, the recommended dosimetric accuracy level according to the guidelines. The gamma passing rate was 98.9 and 99.7% in continuous delivery of arc1 and arc2, respectively. The achieved gamma passing rate in arc segments were similar to that achieved in full arcs. It was 99.13±1.27 and 99.50%±0.60% (95% confidence interval) in segmented delivery of arc1 and arc2, respectively. The statistics of gamma passing rate in segmented delivery of both of the arcs showed a good consistency.
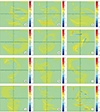
Fig. 5 shows the dose difference inside the area enclosed by the X and Y jaw which spans the 12 segments of arc1. The dose difference was similar in all arc segments, and it was within ±2.5 CU in most of the exposed area. However, the maximum dose differences in arc segments were considerably different. Additionally, there was a general trend of harmonic variations of the maximum dose differences from the first to the 12th arc segment of arc 1, which were equal to 8.55, 8.96, 5.98, 4.55, 4.63, 12.03, 7.40, 3.28, 5.25, 5.15, 6.64, and 11.73 CUs. A similar trend of dose difference was observed in the segments of arc 2.
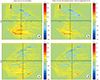
The dose difference in full arc delivery is the accumulated dose difference in the segments of the arc. Fig. 6a, c respectively show the dose differences which occurred in the continuous delivery of arc1 and arc2. In general, the dose difference was <5 CU in both of these full arcs. The maximum dose differences were ~±44 and ±32 CUs in deliveries of arc1 and arc2, respectively, when the arcs were delivered continually. Fig. 6b, c show the accumulated dose differences which occurred in the segmented deliveries of arc1 and arc2, respectively. There was no significant difference between the distributions of dose, as observed in the continuous and segmented arc delivery schemes.
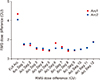
The RMS dose difference was consistent in the arc segments and was always less than that of the full arcs. Fig. 7 shows the RMS dose difference for all arc and segmented arc deliveries. All the RMS dose differences were ~1 CU. There are no guidelines for the evaluation of this dose difference based on acceptance levels.
Discussion
In ideal clinical practice, mechanical and dosimetric performances of the LINAC should be consistent in all parts of the arc during any VMAT session to ensure accurate dose distribution. However, the dose distribution would be affected in certain arc segments around a gantry angle, if any error source is associated to the gantry angle of the LINAC. We divided the full-arc of a double arc VMAT plan into arc segments, and investigated whether there were significant differences pertaining to MLC movement errors or dose distribution errors in comparison to those of the full arc. The earlier works123456) reported the use of arc segment analysis to evaluate the VMAT delivery accuracy. These works used additional systems for grabbing EPID image frame and comparing those with predicted dose image in terms of gamma passing rate. VMAT delivery error analysis was not the objective of these works. In this work, we used the tools of the TPS for PDQA of the continuous full arc and the arc segments. We analyzed the dynalog file and dose difference to find VMAT delivery error. Therefore, one can easily use this method with available tools of the clinical setup.
The movements of the MLC leaves can be affected differently by the gravitational force in different sections of the arc during the delivery of the VMAT.2627) Therefore, it is important that the MLC controller can maintain consistent MLC mechanical motion throughout the full arc. TG 142 report15) incorporated the value of 3.5 mm of maxRMS of MLC position as the acceptable MLC position error. In this study, maxRMS was much smaller than the tolerance level in the PDQA of full arc and arc segments. Also, in all the arc segments, the MLC position error was almost consistent. This represents a good performance for the MLC controller of the LINAC. In the segmented delivery of both arcs, the MLC position error was slightly elevated in comparison to the full arc, possibly owing to the increased acceleration of the MLC.1726272829) However, the level of the MLC position error was not significant in causing distribution errors of clinical significance.29) The MLC position error was less or similar to that found in other studies.1729303132333435) Thus, the MLC position errors in all the arc segments were acceptable. Correspondingly, the LINAC could consistently maintain the movements of the MLC leaves in all the segments of both of arcs to deliver accurate VMAT. Our previous studies revealed that the scale of the MLC position error36) and the largest MLC position error37) does not significantly differ in different sessions of a VMAT plan delivery if the LINAC performance is not degraded with time. Thus, the MLC performance in segmental arcs can be a measure of the LINAC performance during QA.
The dose distribution in typical VMAT delivery is inhomogeneous. The objective for the QA of the LINAC is to find the sources of the error pertaining to the delivery the VMAT. The dose distribution accuracy of the VMAT delivery represents the success of the QA scheme. The gamma index provides a quantitative dosimetric error which considers both the dose localization and dose difference. Expectedly, the gamma passing rates for the arc segments were generally higher than those of the corresponding full arc because the gamma index of the full arc is the sum of the gamma indices of all the arc segments. The gamma passing rate achieved by the arc segments were better than that reported by Woodruff et al.2) for the sub-arcs in their study. This proves that the LINAC performance was good and consistent in the delivery of the PDQA plan for both the continuous, full arc, and segmented arc cases.
The gantry rotation does not have a major influence on the dose distribution error. This is because the dose distribution will be unlikely affected much by small gantry position errors in the case the latter is maintained to values <1° during the delivery of the VMAT.31) Oliver et al.38) reported that random and systematic gantry position errors up to 1° were relatively insignificant despite the fact that there was a change in the three-dimensional (3D) dose distribution of the gantry position error. Liang et al.39) reported that the gamma passing rate for the portal dosimetry is not sensitive to gantry angle values less than 3°. Therefore, in this study we concentrated on the dependence of dose errors on the arc segment and not on the gantry position error.
We did not observe very low gamma passing rates in subarc portal doses like that reported by Fuangrod et al.6) in their study of gamma indices in segments in conventional intensity-modulated radiation therapy (IMRT). This may be attributed to the different beam modulation techniques adopted in the two cases. This study proved the efficacy of the use of the pcsr QA plan for the evaluation of the LINAC performance in the consistency of dose delivery in arc segments for VMAT. There was no considerable difference between the dose distributions of the continuous and segmented arc delivery schemes. This indicates that the LINAC could deliver the VMAT plan consistently both in the continuous and segmented arc schemes.
We calculated the dose difference at each pixel of submillimeter dimension (0.392×0.392 mm2) of the EPID from the predicted and measured doses. We then calculated the RMS dose difference in each full and segmented arc in the delivery of VMAT. The dose difference was calculated in calibration units (CUs) (for details on CU please refer to the portal dosimetry reference guide11)). The dose difference was similar in all arc segments, and indicates that the dose distribution was not prone to any specific gantry angle. However, in a general sense, in the light of the International Commission on Radiation Units and Measurements (ICRU) report 83,24) the dosimetric accuracy in the delivery of the plan was appropriate, and the machine was consistent in delivering the VMAT plan in arc segments and continuous arcs.
Even though the dose difference was not large enough in comparison to the total delivered dose, there was a minor elevation of the RMS dose difference in the 6th segment (331°–1°) of arc1 that is effectively representative of the dose difference map (Fig. 5f) in the PDQA plan. The dose difference in this segment had a major effect on the total error (Fig. 6a, b) in the arc. We can estimate the MLC position error, gantry position error, dose delivery error, or any other machine error, using the information of the position of the dose difference in the field in the context of the dose delivered to the individual segment. It would be cumbersome to detect this machine error (if any) if we analyze the accumulated dose difference of the arc.
The method used to evaluate the dose difference in the arc segments may help the identification of mechanical problems in the delivery system and EPID. The studies based on arc segments <30° may make the job of searching error sources easier, but there should be a tradeoff between the segment range and noise in the data.1) This study detected several issues that could not be found with typical gamma analysis. These studies help us achieve increased accuracy in the dose distribution during the delivery of the VMAT. Despite our efforts, we were unable to identify any other similar studies in the literature to compare our calculated dose differences.
In this trial, we have not evaluated other machine parameters, like the gantry position and the dose rate errors, which are also involved in beam intensity modulation for VMAT. These parameters could be evaluated from actual gantry position and dose in each control point (CP), as collected from 4DITC, either in the segmented tolerance table (STT) of the dlog file,32) or from the display in the treatment console monitor just after the completion of the VMAT delivery.40) This constitutes work-in-progress.
Conclusions
In this study, we developed and tested the concept of segmental quality assurance for VMAT deliveries. We analyzed the dose distribution of the arc segments or sub-arcs to investigate the segmental sources of errors that occurred in VMAT delivery. According to the findings of this study, the medical LINAC that was used in this study showed good performance with the gantry angle.
The segmental analysis proposed in this study is unable to track the sources of dosimetric errors but may be useful in the prediction of the VMAT delivery error in relation to the gantry angles. The currently available QA guidelines do not include real VMAT plan delivery schemes. Accordingly, this study revealed that the pcsr QA plan can achieve a superior performance compared to the test plans of the IMRT QA guidelines. Based on the observations of this study, we recommend the use of this type of analysis as part of regular machine QA. This practice can help us detect LINAC problems before the accelerator's use for VMAT.
 XML Download